. 2022 Aug 19;7(1):40.
doi: 10.1038/s41536-022-00237-4.

Vasculogenesis in kidney organoids upon transplantation

Affiliations

Vasculogenesis in kidney organoids upon transplantation

Marije Koning et al. NPJ Regen Med. .

Abstract

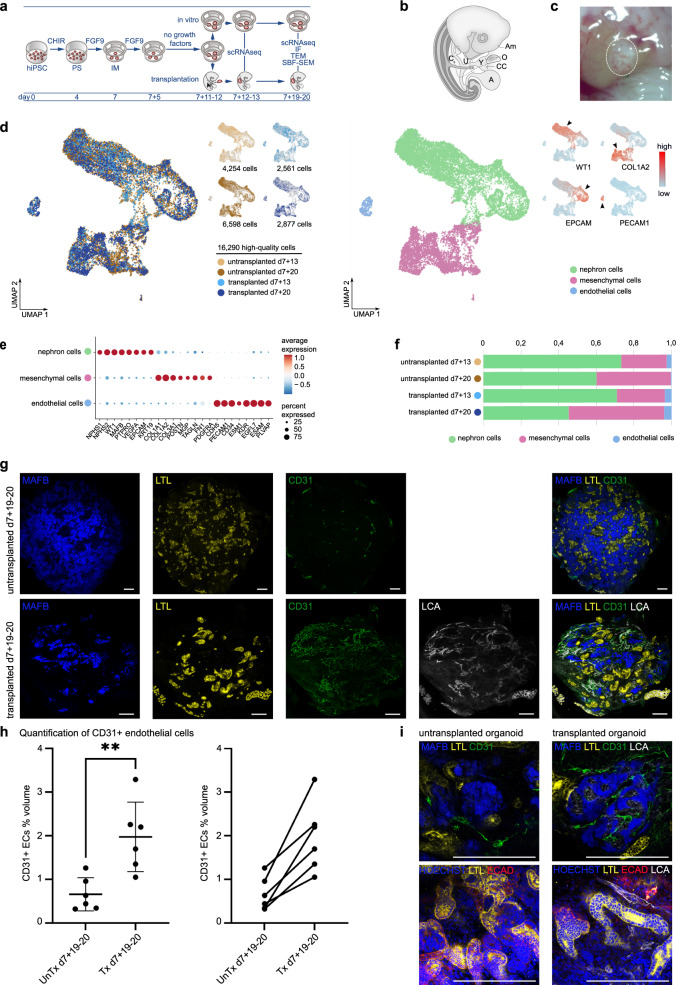
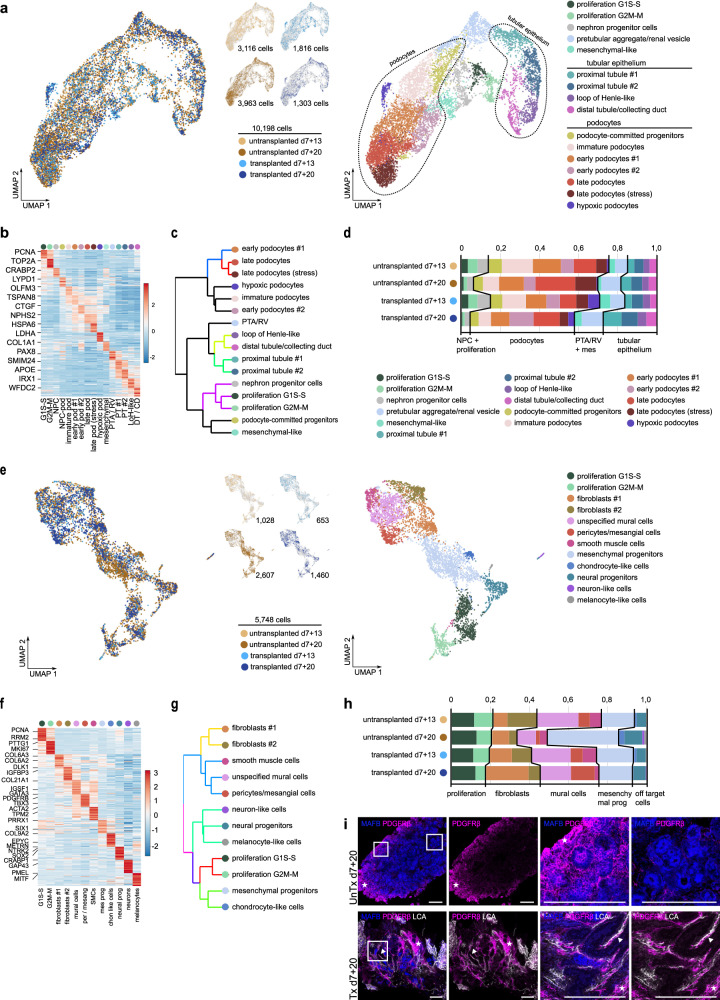
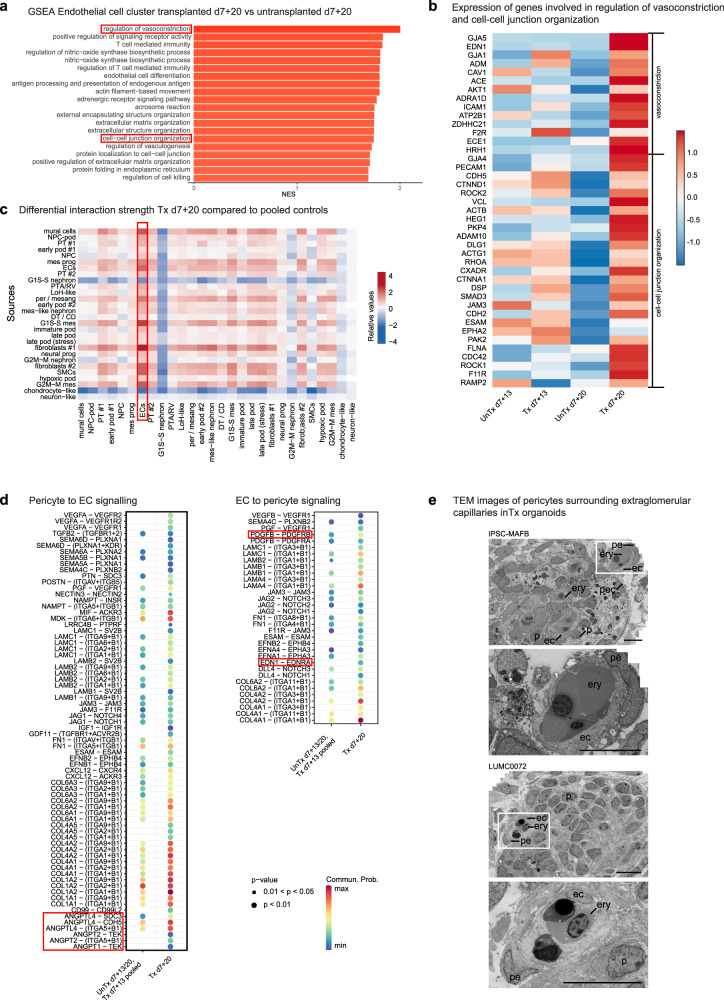
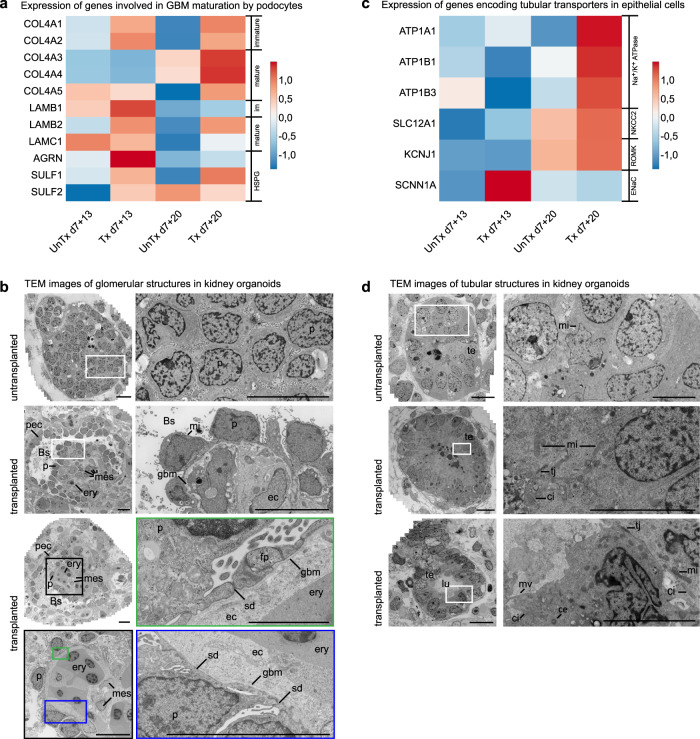
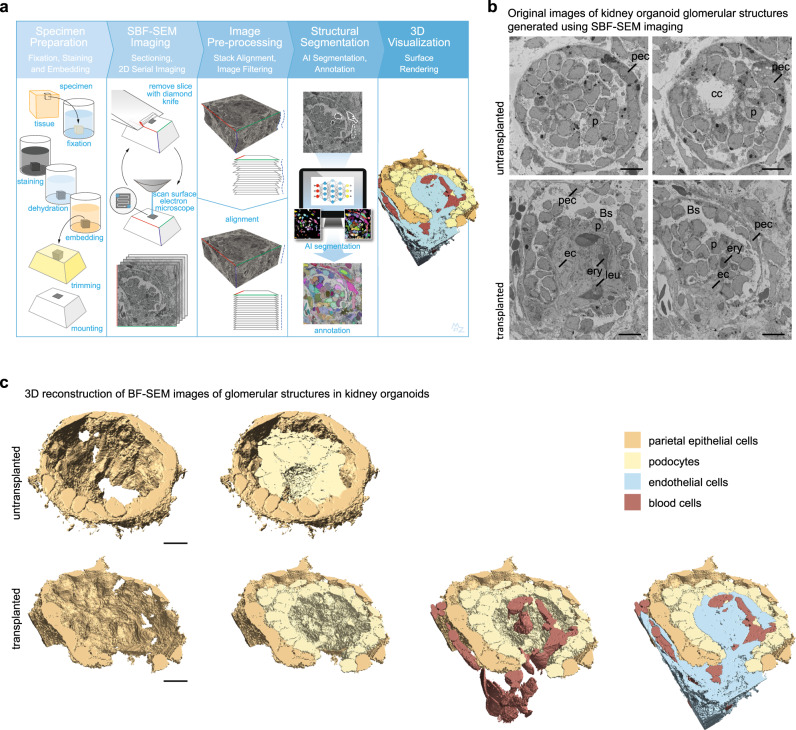
Human induced pluripotent stem cell-derived kidney organoids have potential for disease modeling and to be developed into clinically transplantable auxiliary tissue. However, they lack a functional vasculature, and the sparse endogenous endothelial cells (ECs) are lost upon prolonged culture in vitro, limiting maturation and applicability. Here, we use intracoelomic transplantation in chicken embryos followed by single-cell RNA sequencing and advanced imaging platforms to induce and study vasculogenesis in kidney organoids. We show expansion of human organoid-derived ECs that reorganize into perfused capillaries and form a chimeric vascular network with host-derived blood vessels. Ligand-receptor analysis infers extensive potential interactions of human ECs with perivascular cells upon transplantation, enabling vessel wall stabilization. Perfused glomeruli display maturation and morphogenesis to capillary loop stage. Our findings demonstrate the beneficial effect of vascularization on not only epithelial cell types, but also the mesenchymal compartment, inducing the expansion of ´on target´ perivascular stromal cells, which in turn are required for further maturation and stabilization of the neo-vasculature. The here described vasculogenic capacity of kidney organoids will have to be deployed to achieve meaningful glomerular maturation and kidney morphogenesis in vitro.


Conflict of interest statement

The authors declare no competing interests.

Figures

Fig. 1
Fig. 1. hiPSC-derived kidney organoids become vascularized upon transplantation in the coelomic cavity of chicken embryos.
a Schematic of the in vitro generation of kidney organoids and transplantation inside chicken embryos. HiPSCs were differentiated for 7 days as monolayer, followed by culture as organoids on an air liquid interface. On d7+11 or d7+12 of differentiation, they were either transplanted inside the coelomic cavity of HH23 chicken embryos or maintained in vitro. Transplanted organoids and untransplanted controls were harvested for analysis with scRNAseq 1 day after transplantation and for scRNAseq, IF, TEM, and SBF-SEM 8 days after transplantation. b Schematic of the method of transplantation inside the coelomic cavity of chicken embryos (modified from Dossel et al. Science 1954, with permission): a small hole is made in the chorion and amnion membrane using forceps, the bisected organoid is inserted into the coelom with a blunt instrument through this hole and the opening in the body wall that is still present at this stage of development. A allantois, Am amnion, C coelom, CC cut chorion membrane, O organoid, U umbilical ring, Y yolk stalk. c Macroscopic image of a vascularized kidney organoid (circled area) attached to the liver inside a day 12 chicken embryo. d UMAP visualization of a total of 16,290 high-quality human organoid cells obtained from untransplanted (4254 cells from d7+13, 6598 from d7+20) and transplanted (2561 cells from d7+13, 2877 from d7+20) kidney organoids, color-coded by condition (left) or main cell populations: nephron cells, mesenchymal cells and endothelial cells (right). Top right inset: UMAP plot color-coded by the expression level of WT1, COL1A2, EPCAM, and PECAM1 genes (red: high expression level, blue: low expression level). e Dot plot representing marker gene expression in organoid cell clusters. Dot size indicates proportion of cells in cluster expressing a gene, color intensity indicates the level of expression. f Relative cluster quantification for each condition, showing endothelial cell loss upon prolonged culture in vitro and maintenance upon transplantation. The proportion of nephron cells decreased in favor of mesenchymal cells in d7+20 compared to d7+13 organoids, with the highest proportion of mesenchymal cells in transplanted d7+20 organoids. Source data are provided as a source data file. g Immunofluorescent images of untransplanted (top) and transplanted (bottom) kidney organoids, showing glomerular (MAFB-BFP2 (blue)) and tubular (LTL (yellow)) structures and endothelial cells (CD31 (green)). In transplanted organoids the endothelial cells have formed a vascular network and have become perfused as demonstrated by the presence of injected LCA (white). Scale bars 200 µm. h Quantification of CD31 positive ECs as percent volume of organoid volume in whole mount untransplanted (untx) and transplanted (tx) organoids at d7+19–20. n = 6 untransplanted and six matched transplanted organoids from six different experiments. Left: Transplanted organoids contain significantly more EC volume than untransplanted controls (p < 0.01). Data are presented as individual data points, mean (SD). Unpaired two-tailed t-test was performed to compare means between group. Right: Alternative visualization demonstrating the increase in EC percent volume upon transplantation for each differentiation. Source data are provided as a source data file. i Top: Glomerular structures (MAFB-BFP2 (blue)) in untransplanted kidney organoids did not contain human endothelial cells (CD31 (green)), while these structures were invaded by endothelial cells (CD31 (green), LCA (white)) upon transplantation. Bottom: After incubation inside the chicken embryo, tubular structures (LTL (yellow) and ECAD (red)) were aligned by perfused capillaries (LCA (white)). Scale bars 200 µm. Images in g, i are based on >5 separate experiments and 3 cell lines (iPSC-MAFB (shown here), LUMC0072 (Supplementary Fig. 3), LUMC0020 (Supplementary Fig. 3)).
Fig. 2
Fig. 2. Heterogeneity of nephron and mesenchymal cell types in untransplanted and transplanted kidney organoids.
a UMAP visualization of a total of 10,198 high-quality nephron cells obtained from untransplanted (3116 cells from d7+13, 3963 from d7+20) and transplanted (1816 cells from d7+13, 1303 from d7+20) kidney organoids, color-coded by condition (left) and by cluster (n = 16; right). b Expression-level scaled heatmap of the top 20 marker genes in nephron subclusters. Scale: z-score of the gene expression level. Abbreviations: G1S-S: proliferative nephron cells G1S-S, G2M-M: proliferative nephron cells G2M-M, NPC: nephron progenitor cells, NPC-pod: podocyte-committed progenitors, immature pod; immature podocytes, early pod #1: early podocytes #1, early pod #2: early podocytes #2, late pod: late podocytes, late pod (stress): late podocytes (stress-induced), hypoxic pod: hypoxic podocytes, mesenchymal: mesenchymal-like nephron cells, PTA/RV: pretubular aggregate/renal vesicle, PT #1: proximal tubules #1, PT #2: proximal tubules #2, LoH-like: loop of Henle-like, DT/CD: distal tubules/collecting duct. c Hierarchical clustering of nephron cell types, color-coded according to P-value from multiscale bootstrap resampling analysis on all highly variable genes. d Relative cluster quantification of the nephron cell types in transplanted versus untransplanted kidney organoids (d7+13 and d7+20). Source data are provided as a source data file. e UMAP visualization of a total of 5748 high-quality mesenchymal cells obtained from untransplanted (1028 cells from d7+13, 2607 from d7+20) and transplanted (653 cells from d7+13, 1460 from d7+20) kidney organoids, color-coded by condition (left) and by cluster (n = 12; right). f Expression-level scaled heatmap of the top 20 marker genes in mesenchymal subclusters. Scale: z-score of the gene expression level. Abbreviations: G1S-S: proliferative mesenchymal cells G1S-S, G2M-M: proliferative mesenchymal cells G2M-M, mural cells: unspecified mural cells, per/mesang: pericytes/mesangial cells, SMCs: smooth muscle cells, mes prog: mesenchymal progenitors, chon like cells: chondrocyte-like cells, neural prog: neural progenitors. g Hierarchical clustering of mesenchymal cell types, color-coded according to P-value from multiscale bootstrap resampling analysis on all highly variable genes. h Relative cluster quantification of the mesenchymal cell types in transplanted versus untransplanted kidney organoids (d7+13 and d7+20). The color legend for this figure is the same as the one in (e). Source data are provided as a source data file. i Staining of PDGFRβ + stromal cells in untransplanted and transplanted kidney organoids reveals abundant PDGFRβ + stromal cells in the periphery of untransplanted organoids (asterix and first magnification) and scarce PDGFRβ + cells in the center (second magnification). Transplantation induces the appearance of perivascular stromal cells (PDGFRβ+, arrowhead and magnifications) supporting perfused blood vessel (LCA+). Magnifications of boxed areas are shown. Scale bars 200 µm.
Fig. 3
Fig. 3. Vessel wall stabilization in transplanted kidney organoids.
a Gene set enrichment analysis (GSEA) for EC cluster in transplanted d7+20 versus untransplanted d7+20 organoids demonstrating enrichment of gene sets associated with vasoconstriction and cell–cell junction organization. NES: normalized enrichment score. Source data are provided as a source data file. b Expression-level scaled heatmap of genes involved in vasoconstriction and cell–cell junction organization, demonstrating upregulation of the majority of these genes in d7+20 transplanted endothelial cells compared to all other conditions. Scale: z-score of the gene expression level. c Heatmap demonstrating differential interaction strength (probability of interactions) per cluster for d7+20 transplanted organoids compared to pooled controls (d7+13 transplanted and untransplanted and d7+20 untransplanted organoids). Abbreviations: mural cells: unspecified mural cells, NPC-pod: podocyte-committed progenitors, PT #1: proximal tubules #1, early pod #1: early podocytes #1, NPC: nephron progenitor cells, mes prog: mesenchymal progenitors, ECs: endothelial cells, PT #2: proximal tubules #2, G1S-S nephron: proliferative nephron cells G1S-S, PTA/RV: pretubular aggregate/renal vesicle, LoH-like: loop of Henle-like, per/mesang: pericytes/mesangial cells, early pod #2: early podocytes #2, mes-like nephron: mesenchymal-like nephron cells, DT/CD: distal tubules/collecting duct, G1S-S mes: proliferative mesenchymal cells G1S-S, imm pod; immature podocytes, late pod: late podocytes, late pod (stress): late podocytes (stress-induced), fibroblasts #1: fibroblasts #1, neural prog: neural progenitors, G2M-M nephron: proliferative nephron cells G2M-M, fibroblasts #2; fibroblasts #2, SMC: smooth muscle cells, hypoxic pod: hypoxic podocytes, G2M-M mes: proliferative mesenchymal cells G2M-M, chondrocyte-like: chondrocyte-like cells, neuron-like: neuron-like cells. d Dot plot of the ligand-receptor pairs for which interaction strength between pericytes and endothelial cells is increased in d7+20 transplanted organoids compared to pooled controls with (left) pericytes as source and (right) endothelial cells as source. e In transplanted kidney organoids, extraglomerular capillaries are supported by pericytes. ec endothelial cell, p podocyte, pe pericyte, pec parietal epithelial cell, ery erythrocyte. Scale bars 10 µm.
Fig. 4
Fig. 4. hiPSC-derived kidney organoids mature upon transplantation.
a Expression-level scaled heatmap of genes involved in GBM development in podocytes in untransplanted versus transplanted kidney organoids at different timepoints. COL4A3-5 and LAMB2 are upregulated in d7+20 transplanted podocytes compared to all other conditions, fitting with the switch from collagen IV α1α2α1 to collagen IV α3α4α5 and from laminin β1 to laminin β2 during GBM maturation. LAMC1 and AGRN, encoding laminin γ1 and agrin (a heparan sulfate proteoglycan HSPG) in the mature GBM are not upregulated in d7+20 transplanted podocytes, implying the GBM in the organoids is not fully matured. Scale: z-score of the gene expression level. b Transmission Electron Microscopy (TEM) imaging displays maturation of glomerular structures upon transplantation for 8 days. Podocyte clusters are invaded with capillaries containing erythrocytes and supported by mesangial cells. Parietal epithelial cells form a Bowman’s capsule, a glomerular basement membrane is deposited between the podocytes and endothelial cells, and rudimentary slit diaphragms are formed between primitive foot processes. Magnifications of the boxed areas are displayed, Bs Bowman’s space, ec endothelial cell, ery erythrocyte, fp foot process, gbm glomerular basement membrane, leu leukocyte, mes mesangial cell, mi mitochondrion, p podocyte, pec parietal epithelial cell, sd slit diaphragm. Scale bars 10 µm. Scale bar magnification marked in green 2 µm. c Expression-level scaled heatmap of genes encoding tubular transporters in untransplanted versus transplanted kidney organoids at different timepoints. Expression of genes encoding the transporters Na+/K+ ATPase, NKCC2 and ROMK are upregulated in transplanted organoids at d7+20. SCNN1A, which encodes the α-subunit of the ENaC channel, is not upregulated. Scale: z-score of the gene expression level. d Upon transplantation for 8 days, tubular structures also show signs of maturation. Tubular epithelial cells have formed a monolayer and their nuclei have moved toward the basolateral side of the cell. Tight junctions, cilia, a centriole, microvilli and abundant mitochondria are visible. ce centriole, ci cilium, lu lumen, mi mitochondrion, mv microvilli, te tubular epithelium, tj tight junction. Scale bars images left row 10 µm, scale bars magnifications right row 5 µm. TEM Images based on 5 transplanted organoids from 2 experiments using 2 cell lines (MAFB (here)) and LUMC0072 (Supplementary Fig. 1C, D).
Fig. 5
Fig. 5. SBF-SEM followed by 3D reconstruction enables analysis of the 3D organization of organoid glomerular structures and reveals maturation to capillary loop stage.
a The SBF-SEM imaging workflow comprises five steps. First the specimen is prepared for imaging by chemical fixation, staining with heavy metals, dehydration and embedding in resin, after which it is prepared for imaging by trimming the block and mounting for SEM. SBF-SEM imaging is performed inside the microscope and consists of alternating sectioning and imaging steps, by which a stack of images through the specimen block is generated. Image pre-processing is performed by image alignment and filtering. Segmentation of cell structures, such as nucleus, mitochondria and endoplasmic reticulum was performed by Artificial Intelligence methods followed by manual annotation of cell types. Visualization of images and movies is performed by surface rendering of segmented structures. b Images generated by SBF-SEM of glomerular structures in untransplanted (top) and transplanted (bottom) kidney organoids (iPSC-MAFB). For full Z-stacks, see Supplementary Movies 1, 2. Bs Bowman’s space, cc central cavity, ec endothelial cell, ery erythrocyte, leu leukocyte, p podocyte, pec parietal epithelial cell. Scale bar 10 µm. c 3D reconstruction of the SBF-SEM datasets in B and Supplementary Movies 1, 2. In the untransplanted glomerular structure (top) a layer of parietal epithelial-like cells (beige) is visible surrounding a cluster of podocytes (yellow) containing a central cavity. In the transplanted glomerular structure (bottom) a perfused capillary (endothelial cells in blue, blood cells in red) invades the glomerulus and forms a single loop inside the glomerulus. The podocytes (yellow) have reorganized around the capillary and the PECs (beige) have adopted a more flattened phenotype. For 360° view of the 3D reconstructions, see Supplementary Movies 5, 6. Scale bar 10 µm. For SBF-SEM analysis, 2 transplanted organoids and 1 untransplanted organoid, all differentiated from iPSC-MAFB, were used to generate 4 datasets of untransplanted and 3 datasets of transplanted glomerular structures. 2 datasets (1 transplanted and 1 untransplanted) were used for the 3D visualization shown in (c).

References

    1. Taguchi A, et al. Redefining the in vivo origin of metanephric nephron progenitors enables generation of complex kidney structures from pluripotent stem cells. Cell Stem Cell. 2014;14:53–67. doi: 10.1016/j.stem.2013.11.010. - DOI - PubMed
    1. Morizane R, et al. Nephron organoids derived from human pluripotent stem cells model kidney development and injury. Nat. Biotechnol. 2015;33:1193–1200. doi: 10.1038/nbt.3392. - DOI - PMC - PubMed
    1. Takasato M, et al. Kidney organoids from human iPS cells contain multiple lineages and model human nephrogenesis. Nature. 2015;526:564–568. doi: 10.1038/nature15695. - DOI - PubMed
    1. Freedman BS, et al. Modelling kidney disease with CRISPR-mutant kidney organoids derived from human pluripotent epiblast spheroids. Nat. Commun. 2015;6:8715. doi: 10.1038/ncomms9715. - DOI - PMC - PubMed
    1. Eremina V, et al. Glomerular-specific alterations of VEGF-A expression lead to distinct congenital and acquired renal diseases. J. Clin. Invest. 2003;111:707–716. doi: 10.1172/JCI17423. - DOI - PMC - PubMed