. 2022 Aug 19;8(1):30.
doi: 10.1038/s41540-022-00242-9.

An expanded whole-cell model of E. coli links cellular physiology with mechanisms of growth rate control

Affiliations

An expanded whole-cell model of E. coli links cellular physiology with mechanisms of growth rate control

Travis A Ahn-Horst et al. NPJ Syst Biol Appl. .

Abstract

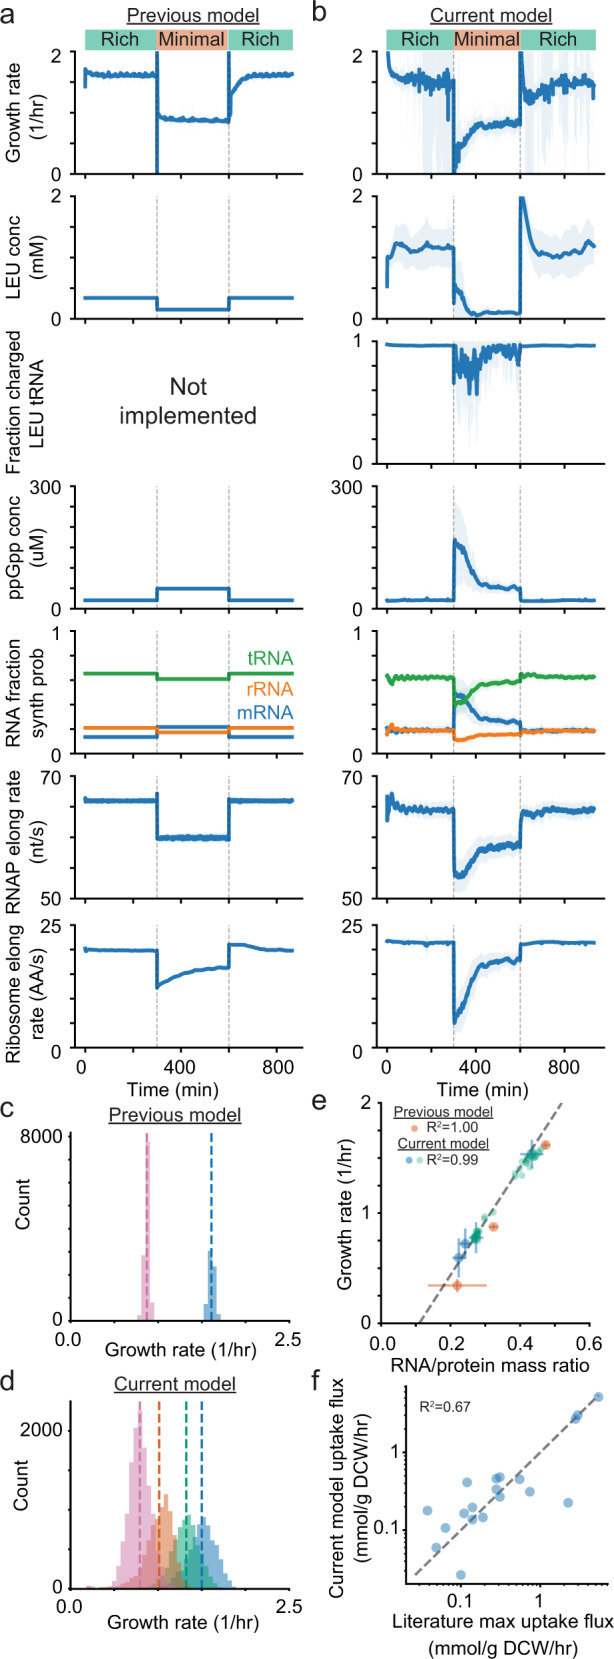
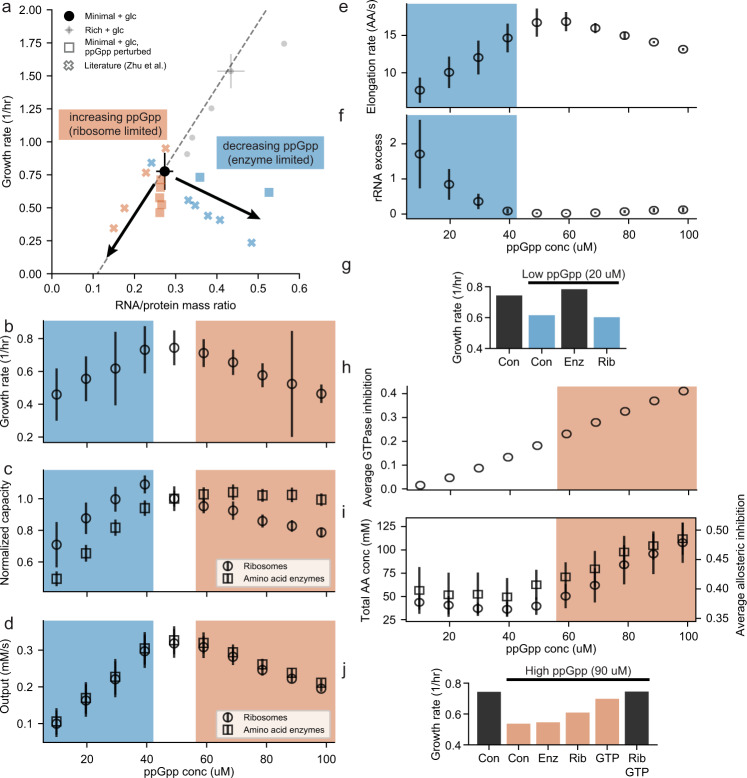
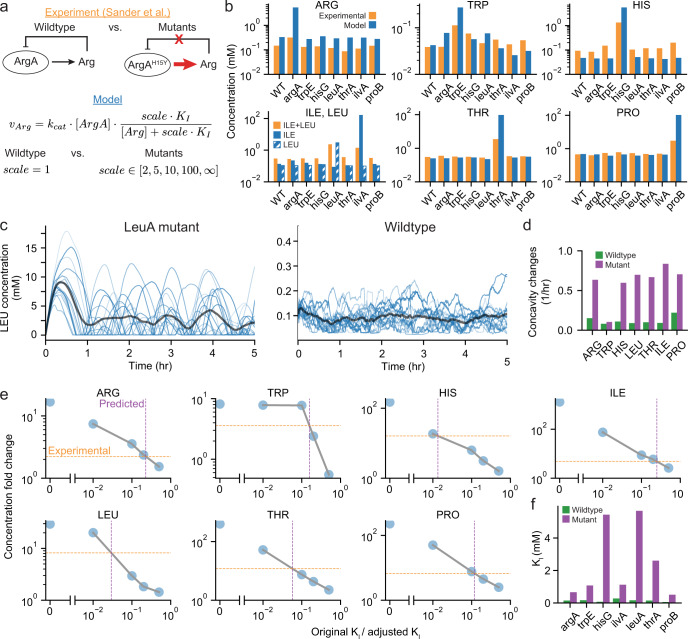
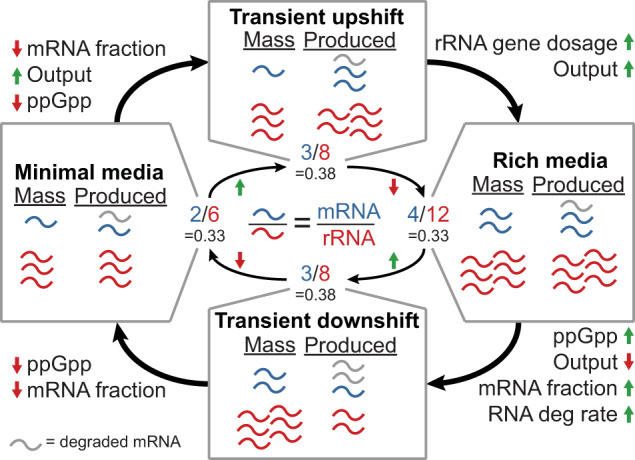
Growth and environmental responses are essential for living organisms to survive and adapt to constantly changing environments. In order to simulate new conditions and capture dynamic responses to environmental shifts in a developing whole-cell model of E. coli, we incorporated additional regulation, including dynamics of the global regulator guanosine tetraphosphate (ppGpp), along with dynamics of amino acid biosynthesis and translation. With the model, we show that under perturbed ppGpp conditions, small molecule feedback inhibition pathways, in addition to regulation of expression, play a role in ppGpp regulation of growth. We also found that simulations with dysregulated amino acid synthesis pathways provide average amino acid concentration predictions that are comparable to experimental results but on the single-cell level, concentrations unexpectedly show regular fluctuations. Additionally, during both an upshift and downshift in nutrient availability, the simulated cell responds similarly with a transient increase in the mRNA:rRNA ratio. This additional simulation functionality should support a variety of new applications and expansions of the E. coli Whole-Cell Modeling Project.


Conflict of interest statement

The authors declare no competing interests.

Figures

Fig. 1
Fig. 1. A detailed, holistic model of growth rate control has been incorporated into the E. coli Whole-Cell Modeling Project.
a A schematic representing biological functions and regulation that link the environment to growth. Black arrows represent mass flow, red arrows indicate regulatory inhibition and green arrows represent activation. b A schematic illustrating the integration of the biological functions in (a) in the context of the E. coli whole-cell model by including regulatory interactions and kinetic reaction rates. Such integration allows the growth rate to be determined by the simulation state, which is responsive to the simulated environment of interest. Dashed lines represent the link between the new mathematical representations and existing modeling processes that were modified. The resulting model includes more gene functions, accounts for the action of more small molecules, and can accommodate simulations in more environments.
Fig. 2
Fig. 2. Incorporation of the growth rate model results in simulation responses to environments and environmental shifts that are more accurate for well-characterized environments, and more biologically reasonable in less well-characterized environments.
Time series data show a nutrient downshift (green to orange) following by a nutrient upshift (orange to green) over 28 cell generations in the previous model (a) and the current model (b). The mean of 32 initial seeds is shown as the dark blue line with the light blue region showing the standard deviation. c Distributions of growth rates from 24 generations and 24 initial seeds from the previous version of the model in minimal (pink) and rich (blue) media with dashed lines showing the mean value. d Distributions of growth rates from 24 generations and 24 initial seeds from the current version of the model with new conditions (orange and green) that are not directly parameterized and include arbitrary amino acid combinations in the media. e Relationship between growth rate and RNA/protein ratio for multiple environmental conditions. The three possible media conditions from the previous model are shown in orange, new media conditions used for parameterization (and simulated) are in blue, new media conditions that are not directly parameterized are in green. The dashed line is a reference fit to data reported in literature (Bremer and Dennis). f Calculated amino acid uptake rates in the model compared to the maximum uptake rate observed during a growth time series in literature (Zampieri et al.).
Fig. 3
Fig. 3. ppGpp regulation of growth depends on two small molecule feedback inhibition pathways in addition to regulation of gene expression.
a Growth rate vs RNA/protein mass ratio for simulations with perturbed ppGpp concentrations (squares and circles) and literature (crosses and dashed line). Colored points represent minimal glucose media conditions with blue indicating low ppGpp with metabolic enzyme limitations and orange indicating high ppGpp with ribosome limitations. Black arrows indicate the expected trends when ppGpp is perturbed. Average growth rate (b), average capacity of ribosomes (circles) or amino acid enzymes (squares) normalized to wildtype capacity (c), average total output rates from ribosomes (circles) and amino acid enzymes (squares) (d), average elongation rate per ribosome (e), and average fraction of ribosome mass that is excess rRNA mass and not included in ribosomes (f) from simulations at various concentrations of ppGpp. Blue boxes indicate ppGpp concentrations leading to enzyme limitations while orange boxes represent ppGpp concentrations leading ot ribosome limitations. g Average growth rate from simulations at wildtype ppGpp concentrations, low ppGpp concentrations, and low ppGpp concentration with expression modifications (con: control, enz: increased enzyme expression, rib: increased ribosome expression). Average GTPase inhibition by ppGpp (h) and total amino acid concentrations (left, circles) leading to an average amino acid pathway allosteric inhibition (right, squares) (i) from simulations at various concentrations of ppGpp. j Average growth rate from simulations at wildtype ppGpp concentrations, high ppGpp concentrations, and high ppGpp concentration with expression and/or GTPase modifications (con: control, enz: increased enzyme expression, rib: increased ribosome expression, GTP: remove inhibition of GTPases). Simulation data comes from 6 generations and 8 initial seeds (4 initial seeds for g and j) and error bars represent standard deviation.
Fig. 4
Fig. 4. Simulations with amino acid allosteric inhibition removed provide amino acid concentration predictions that are comparable to experimental results.
a Schematic showing the effect of mutants experimentally, where point mutations remove allosteric inhibition of the amino acid end-product on a pathway enzyme leading to higher amino acid concentrations, and in the model, where the mutation is represented as a scaling factor that increases the end-product inhibitory concentration (KI) that increases the rate of amino acid production. b Amino acid concentrations in wild-type cells and mutants with allosteric inhibition removed from experiments (orange, Sander et al.) and the model with scale = infinity (blue). Note that isoleucine and leucine cannot be distinguished experimentally but have distinct concentrations in the model (solid: isoleucine, hatched: leucine). See Supplementary Table 4 for the standard deviation for simulations. c Time series for leucine concentrations for LeuA mutant without allosteric inhibition showing oscillatory concentrations without the fast feedback of enzyme inhibition compared to the wildtype with allosteric inhibition. Blue traces show individual cell lineages and the average is shown in gray. d Average frequency of concavity changes for each amino acid concentration from wildtype simulations and the mutant simulations corresponding to the amino acid. This is a proxy for 1/period if the fluctuations were regular and periodic. e Predictions of the extent of inhibition removal based on the concentration fold changes in experiments compared to simulation fold changes. f Allosteric feedback inhibition constants for each enzyme for reported wildtype value (green) and effective KI in mutants based on analysis in (d) (purple). Simulation data comes from 16 generations and 16 initial seeds for (b), (c), and (d) and 8 generations and 4 initial seeds for (e) and (f).
Fig. 5
Fig. 5. Environmental shifts temporarily deviate from the expected growth rate vs RNA/protein ratio trend as the cell reallocates biomass to optimize growth.
Growth rate and RNA/protein mass ratio plotted over time starting in rich media, removing amino acids from the media and adding amino acids back once the cell has adjusted to the new media with all regulation (a), no mechanistic amino acid supply (b) and no ppGpp regulation (c). The blue trace is an average of 32 cell lineages with circles indicating each hour of simulation. The stringent response shows a sharply suppressed growth rate immediately after an environmental downshift with all regulation. Without modeling kinetic amino acid supply, translation is not as limited so the full stringent response will not be activated. Without ppGpp regulation, the cellular composition has limited reorganization because there is not a differential response between the RNA and protein growth rates and the effect of the stringent response can be seen in the difference in growth rate response when compared to having ppGpp regulation included. Growth rate of RNA (light purple) and protein (dark purple) fractions of the cell over time are shown for all regulation (d), no mechanistic amino acid supply (e) and no ppGpp regulation (f). A higher protein growth rate will result in a decreasing RNA/protein ratio, while a higher RNA growth rate will result in an increasing RNA/protein ratio. RNA polymerase output (g), RNA degradation rate (h), and mRNA to rRNA mass ratio (i) for simulations with all regulation included (blue) compared to simulations with no ppGpp regulation (gray). Data comes from 28 generations and 32 initial seeds.
Fig. 6
Fig. 6. Transient increases in the mRNA to rRNA ratio arise through different mechanisms during nutrient up- or downshifts.
Schematic demonstrating a toy example of how an increase or decrease in ppGpp concentration can lead to similar increases in the mRNA to rRNA ratio. “Mass'' represents the amount of RNA (blue: mRNA, red: rRNA, gray: degraded mRNA) that would already be present at the start of a cell cycle and “Produced'' represents the number that will be produced throughout a cell cycle. Note that in minimal or rich media there is balanced growth with mRNA and rRNA both doubling; however, during transient shifts, these amounts need not be balanced. Text in the outer corners describes significant changes when shifting from one box to another based on simulation observations. In the center, the mRNA to rRNA ratio is shown for each condition with the transient shift conditions both showing higher ratios than the steady state minimal or rich media.

References

    1. Scott M, Gunderson CW, Mateescu EM, Zhang Z, Hwa T. Interdependence of cell growth and gene expression: origins and consequences. Science. 2010;330:1099–1102. doi: 10.1126/science.1192588. - DOI - PubMed
    1. Scott M, Klumpp S, Mateescu EM, Hwa T. Emergence of robust growth laws from optimal regulation of ribosome synthesis. Mol. Syst. Biol. 2014;10:747. doi: 10.15252/msb.20145379. - DOI - PMC - PubMed
    1. Belliveau NM, et al. Fundamental limits on the rate of bacterial growth and their influence on proteomic composition. Cell Systems. 2021;12:924–944. doi: 10.1016/j.cels.2021.06.002. - DOI - PMC - PubMed
    1. Erickson DW, et al. A global resource allocation strategy governs growth transition kinetics of Escherichia coli. Nature. 2017;551:119–123. doi: 10.1038/nature24299. - DOI - PMC - PubMed
    1. Kohanim YK, et al. A bacterial growth law out of steady state. Cell Rep. 2018;23:2891–2900. doi: 10.1016/j.celrep.2018.05.007. - DOI - PubMed

Publication types

MeSH terms