. 2022 Aug 19;12(1):14126.
doi: 10.1038/s41598-022-18182-z.

Functional optimization of electric cell-substrate impedance sensing (ECIS) using human corneal epithelial cells

Affiliations

Functional optimization of electric cell-substrate impedance sensing (ECIS) using human corneal epithelial cells

Abdul Shukkur Ebrahim et al. Sci Rep. .

Abstract

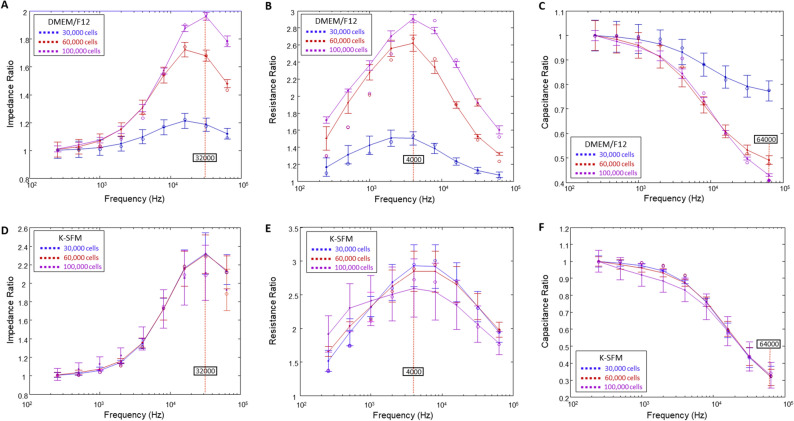
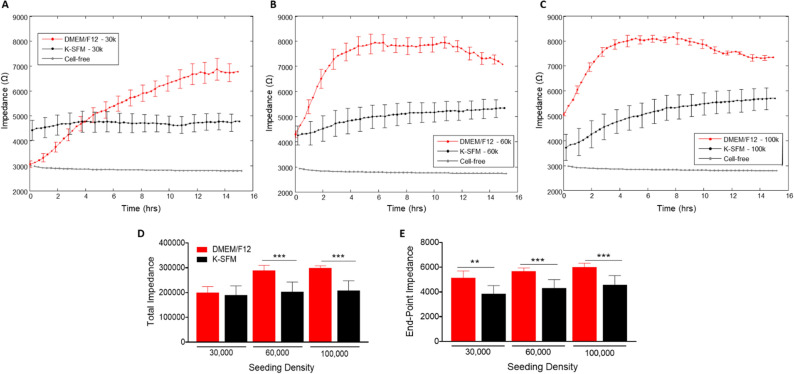
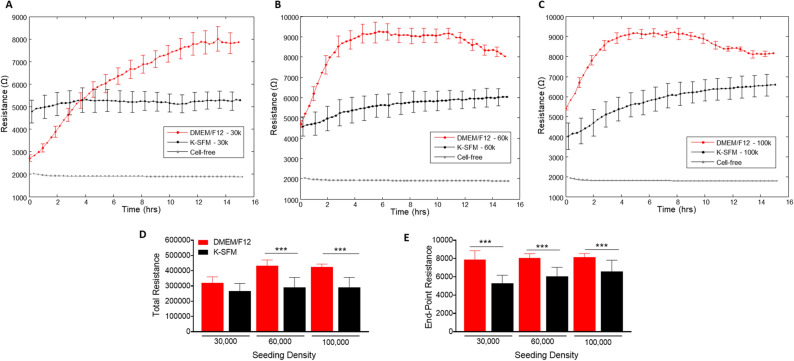
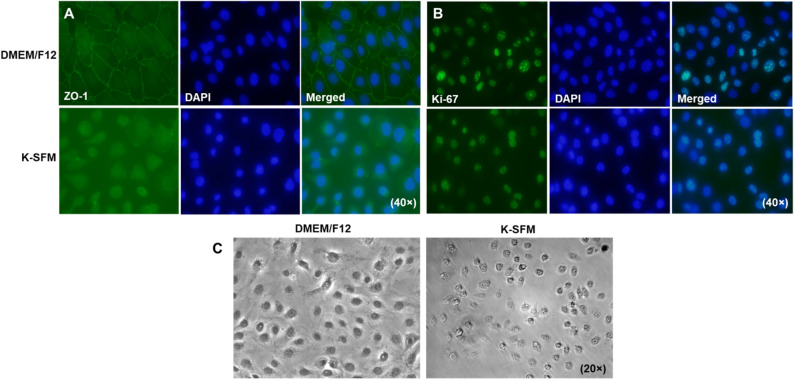
An intact epithelium is key to maintaining corneal integrity and barrier function which can lead to impaired ocular defense and sight-threatening opacity when compromised. Electrical cell-substrate impedance sensing or ECIS is a non-invasive method to measure real-time cellular behaviors including barrier function and cell migration. The current study uses ECIS technology to assess and optimize human telomerase-immortalized corneal epithelial cells to generate quantifiable measurements that accurately reflect changes in cell behavior in vitro. Five cell densities were assessed in two different media to determine the optimal conditions for monitoring of cellular behavior over time. Parameters of evaluation included: overall impedance (Z), barrier resistance (R), cell capacitance (C), and mathematical modeling of the R data to further generate Rb (the electrical resistance between HUCLs), α (the resistance between the HUCLs and the substrate), and Cm (the capacitance of the cell membrane) measurements. All parameters of assessment strongly indicated DMEM/F12 at 60,000 cells as the optimal condition for ECIS assessment of HUCLs. Furthermore, this work highlights the ability of the sensitive ECIS biosensor technology to comprehensively and quantitatively assess corneal epithelial cell structure and function and the importance of optimizing not only cell density, but choice of media used for in vitro culturing.


Conflict of interest statement

The authors declare no competing interests.

Figures

Figure 1
Figure 1
Barrier function of HUCLs monitored by real-time bio impedance analysis using an AC frequency scan. HUCLs were seeded on a 96W1E + ECIS array. Three-dimensional representations of the log of normalized impedance (y-axis) as a function of both log frequency of the alternating-current (AC) (y-axis) and time (z-axis). Cells grown in DMEM/F12 and K-SFM are shown for 30,000 (A,D), 60,000 (B,E) and 100,000 (C,F) cell seeding densities. Arrows indicate start of plateau and approximate time to confluency.
Figure 2
Figure 2
Determination of optimal AC frequencies using frequency dependence spectra. Data are presented as ratios of cell to cell-free measurements (y-axis) versus frequency (x-axis) measured at 15 h. Tracings are shown for impedance ratios with a maximum response at 32 kHz (A,D), resistance ratios with a maximum response at 4000 Hz (B,E), and capacitance ratios with a minimum response at 64 kHz (C,F) from HUCLs grown in DMEM/F12 (AC) and K-SFM (DF), respectively. Data shown are the mean ± SEM; n = 5/group.
Figure 3
Figure 3
Real-time monitoring of HUCL impedance in DMEM/F12 versus K-SFM media. Impedance of HUCLs versus time, measured at an AC frequency of 32 kHz for 30,000 (A), 60,000 (B) and 100,000 (C) seeding densities is shown. Bar graph representation of total impedance (D) and end-point impedance (E) comparing DMEM/F12 versus K-SFM. Data shown are the mean ± SEM; n = 5/group. **p ≤ 0.01 and ***p ≤ 0.001.
Figure 4
Figure 4
Real-time monitoring of HUCL resistance in DMEM/F12 versus K-SFM media. Resistance of HUCLs versus time, measured at an AC frequency of 4000 Hz for 30,000 (A), 60,000 (B) and 100,000 (C) cell seeding densities is shown. Bar graph representation of total resistance (D) and end-point resistance (E) comparing DMEM/F12 versus K-SFM. Time = 0 h denotes time of inoculation. Data shown are the mean ± SEM; n = 5/group. ***p ≤ 0.001.
Figure 5
Figure 5
Real-time monitoring of HUCL capacitance in DMEM/F12 versus K-SFM media. Capacitance of HUCLs versus time, measured at an AC frequency of 64 kHz is shown for 30,000 (A), 60,000 (B), and 100,000 (C) cell seeding density. Total capacitance (D) and end-point capacitance (E) comparing DMEM/F12 versus K-SFM are represented by bar graphs. Data shown are the mean ± SEM; n = 5/group. **p ≤ 0.01 and ***p ≤ 0.001.
Figure 6
Figure 6
Mathematical modeling of α, Rb, and Cm for HUCLs grown in DMEM/F12 versus K-SFM media. Modeled parameters, α (A), Rb (B), and Cm (C) were traced over 15 h for cells seeded at 60,000. Time = 0 denotes time of inoculation. Bar graphs represent total and end-point values from DMEM/F12 versus K-SFM media for α (D) and Rb (E); end-point only is shown for Cm (F). Data shown are the mean ± SEM; n = 5/group. *p ≤ 0.05, **p ≤ 0.01 and ***p ≤ 0.001.
Figure 7
Figure 7
Visual observations of HUCLs cultured in DMEM/F12 and K-SFM. Levels of ZO-1 (A) and Ki-67 (B) were assessed by immunofluorescence after 5 days of culturing in either DMEM/F12 or K-SFM media. ZO-1 and Ki-67 are shown in green with nuclei of cells counterstained with DAPI shown in blue. Images are shown at 40 × . Phase-contrast microscopy (C) images of HUCLs grown in both DMEM/F12 and K-SFM are shown at 20 × .
Figure 8
Figure 8
Wound healing response of HUCLs grown in DMEM/F12 versus K-SFM media. Normalized resistance of HUCLs versus time, measured at an AC frequency of 4000 Hz for 30,000, 60,000 and 100,000 cell seeding densities is shown for DMEM/F12 (A) and K-SFM (B). Bar graph representation of cell velocity of migrating cells (C,d) for both groups over time. Time = 0 h denotes time of wounding. Data shown are the mean ± SEM; n = 5/group. ***p ≤ 0.001; † p ≤ 0.01 between DMEM/F12 and K-SFM groups.

References

    1. Reiss B, Wegener J. Impedance analysis of different cell monolayers grown on gold-film electrodes. Annu. Int. Conf. IEEE Eng. Med. Biol. Soc. 2015;7079–7082:2015. doi: 10.1109/EMBC.2015.7320023. - DOI - PubMed
    1. Robilliard LD, et al. The importance of multifrequency impedance sensing of endothelial barrier formation using ECIS technology for the generation of a strong and durable paracellular barrier. Biosensors (Basel) 2018 doi: 10.3390/bios8030064. - DOI - PMC - PubMed
    1. Stolwijk JA, Matrougui K, Renken CW, Trebak M. Impedance analysis of GPCR-mediated changes in endothelial barrier function: Overview and fundamental considerations for stable and reproducible measurements. Pflugers Arch. 2015;467:2193–2218. doi: 10.1007/s00424-014-1674-0. - DOI - PMC - PubMed
    1. Cavet ME, et al. Effect of a novel multipurpose contact lens solution on human corneal epithelial barrier function. Cont. Lens Anterior Eye. 2010;33(Suppl 1):S18–23. doi: 10.1016/j.clae.2010.06.012. - DOI - PubMed
    1. Stepp MA, Menko AS. Immune responses to injury and their links to eye disease. Transl. Res. 2021;236:52–71. doi: 10.1016/j.trsl.2021.05.005. - DOI - PMC - PubMed

Publication types