. 2022 Aug 19;12(1):14150.
doi: 10.1038/s41598-022-18409-z.

Characterization of the unique oral microbiome of children with Down syndrome

Affiliations

Characterization of the unique oral microbiome of children with Down syndrome

Chieko Mitsuhata et al. Sci Rep. .

Abstract

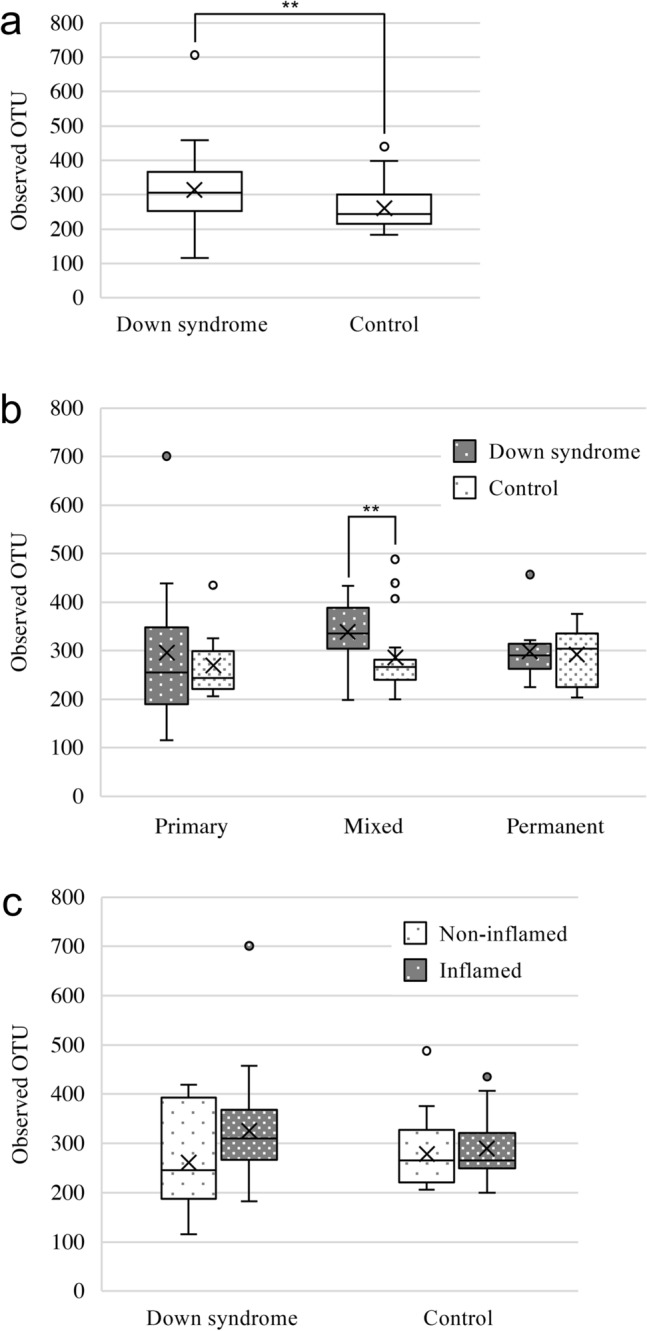
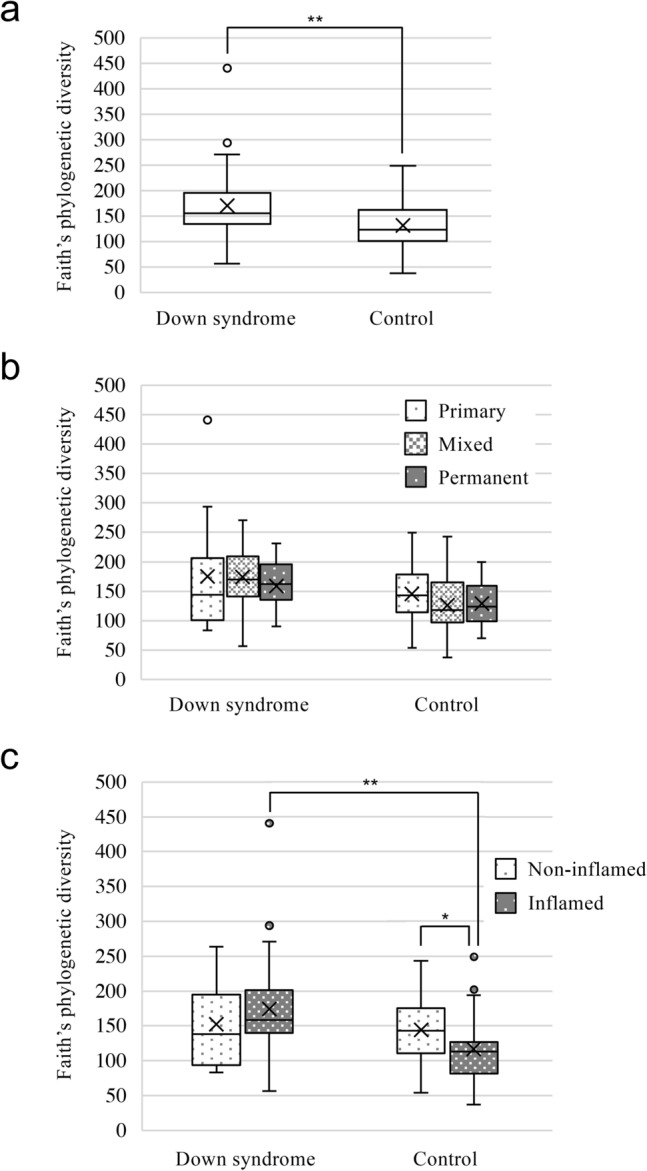
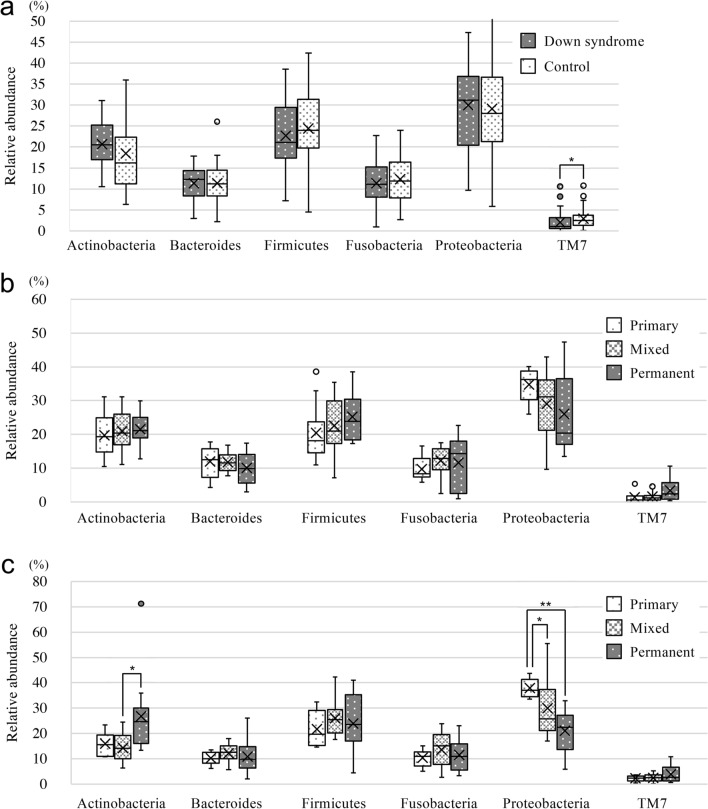
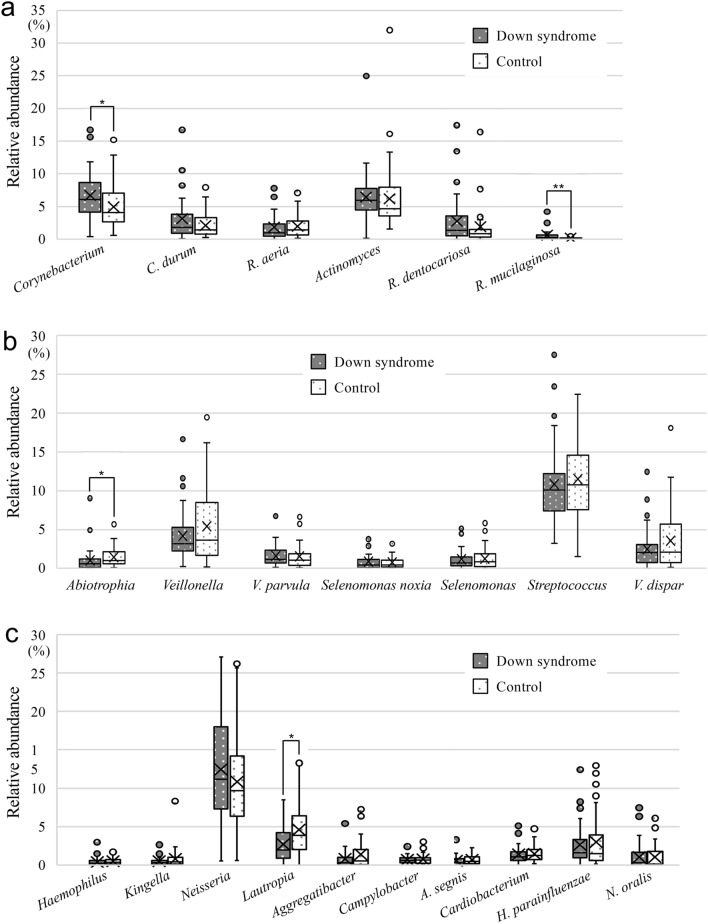
Down syndrome creates an abnormal oral environment, including susceptibility to periodontal disease at a young age, but there are no detailed studies of the oral microbiome in children with Down syndrome. In this study, we performed a comprehensive analysis of the oral bacteria of 40 children with Down syndrome and 40 non-Down syndrome children. Microbial DNA was extracted from dental plaque specimens and the V4 hypervariable region of the bacterial 16S rRNA gene was analyzed using the MiSeq platform. There were significant differences between the Down syndrome and non-Down syndrome groups in mean numbers of operational taxonomic units, and α- and β-diversity (P < 0.05). Interestingly, significant differences in α- and β-diversity between the two groups were only observed in subjects with gingival inflammation, but not in those without gingival inflammation (P < 0.05). Taxonomic analysis at the genus or species levels showed significant differences in relative abundance levels of certain bacteria between the Down syndrome and non-Down syndrome groups, including Corynebacterium, Abiotrophia and Lautropia (P < 0.05). These results suggest that children with Down syndrome may have a unique oral microbiome that could impact the development of dental diseases common in people with the syndrome.


Conflict of interest statement

The authors declare no competing interests.

Figures

Figure 1
Figure 1
Comparisons of the numbers of operational taxonomic units (OTUs) in dental plaque samples from the Down syndrome and the control groups. Comparisons between the two groups were made for (a) all participants, (b) dentition stage, and (c) gingival inflammation status. Whiskers indicate maximum and minimum values, boxes indicate the interquartile range, X indicates the mean value, and circles indicate outliers. **P < 0.01 by the Mann–Whitney U test and Kruskal–Wallis test (pairwise).
Figure 2
Figure 2
Faith’s phylogenetic diversity analysis of α-diversity in the Down syndrome and the control groups. Comparisons between the two groups were made for (a) all participants, (b) dentition stage, and (c) gingival inflammation status. Whiskers indicate maximum and minimum values, boxes indicate the interquartile range, X indicates the mean value, and circles indicate outliers. *P < 0.05 and **P < 0.01 by the Kruskal–Wallis test (pairwise).
Figure 3
Figure 3
PERMANOVA analysis of β-diversity in the Down syndrome (DS) and control (Cont) groups. Comparisons between the two groups were made for (a) all participants, (b) dentition stage (mixed, permanent and primary), and (c) gingival inflammation status. The contribution rate of each Axis (1–3) in the principal coordinate analysis is shown in parentheses. In this analysis, Axis 1 (3.03%) + Axis 2 (5.17%) + Axis 3 (2.55%) = 10.75%, which is considered to reflect approximately 10% of all of the information. *P < 0.05 and **P < 0.01 by PERMANOVA analysis of the unweighted UniFrac distance.
Figure 4
Figure 4
Taxonomic analysis at the phylum level in the Down syndrome and control groups. Comparisons between the two groups were made for (a) all participants, (b) Down syndrome group, and (c) control group. Whiskers indicate maximum and minimum values, boxes indicate the interquartile range, X indicates the mean value, and circles indicate outliers. *P < 0.05 and **P < 0.01 by the Mann–Whitney U test.
Figure 5
Figure 5
Taxonomic analysis at the genus or species level in the Down syndrome and the control groups. Taxonomic analysis of (a) Actinobacteria, (b) Firmicutes, and (c) Proteobacteria in the two groups. Whiskers indicate maximum and minimum values, boxes indicate the interquartile range, X indicates the mean value, and circles indicate outliers. *P < 0.05 and **P < 0.01 by the Mann–Whitney U test.

References

    1. Desai SS. Down syndrome: A review of the literature. Oral Surg. Oral Med. Oral Pathol. Oral Radiol. Endod. 1997;84:279–285. doi: 10.1016/s1079-2104(97)90343-7. - DOI - PubMed
    1. Zamanian Azodi M, Rezaei Tavirani M, Rezaei Tavirani M, Rostami Nejad M. Bioinformatics investigation and contribution of other chromosomes besides chromosome 21 in the risk of Down syndrome development. Basic Clin. Neurosci. 2021;12:79–88. doi: 10.32598/bcn.12.1.941.6. - DOI - PMC - PubMed
    1. Barnett ML, Press KP, Friedman D, Sonnenberg EM. The prevalence of periodontitis and dental caries in a Down’s syndrome population. J. Periodontol. 1986;57:288–293. doi: 10.1902/jop.1986.57.5.288. - DOI - PubMed
    1. Reuland-Bosma W, van Dijk J. Periodontal disease in Down’s syndrome: A review. J. Clin. Periodontol. 1986;13:64–73. doi: 10.1111/j.1600-051x.1986.tb01416.x. - DOI - PubMed
    1. Cohen MM, Winer RA, Schwartz S, Shklar G. Oral aspects of mongolism. I. Periodontal disease in mongolism. Oral Surg. Oral Med. Oral Pathol. 1961;14:92–107. doi: 10.1016/0030-4220(61)90478-9. - DOI - PubMed

Publication types

Substances