. 2022 Aug 19;12(1):14124.
doi: 10.1038/s41598-022-18558-1.

Cross-platform validation of a mouse blood gene signature for quantitative reconstruction of radiation dose

Affiliations

Cross-platform validation of a mouse blood gene signature for quantitative reconstruction of radiation dose

Shanaz A Ghandhi et al. Sci Rep. .

Abstract

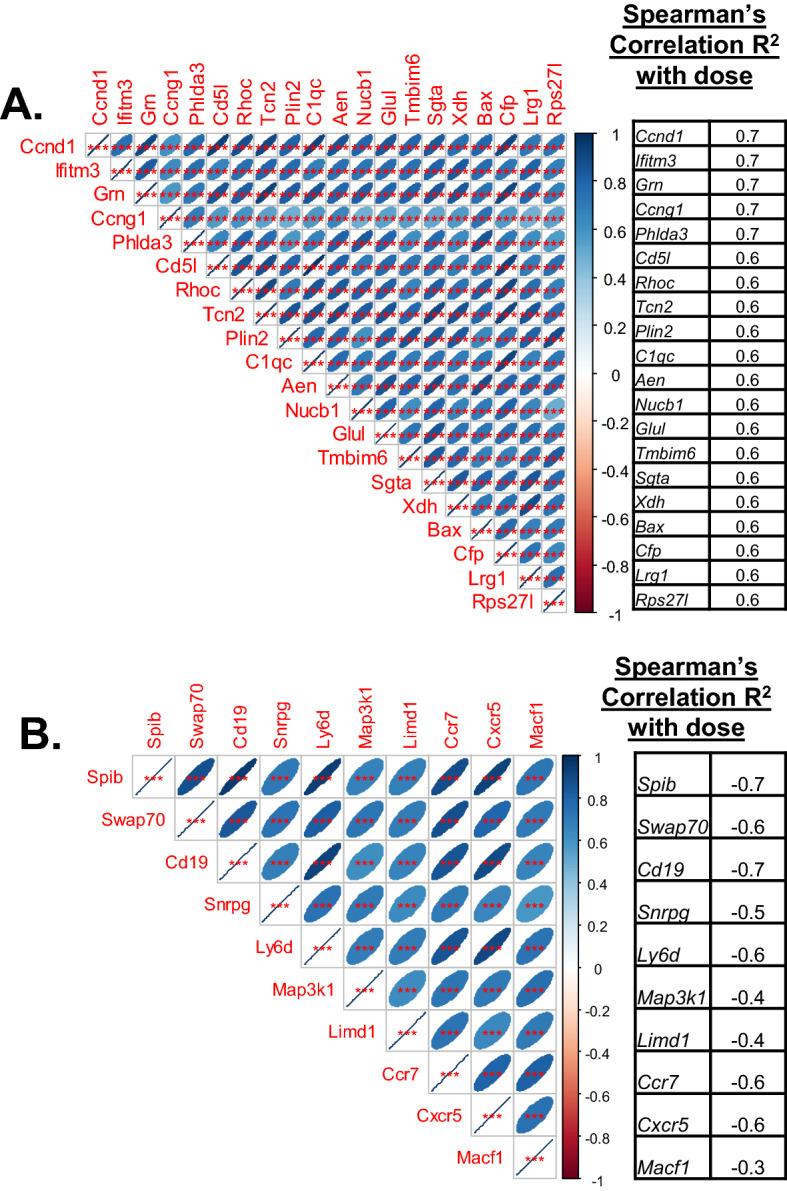
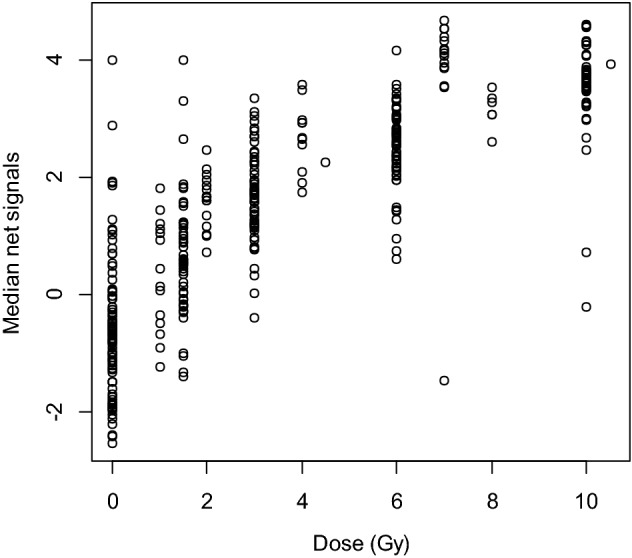
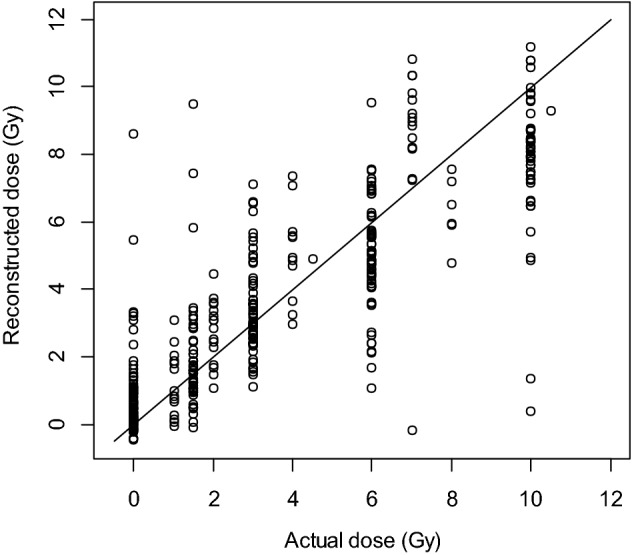
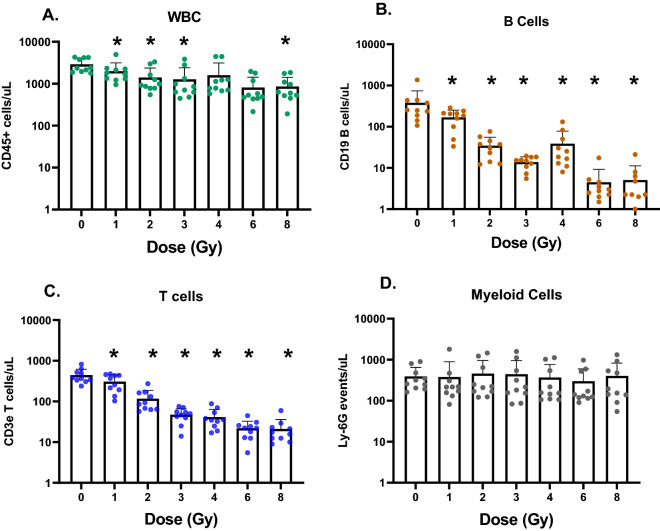
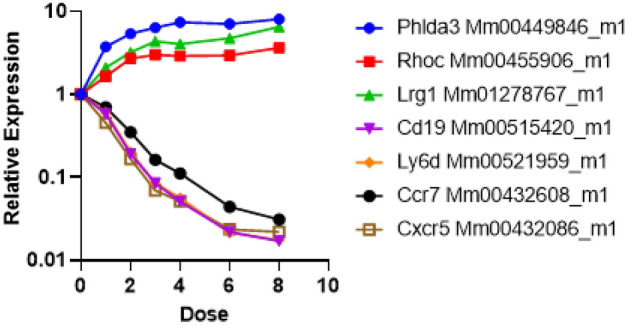
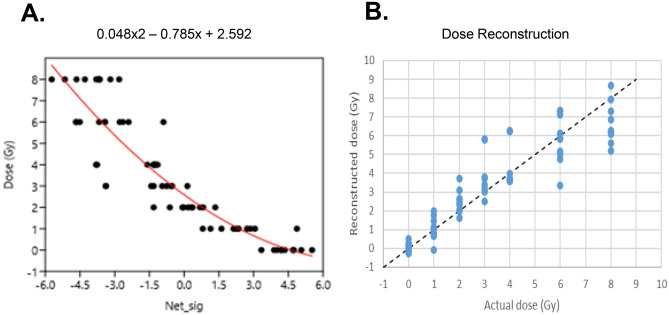
In the search for biological markers after a large-scale exposure of the human population to radiation, gene expression is a sensitive endpoint easily translatable to in-field high throughput applications. Primarily, the ex-vivo irradiated healthy human blood model has been used to generate available gene expression datasets. This model has limitations i.e., lack of signaling from other irradiated tissues and deterioration of blood cells cultures over time. In vivo models are needed; therefore, we present our novel approach to define a gene signature in mouse blood cells that quantitatively correlates with radiation dose (at 1 Gy/min). Starting with available microarray datasets, we selected 30 radiation-responsive genes and performed cross-validation/training-testing data splits to downselect 16 radiation-responsive genes. We then tested these genes in an independent cohort of irradiated adult C57BL/6 mice (50:50 both sexes) and measured mRNA by quantitative RT-PCR in whole blood at 24 h. Dose reconstruction using net signal (difference between geometric means of top 3 positively correlated and top 4 negatively correlated genes with dose), was highly improved over the microarrays, with a root mean square error of ± 1.1 Gy in male and female mice combined. There were no significant sex-specific differences in mRNA or cell counts after irradiation.


Conflict of interest statement

The authors declare no competing interests.

Figures

Figure 1
Figure 1
Correlation matrices of genes from the microarray meta-analysis that correlate with dose. (A) Genes that are positively correlated with dose, and (B) Genes that are negatively correlated with dose. Shown here in the matrix are pairwise correlations with each other. The size of the oval blue area indicates the correlation level, a broad oval indicates lower correlation, and the narrower oval indicates higher correlation (as indicated in the color gradient key). The table on the side shows the genes as listed and the correlation R2 values with dose from the microarray analyses (ranging from 0.6 to 0.7 for positive correlation and − 0.3 to − 0.7 for negative correlation). All genes in each group are highly correlated with each other indicating that the patterns are highly similar in both the up and down regulated gene groups.
Figure 2
Figure 2
Normalized N (Net Signal) versus Dose (Gy) plots for all 30 genes included in the microarray signature. Net signal (N) is the difference between the median of the DCt of up regulated genes and down regulated genes. This value is a better indicator of dose response than either group alone, or any one gene alone, and was used for developing the model.
Figure 3
Figure 3
Dose reconstruction based on mouse microarray data analyzed using a nonlinear model Eq. (1). The model was based on the net gene signal (difference between median signals of the gene groups with positive and negative correlations with radiation dose), and time (days) after irradiation. The best-fit parameter values for this dose reconstruction model were: k1 = 0.906 (standard error SE = 0.086, p value =  < 2 × 10–16) Gy−1, k2 = 0.274 (SE = 0.028, p value =  < 2 × 10–16) Gy−2, k3 = 0.549 (SE = 0.069, p value = 1.5 × 10–14) days−1/2.
Figure 4
Figure 4
Blood cell counts from flow cytometry analysis in an independent mouse cohort. (A) Leucocytes (CD45 + cells)/µL of blood, (B) B cells (CD19 +)/µL of blood, (C) T cells (CD3e +)/µL of blood; and (D) Myeloid cells/µL of blood are plotted with dose as the independent variable. All doses of irradiation produce a significant change of T and B cell numbers compared to control levels; however, B cells are more sensitive. 5 males and 5 females were used for this analysis and data is combined, as there were no differences by sex. (p values are indicated in the figure as *p < 0.05).
Figure 5
Figure 5
Quantitative RT-PCR results in an independent mouse cohort. Responses of male (n = 5) and female mice (n = 5) are plotted individually as a function of radiation dose for the 7-gene set measured by 2−ΔΔCt method. The response of these 7 genes was the same in both sexes and is plotted separately for male and female mice in Supplementary Figure 2.
Figure 6
Figure 6
Dose reconstruction in the independent mouse cohort using qRT-PCR. (A) Plot of the best-fitting regression equation (B) plot of reconstructed dose versus actual dose, which was used to determine RMSE.

References

    1. Bushberg JT, et al. Nuclear/radiological terrorism: emergency department management of radiation casualties. J. Emerg. Med. 2007;32:71–85. doi: 10.1016/j.jemermed.2006.05.034. - DOI - PubMed
    1. Flood AB, et al. Advances in a framework to compare bio-dosimetry methods for triage in large-scale radiation events. Radiat. Prot. Dosimetry. 2014;159:77–86. doi: 10.1093/rpd/ncu120. - DOI - PMC - PubMed
    1. Flood AB, et al. A framework for comparative evaluation of dosimetric methods to triage a large population following a radiological event. Radiat. Meas. 2011;46:916–922. doi: 10.1016/j.radmeas.2011.02.019. - DOI - PMC - PubMed
    1. Sullivan JM, et al. Assessment of biodosimetry methods for a mass-casualty radiological incident: medical response and management considerations. Health Phys. 2013;105:540–554. doi: 10.1097/HP.0b013e31829cf221. - DOI - PMC - PubMed
    1. Grace MB, et al. Rapid radiation dose assessment for radiological public health emergencies: roles of NIAID and BARDA. Health Phys. 2010;98:172–178. doi: 10.1097/01.HP.0000348001.60905.c0. - DOI - PubMed

Publication types