. 2022 Aug 19;21(1):166.
doi: 10.1186/s12943-022-01635-4.

Longitudinal single-cell transcriptomics reveals distinct patterns of recurrence in acute myeloid leukemia

Affiliations

Longitudinal single-cell transcriptomics reveals distinct patterns of recurrence in acute myeloid leukemia

Yanan Zhai et al. Mol Cancer. .

Abstract

Background: Acute myeloid leukemia (AML) is a heterogeneous and aggressive blood cancer that results from diverse genetic aberrations in the hematopoietic stem or progenitor cells (HSPCs) leading to the expansion of blasts in the hematopoietic system. The heterogeneity and evolution of cancer blasts can render therapeutic interventions ineffective in a yet poorly understood patient-specific manner. In this study, we investigated the clonal heterogeneity of diagnosis (Dx) and relapse (Re) pairs at genetic and transcriptional levels, and unveiled the underlying pathways and genes contributing to recurrence.

Methods: Whole-exome sequencing was used to detect somatic mutations and large copy number variations (CNVs). Single cell RNA-seq was performed to investigate the clonal heterogeneity between Dx-Re pairs and amongst patients.

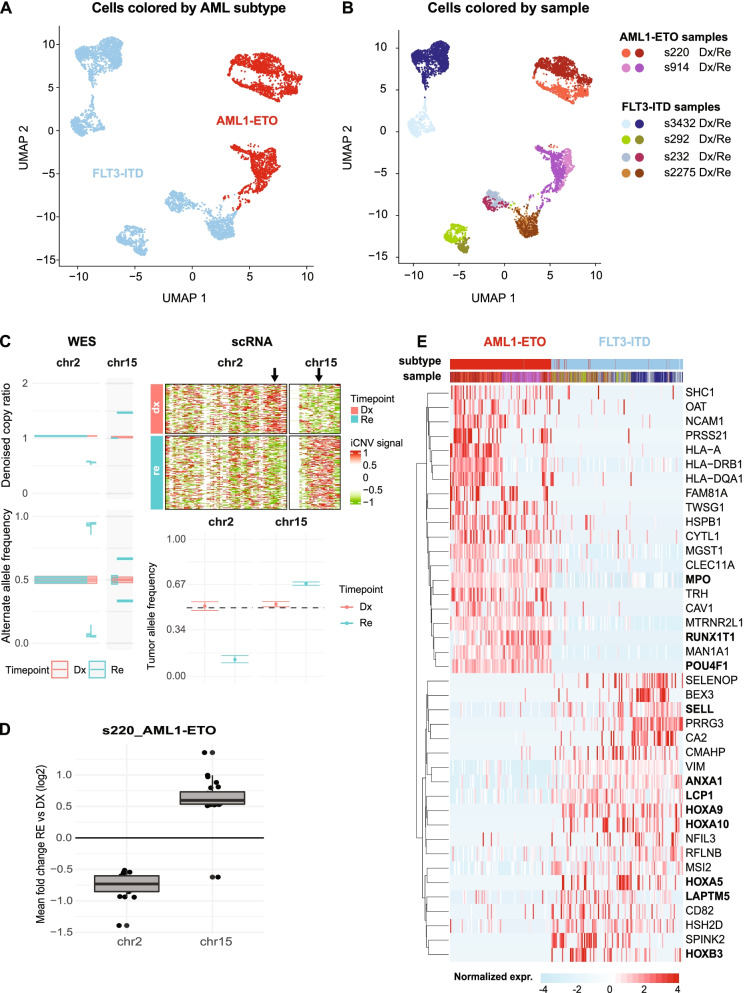
Results: scRNA-seq analysis revealed extensive expression differences between patients and Dx-Re pairs, even for those with the same -presumed- initiating events. Transcriptional differences between and within patients are associated with clonal composition and evolution, with the most striking differences in patients that gained large-scale copy number variations at relapse. These differences appear to have significant molecular implications, exemplified by a DNMT3A/FLT3-ITD patient where the leukemia switched from an AP-1 regulated clone at Dx to a mTOR signaling driven clone at Re. The two distinct AML1-ETO pairs share genes related to hematopoietic stem cell maintenance and cell migration suggesting that the Re leukemic stem cell-like (LSC-like) cells evolved from the Dx cells.

Conclusions: In summary, the single cell RNA data underpinned the tumor heterogeneity not only amongst patient blasts with similar initiating mutations but also between each Dx-Re pair. Our results suggest alternatively and currently unappreciated and unexplored mechanisms leading to therapeutic resistance and AML recurrence.

Keywords: Acute myeloid Leukemia; Genome analysis; Leukemic stem cells; Recurrence; Single-cell RNA sequencing.


Conflict of interest statement

The authors declare no competing interests.

Figures

Fig. 1
Fig. 1
Whole exome- and gene fusion analysis between Dx and Re. (A) Oncoplot from WES showing 14 selected somatic mutations across 6 patients (red: n = 2 AML1-ETO; blue: n = 4 FLT3-ITD). We termed patient s232, s292, s2275 and s3432 as “FLT3-ITD”, although it is not an AML initiating lesion, nor an acknowledged WHO2016 AML category, but treatment with the FLT3 inhibitor Midostaurin is distinct from the AML1-ETO patients. Mutations with at least 5 reads on the ALT allele and VAF ≥ 0.05 are depicted as squares and the ones below this threshold are indicated as triangle. Vertical bars depict the number of mutations detected per sample; horizontal bars depict the (relative) frequency of a particular mutation. (B) Gene fusions detected from bulk RNA-seq. (C) Mutations with a VAF ≥ 0.2 at Dx or Re for which the VAF changed significantly. For all bars, p < 0.05, Fisher’s exact test with Benjamini–Hochberg correction. Red: mutations more abundant at Dx. Blue: mutations more abundant at Re
Fig. 2
Fig. 2
Single cell transcriptomics reveals distinct AML-phenotypes. (A) UMAP of the six AML pairs, colored by primary mutation (red: AML1-ETO; blue: FLT3-ITD); (B) UMAP colored by sample; (C) Copy number variation data derived from WES (left) and scRNA-seq (right) data for patient s220. Left: Relapse-specific copy number gain and loss at chr2 and chr15, respectively. Right: cell normalized gene expression signals (iCNV signal) in tiles of 3 Mb show the copy loss and gain at chr2 and chr15, respectively. The plot indicates that virtually all Re cells are affected, compared to none of the Dx cells. Bottom: tumor allele frequency at heterozygous SNPs confirms copy loss at chr2 and gain at chr15. (D) Boxplot of DEGs at the lost and gained segments of chr2 (n = 17 DEGs) and chr15 (n = 24 DEGs), respectively. (E) Heatmap showing the top 20 marker genes per primary mutation
Fig. 3
Fig. 3
Single cell transcriptomics reveals heterogeneity amongst patients. (A) UMAP of the four sample pairs with a FLT3-ITD, colored by sample (red: Dx; blue: Re); (B) UMAP of the two AML1-ETO sample pairs, colored by sample; (C) Heatmap displaying the top 5 marker genes per sample (FLT3-ITD); (D) Heatmap displaying the top 10 marker genes per sample
Fig. 4
Fig. 4
Pathway switch between AP-1 and RAS signaling in high risk FLT3-ITD (s3432). (A) UMAP of Dx and Re cells for FLT3-ITD patient s3432 colored by timepoint (top) or cell cluster (bottom). (B) Heatmap displaying the top 10 cluster marker genes. Color represents row normalized expression values. (C) Overrepresented GO terms (category: biological pathway) in cluster 1 (Dx) and 3 (Re). P-values: hypergeometric test (BH-corrected). (D) The expression of genes related to AP-1 transcription factor network and RAS signaling pathway in each timepoint. (E) Calculation of LSC17 score for each cluster, and p-value was calculated using Student’s t-test. * p < 0.05, ** p < 0.01, *** p < 0.001
Fig. 5
Fig. 5
Putative LSCs detected in AML1-ETO pair (s914). (A) UMAP of Dx and Re cells for AML1-ETO patient s914, colored by timepoint (top) and cell cluster (bottom). Cells in cluster 6 express ambiguous marker genes, and may be doublets or contaminated by ambient RNA and were discarded (see also Supplemental Fig. 6). (B) Heatmap depicting the top 7 cluster markers. Color represents row normalized expression values. (C) Pseudo-time trajectory colored by timepoint (top) or cell cluster (bottom). (D) Heatmap showing representative genes per cluster. (E) LSC17 score per cluster. * p < 0.05, ** p < 0.01, *** p < 0.001, Student’s t-test. (F) Barplots depicting the relative cell abundance per cell cycle phase (inferred from marker gene expression) for each cell cluster. Arrow: cells in cluster 2 and 3 predominantly reside in the G1 phase
Fig. 6
Fig. 6
Putative LSCs detected in AML1-ETO pair (s220). (A) UMAP of Dx and Re cells for AML1-ETO patient s220, colored by timepoint (top) and cell cluster (bottom). (B) Heatmap depicting the top 5 marker genes per cluster. Color represents row normalized expression values. (C) LSC17 scores per cluster. * p < 0.05, ** p < 0.01, *** p < 0.001, Student’s t-test. (D) top: Barplots depicting the relative cell abundance per cell cycle phase (inferred from marker gene expression) for each cell cluster. Arrow: cells in cluster 4 and 5 predominantly reside in the G1 phase. Bottom: UMAP colored by cell cycle phase. (E) Pseudo-time trajectory colored by cell cluster (F) Heatmap depicting representative marker genes per cluster/inferred timepoint

References

    1. Horton SJ, Huntly BJP. Recent advances in acute myeloid leukemia stem cell biology. Haematol |. 2012;97(7). doi:10.3324/haematol.2011.054734 - PMC - PubMed
    1. The Cancer Genome Atlas Research Genomic and Epigenomic Landscapes of Adult De Novo Acute Myeloid Leukemia. N Engl J Med. 2013;368(22):2059–2074. doi: 10.1056/nejmoa1301689. - DOI - PMC - PubMed
    1. Papaemmanuil E, Gerstung M, Bullinger L, et al. Genomic Classification and Prognosis in Acute Myeloid Leukemia. N Engl J Med. 2016;374(23):2209–2221. doi: 10.1056/nejmoa1516192. - DOI - PMC - PubMed
    1. Ferrara F, Schiffer CA. Acute myeloid leukaemia in adults. In: The Lancet. Vol 381. Lancet; 2013:484–495. doi:10.1016/S0140-6736(12)61727-9 - PubMed
    1. Bertoli S, Tavitian S, Huynh A, et al. Improved outcome for AML patients over the years 2000–2014. Blood Cancer J. 2017;7(12). doi:10.1038/s41408-017-0011-1 - PMC - PubMed

Publication types

Substances