. 2022 Aug 19;19(1):18.
doi: 10.1186/s12977-022-00605-4.

Opposing roles of CLK SR kinases in controlling HIV-1 gene expression and latency

Affiliations

Opposing roles of CLK SR kinases in controlling HIV-1 gene expression and latency

Subha Dahal et al. Retrovirology. .

Abstract

Background: The generation of over 69 spliced HIV-1 mRNAs from one primary transcript by alternative RNA splicing emphasizes the central role that RNA processing plays in HIV-1 replication. Control is mediated in part through the action of host SR proteins whose activity is regulated by multiple SR kinases (CLK1-4, SRPKs).

Methods: Both shRNA depletion and small molecule inhibitors of host SR kinases were used in T cell lines and primary cells to evaluate the role of these factors in the regulation of HIV-1 gene expression. Effects on virus expression were assessed using western blotting, RT-qPCR, and immunofluorescence.

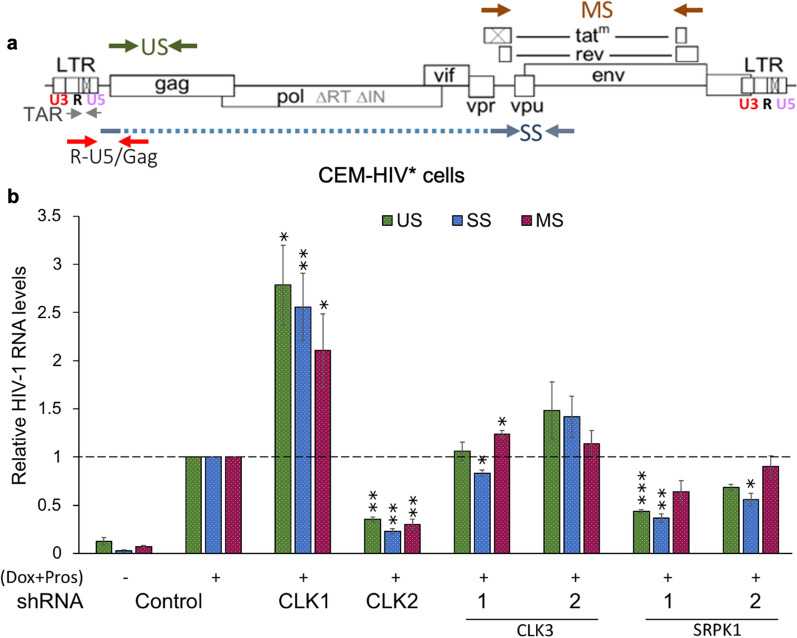
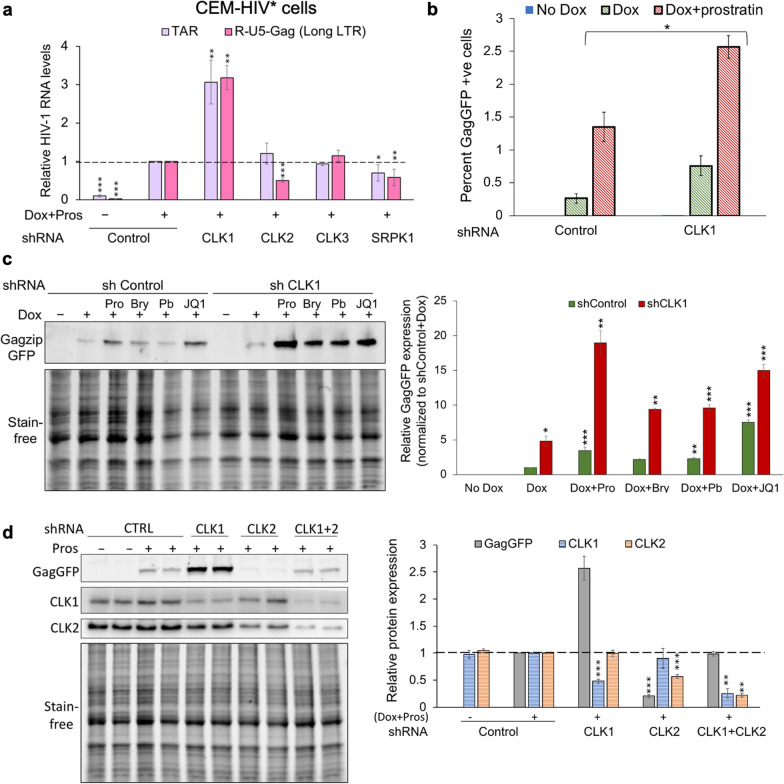
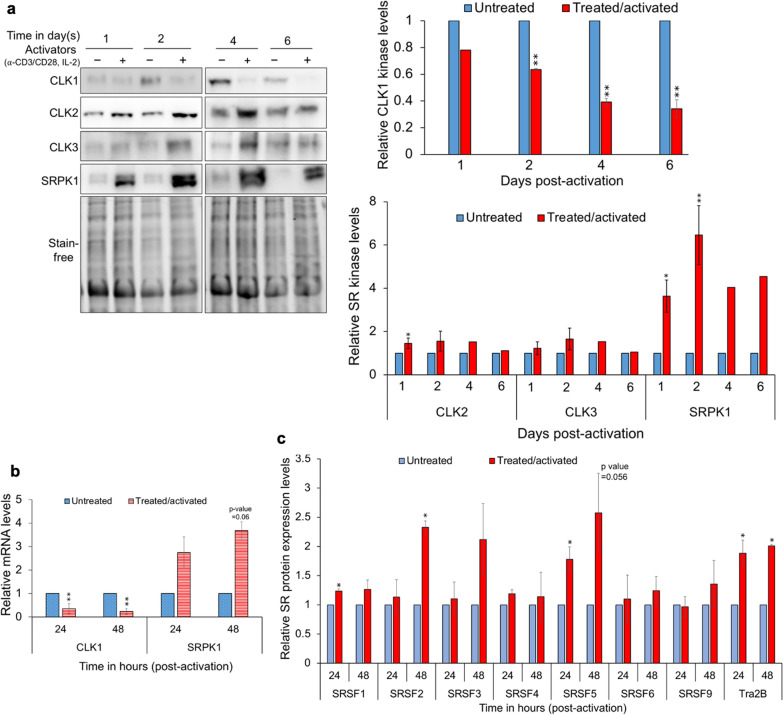
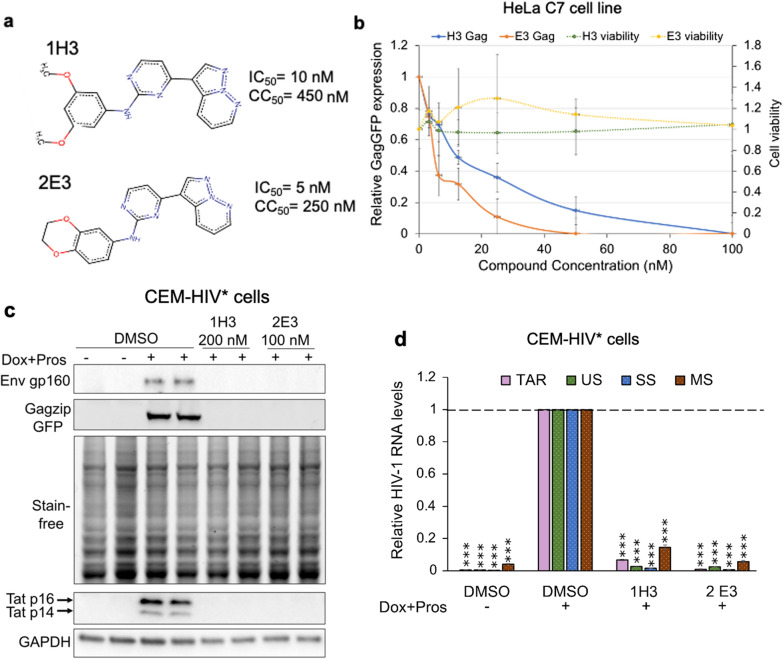
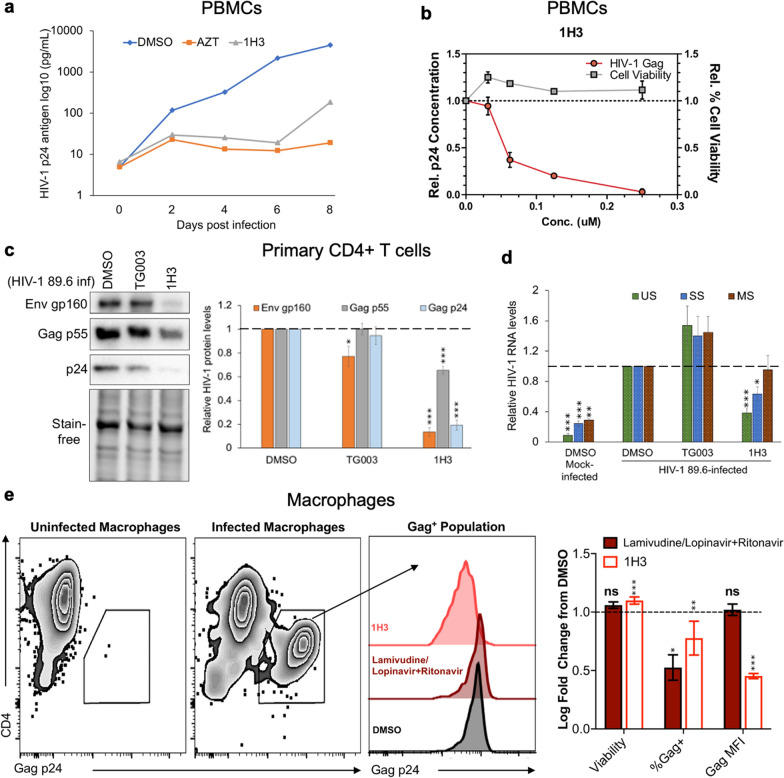
Results: The studies demonstrate that SR kinases play distinct roles; depletion of CLK1 enhanced HIV-1 gene expression, reduction of CLK2 or SRPK1 suppressed it, whereas CLK3 depletion had a modest impact. The opposing effects of CLK1 vs. CLK2 depletion were due to action at distinct steps; reduction of CLK1 increased HIV-1 promoter activity while depletion of CLK2 affected steps after transcript initiation. Reduced CLK1 expression also enhanced the response to several latency reversing agents, in part, by increasing the frequency of responding cells, consistent with a role in regulating provirus latency. To determine whether small molecule modulation of SR kinase function could be used to control HIV-1 replication, we screened a GSK library of protein kinase inhibitors (PKIS) and identified several pyrazolo[1,5-b] pyridazine derivatives that suppress HIV-1 gene expression/replication with an EC50 ~ 50 nM. The compounds suppressed HIV-1 protein and viral RNA accumulation with minimal impact on cell viability, inhibiting CLK1 and CLK2 but not CLK3 function, thereby selectively altering the abundance of individual CLK and SR proteins in cells.

Conclusions: These findings demonstrate the unique roles played by individual SR kinases in regulating HIV-1 gene expression, validating the targeting of these functions to either enhance latency reversal, essential for "Kick-and-Kill" strategies, or to silence HIV protein expression for "Block-and-Lock" strategies.

Keywords: HIV-1; Latency; RNA processing; SR kinases.

Plain language summary

Identifying cellular factors that regulate HIV-1 RNA processing provides important insights into novel strategies to control this infection. Different members of the SR kinase family have distinct roles in regulating virus expression because they affect distinct steps of transcription/RNA processing. We identify inhibitors of these kinases that suppress HIV-1 gene expression and replication in multiple assay systems at nanomolar concentrations with limited or no cytotoxicity. Our results highlight the therapeutic potential of targeting the post-integration stage of the HIV-1 lifecycle to selectively enhance or reverse provirus latency. A greater understanding of the molecular mechanisms underlying the effects observed will facilitate the development of more targeted approaches to modulate HIV-1 latency on the path toward a “functional” cure for this infection.


Conflict of interest statement

The authors have no competing interests as defined by BMC, or other interests that might be perceived to influence the results and/or discussion reported in this paper.

Figures

Fig. 1
Fig. 1
Depletion of SR kinases has differential effects on HIV-1 protein levels. a Schematic of HIV-1 rtTAGagzipGFP provirus used to generate CEM-HIV* cell line. b, c CEM-HIV* cells were infected with shRNA lentivirus targeting CLK1, CLK2, CLK3, or SRPK1 and transduced cells were selected with puromycin for 72 h. Following puromycin selection, HIV-1 gene expression was induced with doxycycline (Dox, 4.5 µM) + prostratin (Pros,2.56 µM) and cells harvested for western blots after 24 h of induction. Shown are the representative western blots indicating expression levels of b the target kinase, c or HIV-1 Env, Gag, and Tat levels. Band intensity was quantified relative to Dox induced shRNA control and normalized to either total protein stain for Env and Gag blots or GAPDH for Tat blots using Bio-Rad ImageLab software. Data are indicated as mean ± SEM, n ≥ 4 independent experiments, *p ≤ 0.05, **p ≤ 0.01, and ***p ≤ 0.001. Dotted vertical lines on the blots represent cropping of lanes on the same representative blot to show shcontrol lanes adjacent to shRNA target depletion lanes
Fig. 2
Fig. 2
Effect of SR kinase depletion on HIV-1 RNA accumulation. a Schematic of HIV-1 provirus indicating the position of primers used to detect viral RNAs. b CEM-HIV* cells were depleted of CLK1, CLK2, CLK3, or SRPK1 by transduction with lentiviruses expressing shRNAs to these SR kinases. Following selection of transduced cells with puromycin for 72 h, HIV-1 gene expression was induced by addition of Dox (4.5 µM) + prostratin (2.56 µM). Cells were harvested for RNA extraction after 24 h of induction. HIV-1 unspliced (US), singly spliced (SS), multiply spliced (MS) RNA levels were determined by RT-qPCR. Viral mRNA levels were normalized to ß-actin and the mean mRNA levels expressed relative to sh control. Data are indicated as mean ± SEM, n = 3 independent experiments, *p ≤ 0.05, **p ≤ 0.01, and ***p ≤ 0.001
Fig. 3
Fig. 3
CLK1 but not CLK2/3 depletion alters HIV-1 transcription initiation and enhances response to LRAs. a Quantification of TAR and R-U5-Gag RNA levels in CEM-HIV* cells depleted of individual CLK1, 2, 3, or SRPK1 by shRNA lentivirus. Relative quantification was performed using comparative cycle threshold (CT) values. PUM1 was used as a reference gene to normalize the CT value and the fold changes calculated using 2−ΔΔCT method. b CEM-HIV* cells were depleted of CLK1 by transduction with shRNA lentivirus and transduced cells selected with puromycin for 72 h. Cells were induced by addition of Dox only or both Dox + prostratin. Following induction of provirus expression, cells were fixed and the frequency of GagzipGFP positive cells determined by flow cytometry. c CLK1 depletion enhances the ability of different LRAs to promote HIV-1 protein expression. CEM-HIV* cells were depleted of CLK1 by transduction with lentiviruses expressing shRNA. Following selection of transduced cells with puromycin for 72 h, HIV-1 gene expression was induced by addition of Dox (4.5 µM) alone, or with Dox and an LRA-prostratin (Pro, 2.56 µM), bryostratin (Bry, 25 nM), panobinostat (Pb, 40 nM), or JQ1 (2 µM). Following induction for 24 h, cells were harvested, and cell lysates analyzed for effects on GagzipGFP expression. d Effect of CLK1/2 single and double depletions on GagzipGFP expression in CEM-HIV* cells. Infection with shRNA viruses, selection and provirus induction are as previously detailed. Representative western blots are shown on the left and a graphical summary of n > 3 assays on the right. Data are indicated as mean ± SEM, *p ≤ 0.05, **p ≤ 0.01, and ***p ≤ 0.001
Fig. 4
Fig. 4
Activation of primary CD4+ T cells selectively alters SR kinase and SR protein levels. Primary CD4+ T cells were isolated from healthy (HIV uninfected) human donors and untreated (control) or treated with activators (anti-CD3/CD28 and IL-2). Cells were harvested at different times (24 h, 48 h, 4 d, and 6 d) with or without activation for analyses by western blots or RT-qPCR to look for changes in the expression of SR kinases and SR proteins. a Top and bottom panels on the left are the representative western blots probed for CLK1, CLK2, CLK3, and SRPK1. Top and bottom panels on the right are the quantitation of blots for at least 3 donors (except for 4 d and 6 d post-activation for CLK2, CLK3, and SRPK1 expression levels where only one donor was used). b Quantification of CLK1 and SRPK1 mRNA levels in CD4+ T cells of 3 donors by RT-qPCR assay. mRNA levels were normalized to ß2-microglobulin and mean mRNA levels were expressed relative to untreated control. c Quantitation of western blots for SR protein expression levels in untreated versus treated/activated CD4+ T cell lysates (see Additional file 1: Fig. S4 for representative western blots) across at least 3 donors. For western blots, band intensity was quantified relative to untreated control and normalized to total protein load using Bio-Rad ImageLab software. Data are indicated as mean ± SD, n = 3 or 4 independent experiments, *p ≤ 0.05 and **p ≤ 0.01
Fig. 5
Fig. 5
Identification of inhibitors of HIV-1 Gag expression from the GSK PKIS library. a Structures of 1H3 and 2E3. Indicated are the EC50 and CC50 values of the compounds as determined from assays using HeLa C7 cells; b HeLa C7 cells were incubated with compounds at increasing compound concentration and HIV-1 gene expression induced with Dox (4.5 µM) for 24 h. 1% DMSO treated cells grown with or without Dox served as positive and negative controls, respectively. Dose response on HIV-1 gene expression was measured relative to intracellular GagGFP levels in DMSO & Dox-treated samples. Effects of compounds on cell viability were assessed using alamarBlue assay across n > 3 independent assays. c, d CEM-HIV* cells were treated with compounds 1H3 (200 nM) or 2E3 (100 nM) and HIV-1 gene expression induced with Dox and prostratin. 1% DMSO treated cells grown with or without Dox and prostratin served as positive and negative controls, respectively. Cells were harvested for HIV-1 protein and RNA analyses after 24 h of induction. c Shown are representative western blots showing the effect of compounds on HIV-1 Gag, Env, and Tat levels. d Quantification of viral TAR, US, SS, and MS RNA levels in cells treated with compounds relative to induced DMSO control. The positions of the primers in the proviral construct are shown in Fig. 2A. Viral mRNA levels were normalized to PUM1 for TAR RNA and ß-actin for US, SS, and MS RNA. Mean mRNA levels were expressed relative to Dox and Prostratin induced DMSO control. Data are indicated as mean ± SEM, n = 4 independent experiments, *p ≤ 0.05, **p ≤ 0.01, and ***p ≤ 0.001
Fig. 6
Fig. 6
Compound 1H3 inhibits HIV-1 replication in PBMCs, CD4+ T cells, and macrophages. a HIV-1 BaL replication in PBMCs over a period of 8 days post infection as measured by p24 antigen ELISA. PBMCs from healthy human donor were infected with HIV-1 BaL (MOI < 0.01) and treated on day 0 and day 4 post infection with DMSO, AZT (3.74 µM), or 1H3 (0.25 µM). b The effect of increasing concentration of 1H3 on HIV-1 BaL virion production in PBMCs. Indicated doses of the compounds were added following infection, media harvested after 6 days, and virus replication measured by p24 ELISA. Values are expressed relative to p24 levels in DMSO-treated cultures at day 6. The effect of the compounds on cell viability was measured by trypan blue exclusion assays using Glasstic slides (Kova). n = 3. c, d CD4+ T cells from healthy human donors were infected with HIV-1 89.6 then treated immediately with DMSO, 10 µM TG003, or 300 nM 1H3 for 3 days. Cells were harvested and the effect of individual treatments on HIV-1 c protein or d RNA accumulation assessed by western blot and RT-qPCR, respectively. Shown are results from 6 independent experiments with 8–10 donors. e Effect of 1H3 on HIV-1 replication in human macrophages. Monocyte-derived macrophages from healthy donors were infected for 2 days with HIV-1 89.6, then treated with DMSO, a combined antiretroviral drug Lamivudine/Lopinavir + Ritonavir (1.5 µM/53 nM) or 1H3 (300 nM). After 10 days, cells were fixed, stained to detect intracellular levels of Gag and analyzed by flow cytometry to assess changes in %Gag positive cells and Gag mean fluorescence intensity (MFI). Shown on the left are representative flow cytometry plots of uninfected and infected macrophages and histograms showing shifts in the Gag Mean fluorescence Intensity (MFI) with treatment. On the right, summary data shown are expressed relative to DMSO treated samples (n = 8 from 5 independent experiments). Statistical analysis, one sample t test, ns = not significant, *p < 0.05, **p < 0.01, and ****p < 0.0001
Fig. 7.
Fig. 7.
1H3 affects CLK1 and CLK2 function and expression. a Effect of compound 1H3 on SRSF2 subcellular distribution upon overexpression of CLKs in HeLa B2 cell line. Cells were transfected with indicated GFP-CLK expression vectors and 48 h post transfection treated with DMSO or 200 nM 1H3 for 24 h, fixed and processed for immunofluorescence. Cells were stained with anti-SRSF2 antibody, a marker for nuclear speckles, and nuclei stained with DAPI. Shown are the representative images of the localization patterns of SRSF2 upon overexpression of CLK1, CLK2, or CLK3. Red arrows indicate loss of nuclear speckles due to CLK overexpression in DMSO or 1H3-treated cells upon CLK3 overexpression. Yellow arrows indicate restoration of nuclear speckles in 1H3-treated cells upon CLK1 or CLK2 overexpression. Images are representative of n = 3 independent experiments. b, c Healthy donor CD4+ T cells were infected with HIV-1 89.6 then treated with DMSO, 10 µM TG003, or 300 nM 1H3 for 3 d. Cells were harvested and the effect of individual treatments on CLK1, CLK2, CLK3, or SRPK1 b protein or c mRNA expression determined. Shown on the left in b is a representative western blot and, on the right, a summary of assays. Data shown corresponds to results from n > 6 individual patient samples from 2 independent experiments. d, e 1C8 inhibits HIV-1 gene expression and alters CLK expression. CEM-HIV* cells were treated with 10 µM 1C8 or equivalent volume of DMSO. HIV-1 expression was induced by addition of DOX + prostratin for 24 h. Cells were subsequently harvested, and the lysates analyzed by western blot for d HIV-1 Gag and Env expression or e expression of CLK1, CLK2, or CLK3. Shown are the representative western blots and below is a graphical summary of the blots across n = 3 independent assays. Band intensity was quantified relative to Dox induced DMSO control and normalized to total protein load using Bio-Rad ImageLab software. *p ≤ 0.05, **p ≤ 0.01, ***p ≤ 0.001
Fig. 8
Fig. 8
CLK1 and CLK2 act at distinct steps to regulate HIV-1 gene expression. HIV-1 provirus integrated into the host genome is transcribed by the cellular RNA polymerase II (RNAP II). CLK1 acts to suppress the use of the HIV-1 promoter while CLK2 promotes steps in viral RNA synthesis/processing post initiation (elongation, splicing, or 3′ end formation)

Similar articles

Cited by

References

    1. Karn J, Stoltzfus CM. Transcriptional and posttranscriptional regulation of HIV-1 gene expression. Cold Spring Harb Perspect Med. 2012;2:a006916. - PMC - PubMed
    1. Stoltzfus C. Regulation of HIV-1 alternative RNA splicing and its role in virus replication. Adv Virus Res. 2009;74:1–40. - PubMed
    1. Ocwieja KE, Sherrill-Mix S, Mukherjee R, Custers-Allen R, David P, Brown M, Wang S, Link DR, Olson J, Travers K, et al. Dynamic regulation of HIV-1 mRNA populations analyzed by single-molecule enrichment and long-read sequencing. Nucleic Acids Res. 2012;40:10345–10355. - PMC - PubMed
    1. Emery A, Zhou S, Pollom E, Swanstrom R. Characterizing HIV-1 splicing by using next-generation sequencing. J Virol. 2017;91:e02515–e02516. - PMC - PubMed
    1. Mahiet C, Swanson CM. Control of HIV-1 gene expression by SR proteins. Biochem Soc Trans. 2016;44:1417–1425. - PubMed

Publication types