. 2022 Aug 19;13(1):45.
doi: 10.1186/s13293-022-00455-x.

Mitochondrial function and oxidative stress in white adipose tissue in a rat model of PCOS: effect of SGLT2 inhibition

Affiliations

Mitochondrial function and oxidative stress in white adipose tissue in a rat model of PCOS: effect of SGLT2 inhibition

Jacob E Pruett et al. Biol Sex Differ. .

Abstract

Background: Polycystic ovary syndrome (PCOS), characterized by androgen excess and ovulatory dysfunction, is associated with a high prevalence of obesity and insulin resistance (IR) in women. We demonstrated that sodium-glucose cotransporter-2 inhibitor (SGLT2i) administration decreases fat mass without affecting IR in the PCOS model. In male models of IR, administration of SGLT2i decreases oxidative stress and improves mitochondrial function in white adipose tissue (WAT). Therefore, we hypothesized that SGLT2i reduces adiposity via improvement in mitochondrial function and oxidative stress in WAT in PCOS model.

Methods: Four-week-old female rats were treated with dihydrotestosterone for 90 days (PCOS model), and SGLT2i (empagliflozin) was co-administered during the last 3 weeks. Body composition was measured before and after SGLT2i treatment by EchoMRI. Subcutaneous (SAT) and visceral (VAT) WAT were collected for histological and molecular studies at the end of the study.

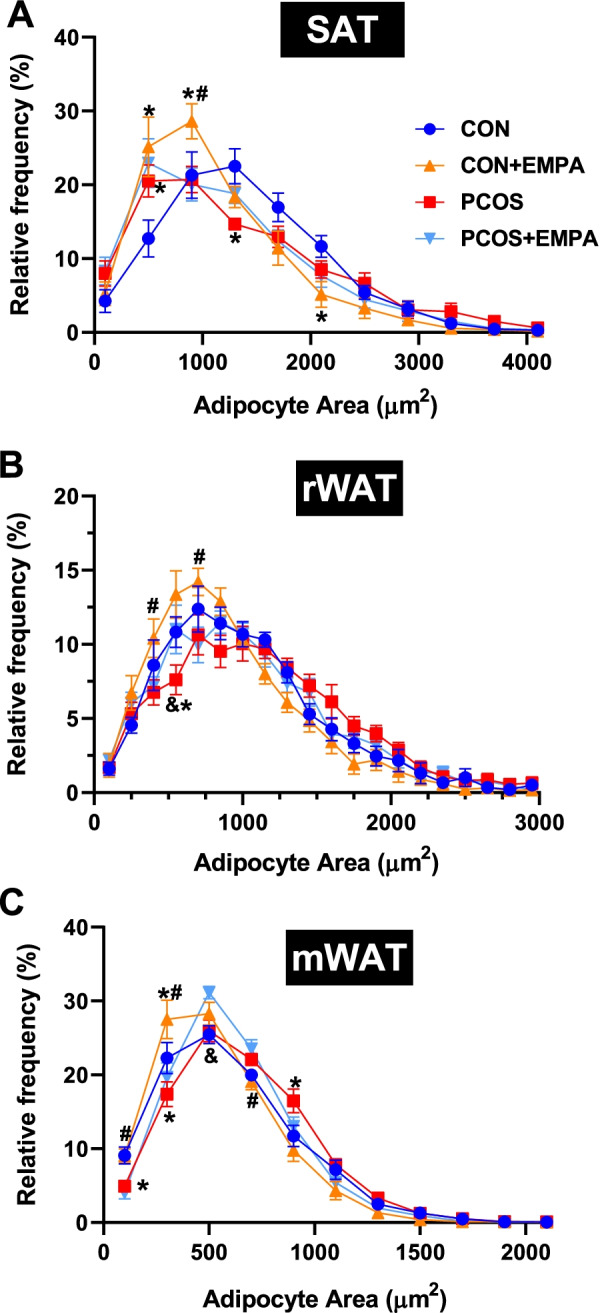
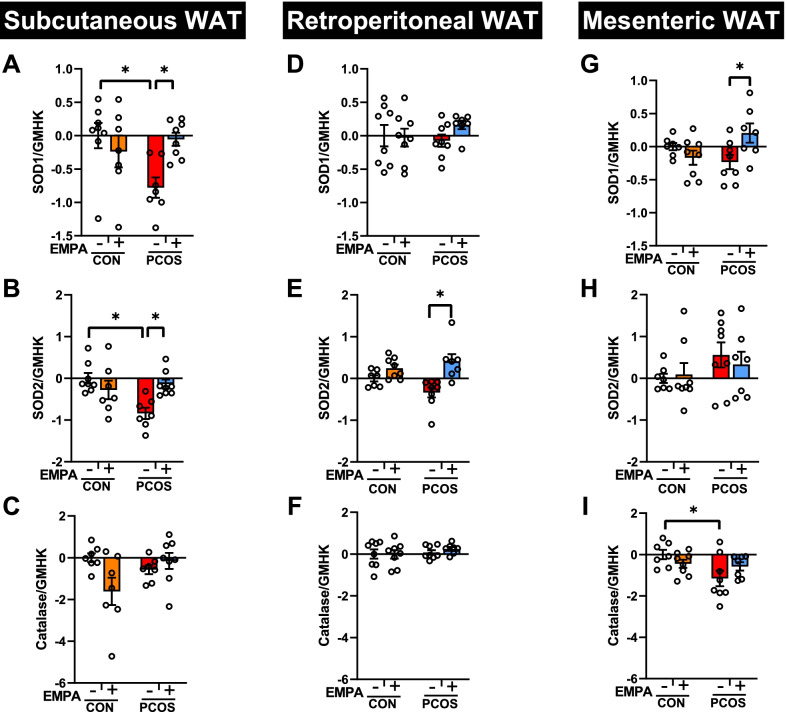
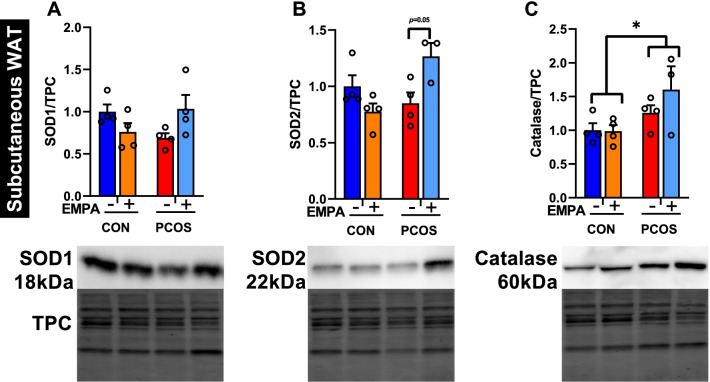
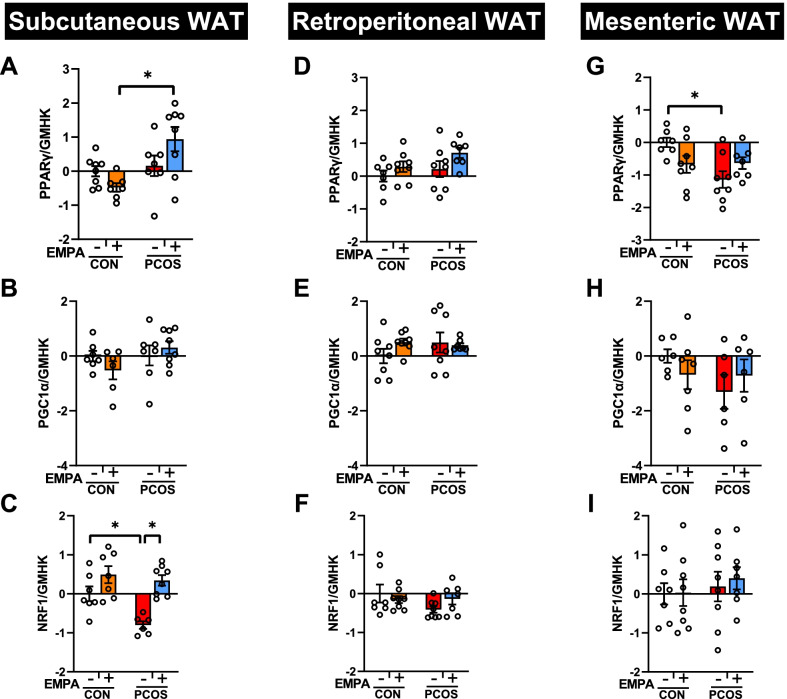
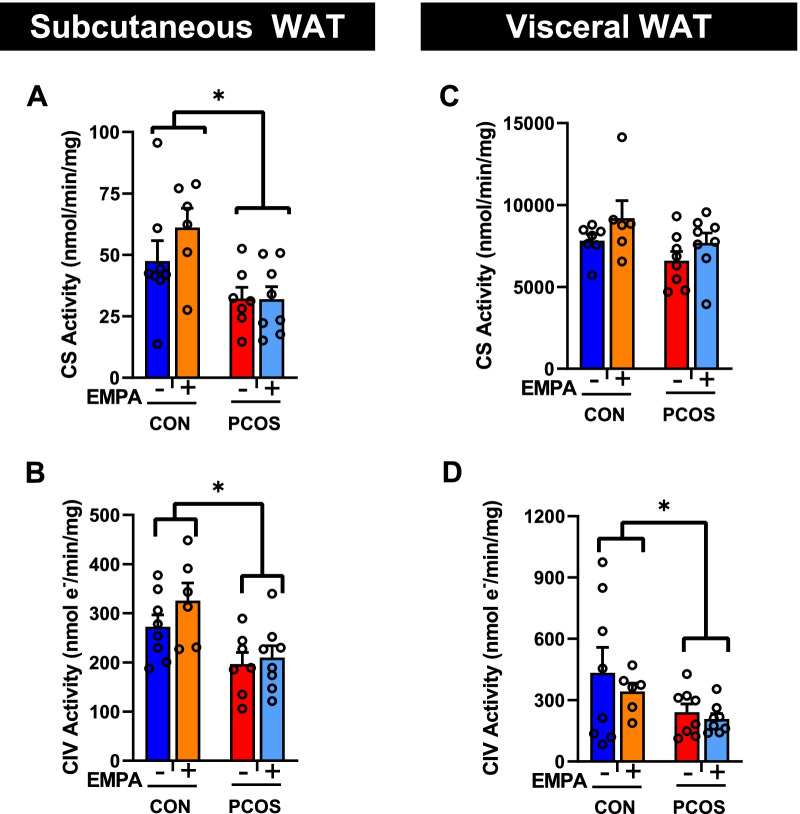
Results: PCOS model had an increase in food intake, body weight, body mass index, and fat mass/lean mass ratio compared to the control group. SGLT2i lowered fat mass/lean ratio in PCOS. Glucosuria was observed in both groups, but had a larger magnitude in controls. The net glucose balance was similar in both SGLT2i-treated groups. The PCOS SAT had a higher frequency of small adipocytes and a lower frequency of large adipocytes. In SAT of controls, SGLT2i increased frequencies of small and medium adipocytes while decreasing the frequency of large adipocytes, and this effect was blunted in PCOS. In VAT, PCOS had a lower frequency of small adipocytes while SGLT2i increased the frequency of small adipocytes in PCOS. PCOS model had decreased mitochondrial content in SAT and VAT without impacting oxidative stress in WAT or the circulation. SGLT2i did not modify mitochondrial function or oxidative stress in WAT in both treated groups.

Conclusions: Hyperandrogenemia in PCOS causes expansion of WAT, which is associated with decreases in mitochondrial content and function in SAT and VAT. SGLT2i increases the frequency of small adipocytes in VAT only without affecting mitochondrial dysfunction, oxidative stress, or IR in the PCOS model. SGLT2i decreases adiposity independently of adipose mitochondrial and oxidative stress mechanisms in the PCOS model.

Keywords: Androgens; Mitochondrial dysfunction; Polycystic ovary syndrome; Sodium–glucose cotransporter-2; White adipose tissue.


Conflict of interest statement

LLYC is an Associate Editor of Biology of Sex Differences. No other conflicts of interest, financial or otherwise, are declared by the authors.

Figures

Fig. 1
Fig. 1
Effect of empagliflozin (EMPA) on anthropomorphic and glucose measures in PCOS. Effect of EMPA on A body weight, B body mass index, C change in fat mass/lean mass between 12 and 16 weeks of age, D cumulative food intake, E glucosuria, and F net glucose balance at 3 weeks of EMPA. Data are expressed as mean ± SEM. Data were analyzed by two-way ANOVA with (D) or without (AC, E, F) repeated measures, followed by Tukey post hoc tests. Significant interaction was observed for change in fat mass/lean mass, cumulative food intake, and glucosuria. *P < 0.05. n = 6–10 per group
Fig. 2
Fig. 2
Effect of EMPA on adipocyte cross-sectional area in white adipose depots in PCOS. Effect of EMPA on the relative frequency on adipocyte areas and average adipocyte area in A subcutaneous white adipose tissue, B visceral (retroperitoneal), and C visceral (mesenteric) white adipose tissue. Subcutaneous, retroperitoneal, and mesenteric adipocytes were binned every 400, 150, and 200 microns, respectively. Data were analyzed by two-way ANOVA followed by Tukey post hoc tests. Significant interactions were observed in all three depots with adipocyte area frequency, but there were no significant interactions with average adipocyte cross-sectional area in any of the three depots. *P < 0.05 compared to controls, #P < 0.05 CON + EMPA compared to PCOS + EMPA, &P < 0.05 PCOS compared to PCOS + EMPA. n = 8–10 per group
Fig. 3
Fig. 3
Effect of EMPA on mRNA expression on antioxidant enzymes in white adipose depots in PCOS. Effect of EMPA on subcutaneous white adipose tissue (WAT) mRNA expression of A cytosolic superoxide dismutase (SOD1), B mitochondrial superoxide dismutase (SOD2), and C catalase; retroperitoneal WAT mRNA expression of D SOD1, E SOD2, and F catalase; and mesenteric WAT mRNA expression of G SOD1, H SOD2, and I catalase after 3 weeks of EMPA treatment. Expression was normalized by the geometric mean of three housekeeping genes (GMHK) and standardized to untreated control rats. Log2 values are expressed as mean ± SEM. Data were analyzed by two-way ANOVA followed by Tukey post hoc tests. Significant interactions were observed for SOD1, SOD2, and catalase in subcutaneous WAT, in SOD2 in retroperitoneal WAT, and in SOD1 in mesenteric WAT. *P < 0.05. n = 7–8 per group
Fig. 4
Fig. 4
Effect of EMPA on protein expression on antioxidant enzymes in subcutaneous white adipose tissue in PCOS. Effect of EMPA on subcutaneous white adipose tissue (WAT) protein expression of A cytosolic superoxide dismutase (SOD1, ~ 18 kDa), B mitochondrial superoxide dismutase (SOD2, ~ 22 kDa), and C catalase (~ 60 kDa) after 3 weeks of EMPA treatment. Data were normalized by total protein content (TPC). Data are expressed as mean ± SEM and were analyzed by two-way ANOVA followed by Tukey post hoc tests. Significant interactions were observed for SOD1 and SOD2 in subcutaneous WAT. *P < 0.05. n = 3–4 per group
Fig. 5
Fig. 5
Effect of EMPA on systemic and white adipose tissue (WAT) oxidative stress markers in PCOS. Effect of EMPA on A heparinized plasma total antioxidant capacity expressed as copper reducing equivalents (CRE) after 3 weeks of EMPA, and B urinary isoprostane to creatinine ratio (UICR) before EMPA treatment (12 weeks of age or 12 wo) and after 3 weeks of EMPA treatment (16 weeks of age or 16 wo). Effect of EMPA on C subcutaneous WAT (SAT) 2-thiobarbituric acid reactive substances (TBARS) and D visceral (retroperitoneal) WAT (VAT) TBARS after 3 weeks of EMPA treatment. TBARS data are normalized to protein content. Data are expressed as mean ± SEM and were analyzed by two-way ANOVA (A, C, D) or by three-way ANOVA (B) followed by Tukey post hoc tests. A significant interaction was only observed for plasma total antioxidant capacity. *P < 0.05. n = 6–10 per group
Fig. 6
Fig. 6
Effect of EMPA on mRNA expression on regulators of mitochondrial biogenesis in white adipose depots in PCOS. Effect of EMPA on subcutaneous white adipose tissue (WAT) mRNA expression of A Peroxisome proliferator-activated receptor-γ (PPARγ), B PPARγ coactivator 1-α (PGC1α), and C Nuclear respiratory factor 1 (NRF1); retroperitoneal WAT mRNA expression of D PPARγ, E PGC1α, and F NRF1; and mesenteric WAT mRNA expression of G PPARγ, H PGC1α, and I NRF1 after 3 weeks of EMPA treatment. Expression was normalized by the geometric mean of three housekeeping genes (GMHK) and standardized to untreated control rats. Log2 values are expressed as mean ± SEM. Data were analyzed by two-way ANOVA followed by Tukey post hoc tests. Significant interactions were observed for PPARγ in both subcutaneous and mesenteric WATs. n = 6–8 per group
Fig. 7
Fig. 7
Effect of EMPA on citrate synthase and complex IV activities in white adipose depots in PCOS. Effect of EMPA on subcutaneous WAT A citrate synthase (CS) activity and B complex IV (CIV) activity and on visceral (retroperitoneal) WAT C CS activity and D CIV activity after 3 weeks of EMPA treatment. Data normalized by protein content. Data are expressed as mean ± SEM and were analyzed by two-way ANOVA followed by Tukey post hoc tests. No significant interaction was observed by two-way ANOVA. n = 6–8 per group
Fig. 8
Fig. 8
Effect of EMPA on mRNA expression on major components of fatty acid oxidation in white adipose depots in PCOS. Effect of EMPA on subcutaneous white adipose tissue (WAT) mRNA expression of A carnitine palmitoyltransferase 1A (CPT1A), B carnitine palmitoyltransferase 1B (CPT1B), and C medium-chain acyl-CoA dehydrogenase (MCAD); retroperitoneal WAT mRNA expression of D CPT1A, E CPT1B, and F MCAD; and mesenteric WAT mRNA expression of G CPT1A, H CPT1B, and I MCAD after 3 weeks of EMPA treatment. Expression was normalized by the geometric mean of three housekeeping genes (GMHK) and standardized to untreated control rats. Log2 values are expressed as mean ± SEM. Data were analyzed by two-way ANOVA followed by Tukey post hoc tests. Significant interaction was only observed for MCAD in subcutaneous WAT. n = 7–8 per group

References

    1. Bozdag G, Mumusoglu S, Zengin D, Karabulut E, Yildiz BO. The prevalence and phenotypic features of polycystic ovary syndrome: a systematic review and meta-analysis. Hum Reprod. 2016;31(12):2841–2855. doi: 10.1093/humrep/dew218. - DOI - PubMed
    1. March WA, Moore VM, Willson KJ, Phillips DI, Norman RJ, Davies MJ. The prevalence of polycystic ovary syndrome in a community sample assessed under contrasting diagnostic criteria. Hum Reprod. 2010;25(2):544–551. doi: 10.1093/humrep/dep399. - DOI - PubMed
    1. Knochenhauer ES, Key TJ, Kahsar-Miller M, Waggoner W, Boots LR, Azziz R. Prevalence of the polycystic ovary syndrome in unselected black and white women of the southeastern United States: a prospective study. J Clin Endocrinol Metab. 1998;83(9):3078–3082. - PubMed
    1. Dumesic DA, Oberfield SE, Stener-Victorin E, Marshall JC, Laven JS, Legro RS. Scientific statement on the diagnostic criteria, epidemiology, pathophysiology, and molecular genetics of polycystic ovary syndrome. Endocr Rev. 2015;36(5):487–525. doi: 10.1210/er.2015-1018. - DOI - PMC - PubMed
    1. Lo JC, Feigenbaum SL, Yang J, Pressman AR, Selby JV, Go AS. Epidemiology and adverse cardiovascular risk profile of diagnosed polycystic ovary syndrome. J Clin Endocrinol Metab. 2006;91(4):1357–1363. doi: 10.1210/jc.2005-2430. - DOI - PubMed

Publication types

Substances