. 2022 Nov;100(11):2044-2054.
doi: 10.1002/jnr.25118. Epub 2022 Aug 20.

Quantification of functional recovery in a larval zebrafish model of spinal cord injury

Affiliations

Quantification of functional recovery in a larval zebrafish model of spinal cord injury

Darius Hossainian et al. J Neurosci Res. 2022 Nov.

Abstract

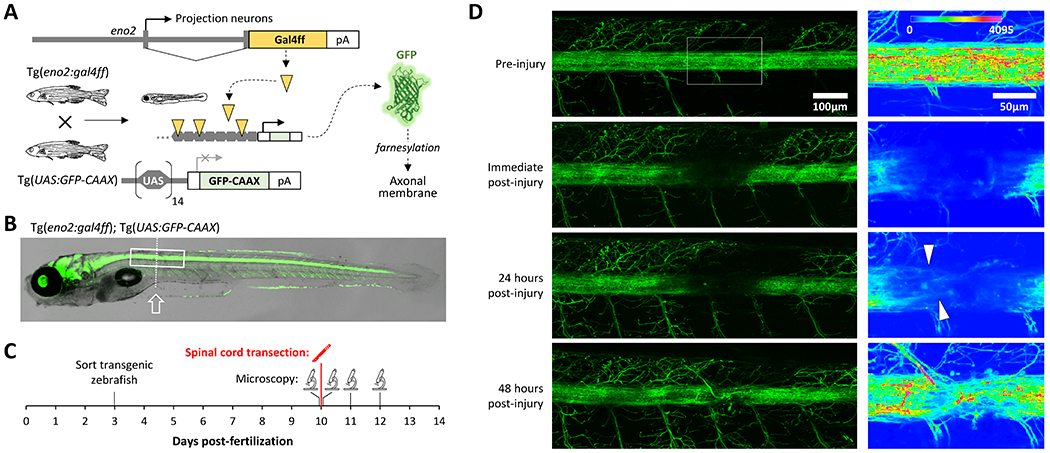
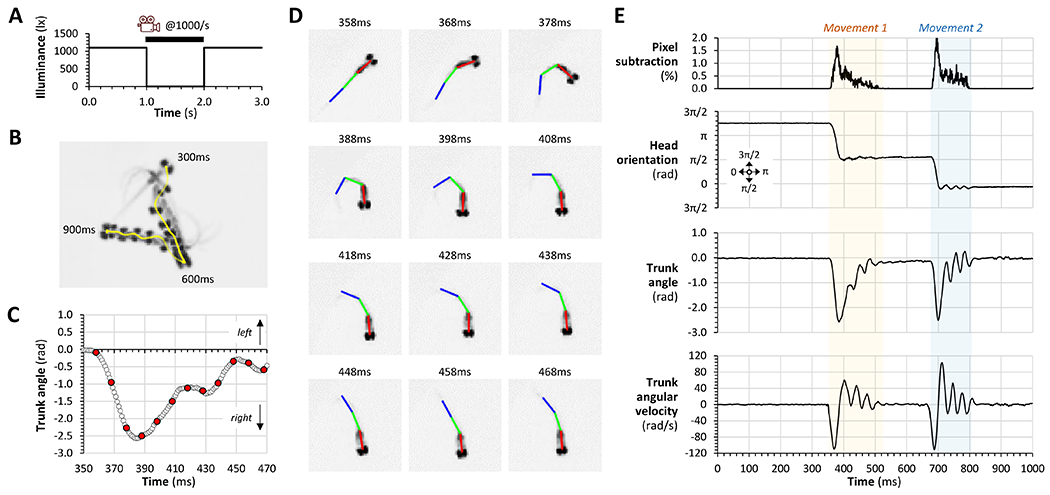
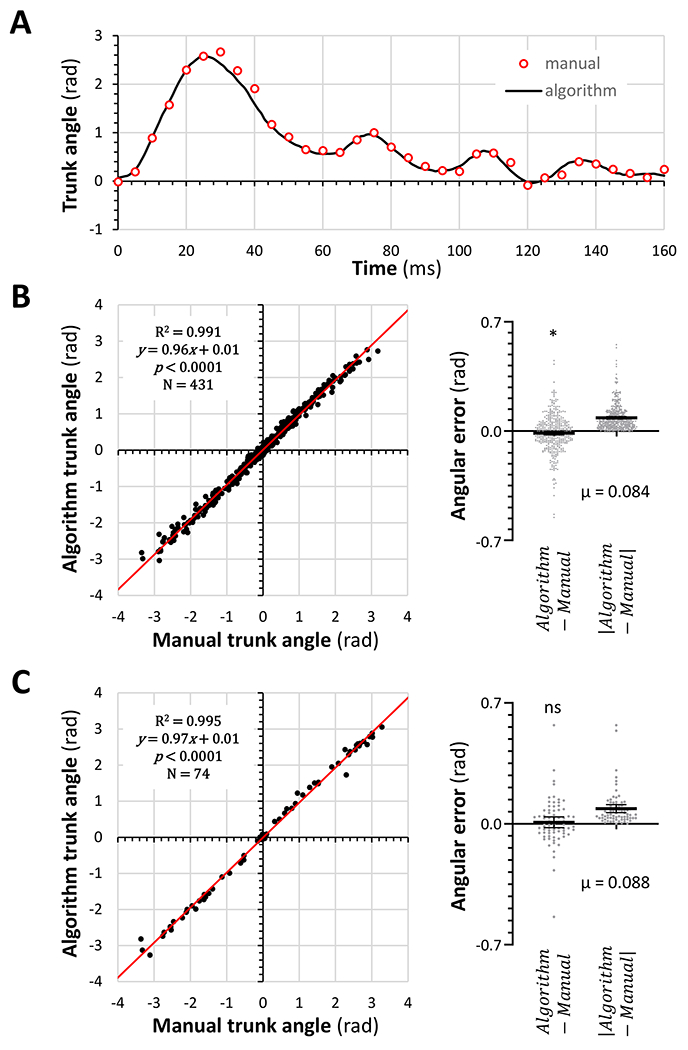
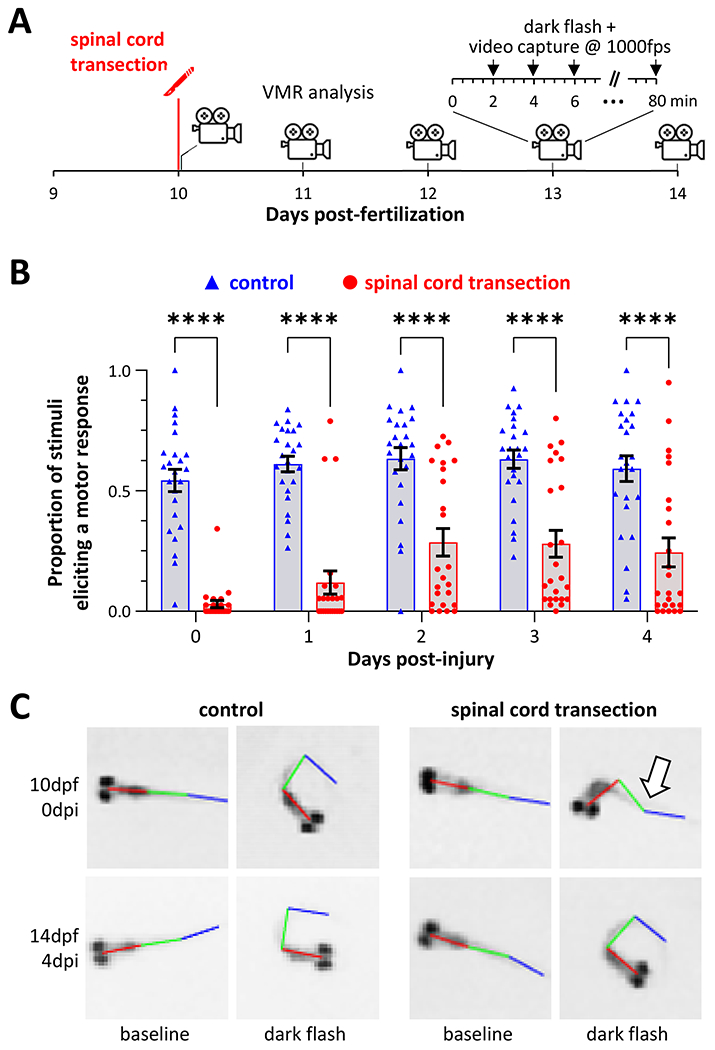
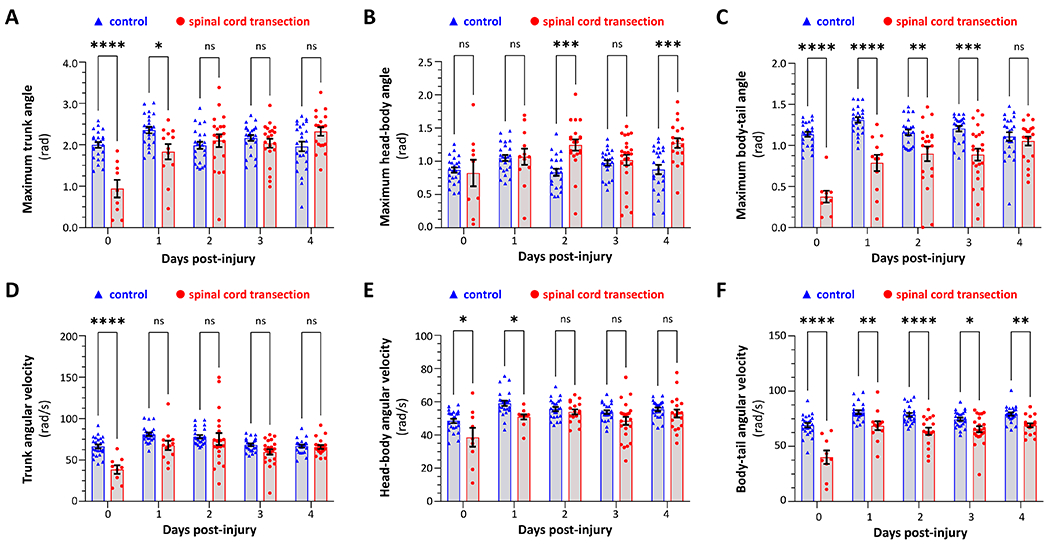
Human spinal cord injury (SCI) is characterized by permanent loss of damaged axons, resulting in chronic disability. In contrast, zebrafish can regenerate axonal projections following central nervous system injury and re-establish synaptic contacts with distant targets; elucidation of the underlying molecular events is an important goal with translational potential for improving outcomes in SCI patients. We generated transgenic zebrafish with GFP-labeled axons and transected their spinal cords at 10 days post-fertilization. Intravital confocal microscopy revealed robust axonal regeneration following the procedure, with abundant axons bridging the transection site by 48 h post-injury. In order to analyze neurological function in this model, we developed and validated new open-source software to measure zebrafish lateral trunk curvature during propulsive and turning movements at high temporal resolution. Immediately following spinal cord transection, axial movements were dramatically decreased caudal to the lesion site, but preserved rostral to the injury, suggesting the induction of motor paralysis below the transection level. Over the subsequent 96 h, the magnitude of movements caudal to the lesion recovered to baseline, but the rate of change of truncal curvature did not fully recover, suggesting incomplete restoration of caudal strength over this time course. Quantification of both morphological and functional recovery following SCI will be important for the analysis of axonal regeneration and downstream events necessary for restoration of motor function. An extensive array of genetic and pharmacological interventions can be deployed in the larval zebrafish model to investigate the underlying molecular mechanisms.

Keywords: axonal regeneration; high-speed macrovideography; intravital microscopy; machine vision; spinal paralysis; swimming kinematics.


Conflict of interest statement

Conflict of interest statement:

The authors have no conflicts of interest.

Figures

Figure 1:
Figure 1:. Intravital imaging of axonal regeneration in larval zebrafish
A: Schematic depiction of the transgenic lines used to express GFP at the membrane of ascending and descending spinal axonal projections. B: Superimposed brightfield and confocal images of a Tg(eno2:gal4ff); Tg(UAS:GFP-CAAX); mpv17−/−; mitfa−/− zebrafish at 10dpf, illustrating widespread axonal labeling by membrane bound GFP. The boxed area corresponds to the region shown in the left column of panel D and the dotted line indicates the cord transection plane. C: Time course of the experiment shown in panel D. D: Confocal Z-plane projections of the spinal cord of a Tg(eno2:gal4ff); Tg(UAS:GFP-CAAX); mpv17−/−; mitfa−/− zebrafish (rostral is to the left). The same zebrafish was imaged prior to spinal cord transection at 10 dpf (top row of images), immediately afterwards, and 24 and 48 hours later (lower rows). The boxed area in the first image encompassing the transection site is shown at higher magnification in the column of images to the right, using the color intensity scale shown in the top panel. Arrowheads indicate regenerating axons at 24 hours post-injury.
Figure 2:
Figure 2:. An open-source MATLAB application for quantifying larval zebrafish kinematics following an experimental manipulation
A: Time course of dark flash and camera trigger to elicit and record the VMR. B: Example response of an individual zebrafish to abrupt light-dark transition. Every 20th video frame from 300ms to 900ms after the stimulus is superimposed to illustrate the changes in larval position and orientation. The vector track of the head centroid during the movement is shown in yellow. C: The trunk angle (head-tail) of the zebrafish in panel B is plotted against time during the first turning movement (350 – 470ms after the stimulus). Red data points correspond to the pictures in panel D. D: Individual video frames are shown every 10ms between 358 – 468ms after the stimulus. Head (red), body (green) and tail (blue) bars were fitted to the image by the algorithm. Truncal curvature in C and E was by calculated as the angle between the red and blue bars. E: The entire response over 1000ms is plotted for the zebrafish in panels B – D. Two separate movement episodes are readily identified. In each case the movement started with an abrupt change in larval head orientation, associated with striking truncal curvature, made at high angular velocity in the same direction. The movements conclude with tail-beating motions that cause propulsion.
Figure 3:
Figure 3:. Validation of a MATLAB application for measuring trunk angle dynamically in a high framerate video stream
A: The output from our MATLAB algorithm (solid black line) was compared with trunk angles calculated from manually drawn bars of constrained length mimicking the algorithm in every 5th video frame during a movement episode (red circles) in a zebrafish at 11dpf. B: Trunk angles derived from manually (x-axis) or automatically (y-axis) assigned body segment bars were plotted for 431 video frames corresponding to 20 entire movements similar to the episode shown in panel A. The difference and absolute difference between the manual and automatic measurements is shown in the scatterplots to the right. C: Similar data to panel B were measured in video frames corresponding to the maximum trunk curvature for 74 separate movement episodes. In B and C, a single sample t-test was used to compare the differences between automated and manual measurement to 0 (*p<0.05).
Figure 4:
Figure 4:. Recovery of reduced response rate and abnormal swimming kinematics following spinal cord transection
A: Time course for the experiments shown in figures 4 and 5. Starting immediately after spinal cord transection, zebrafish motor responses to light-dark transition were recorded daily over 5 days. In each session, responses were recorded to 40 dark flash stimuli each after 2 minutes of acclimatization in bright white light. B: Response rate (proportion of stimuli that provoked a measurable motor response) is plotted for 24 control (blue) and 24 spinal cord injury (red) zebrafish on each day after injury. ****p<0.0001, 2-way ANOVA with Šidák post-hoc test. C: Representative video frames showing baseline (left column of each group) and maximal (right column of each group) trunk curvature during responses to light-dark transition in control (left group) and spinal cord transection (right group) zebrafish, at 0 (top row) and 4 (bottom row) days post-injury. The arrow indicates the paralyzed distal segment of the injured zebrafish that recovered by 4 days later.
Figure 5:
Figure 5:. Partial recovery of swimming kinematics following spinal cord transection in larval zebrafish
Kinematics of motor responses to sudden ambient light-dark transition were quantified in control zebrafish (blue, triangles) and siblings that underwent spinal cord transection at 10dpf (red, circles). Data points represent individual zebrafish and show the mean of all elicited responses for each zebrafish at a particular time point (all zebrafish that showed at least one response are included at each time point). Bars show group mean ± SE. A – C show maximal angles: (A) head-tail; (B) head-body; (C) body-tail. D – F show mean angular velocity: (D) head-tail; (E) head-body; (F) body-tail. Data were analyzed by two-way ANOVA with experimental group and time post-injury as variables, and pairwise comparisons made by Šidák post hoc test (p<0.05*, 0.001**, 0.0001***, 0.00001****). ANOVA tables are shown in supplemental tables 1 – 6.

References

    1. Bai Q, Garver JA, Hukriede NA, Burton EA. 2007. Generation of a transgenic zebrafish model of Tauopathy using a novel promoter element derived from the zebrafish eno2 gene. Nucleic acids research 35(19):6501–6516. - PMC - PubMed
    1. Bai Q, Sun M, Stolz DB, Burton EA. 2011. Major isoform of zebrafish P0 is a 23.5 kDa myelin glycoprotein expressed in selected white matter tracts of the central nervous system. J Comp Neurol 519(8):1580–1596. - PMC - PubMed
    1. Bai Q, Wei X, Burton EA. 2009. Expression of a 12-kb promoter element derived from the zebrafish enolase-2 gene in the zebrafish visual system. Neurosci Lett 449(3):252–257. - PMC - PubMed
    1. Becker CG, Becker T. 2002. Repellent guidance of regenerating optic axons by chondroitin sulfate glycosaminoglycans in zebrafish. J Neurosci 22(3):842–853. - PMC - PubMed
    1. Becker CG, Lieberoth BC, Morellini F, Feldner J, Becker T, Schachner M. 2004. L1.1 is involved in spinal cord regeneration in adult zebrafish. J Neurosci 24(36):7837–7842. - PMC - PubMed

Publication types

LinkOut - more resources