Review
. 2022 Nov;12(11):1912-1938.
doi: 10.1002/2211-5463.13473. Epub 2022 Sep 2.

On the difficulties of characterizing weak protein interactions that are critical for neurotransmitter release

Affiliations
Review

On the difficulties of characterizing weak protein interactions that are critical for neurotransmitter release

Josep Rizo et al. FEBS Open Bio. 2022 Nov.

Abstract

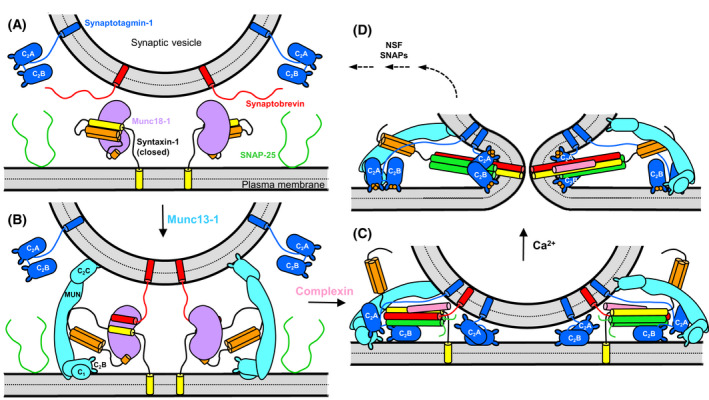
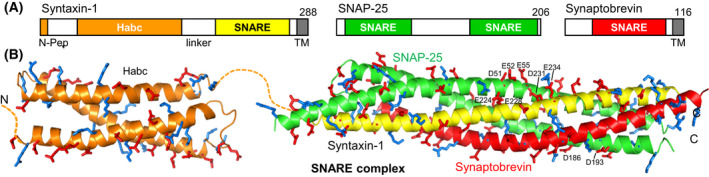
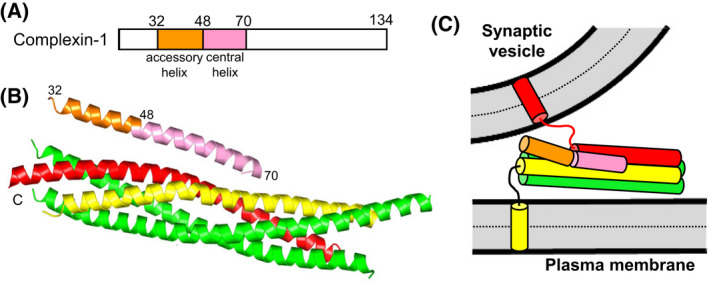
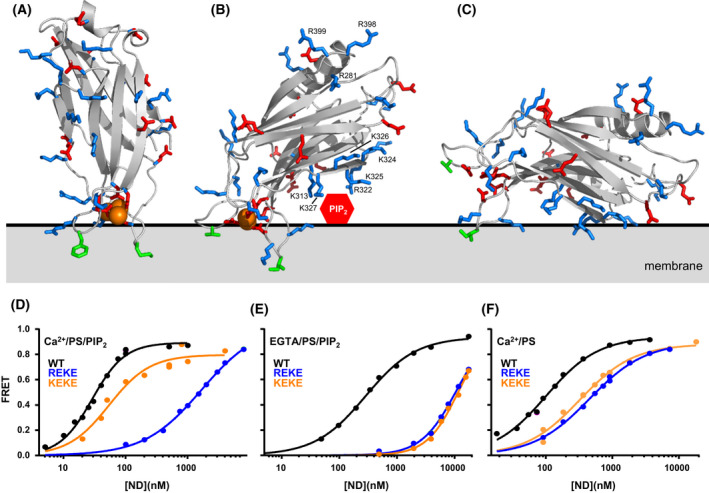
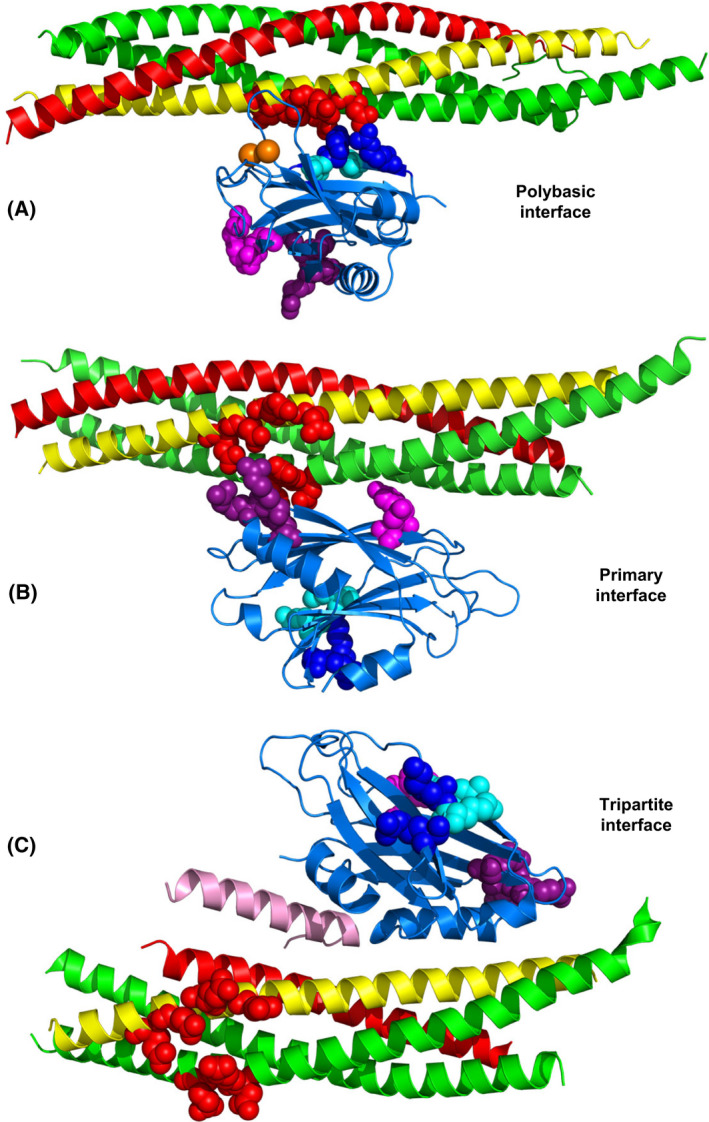
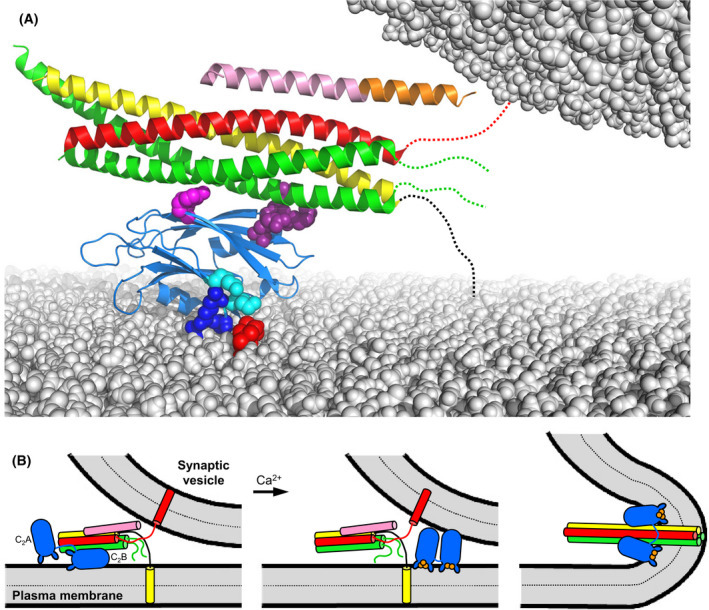
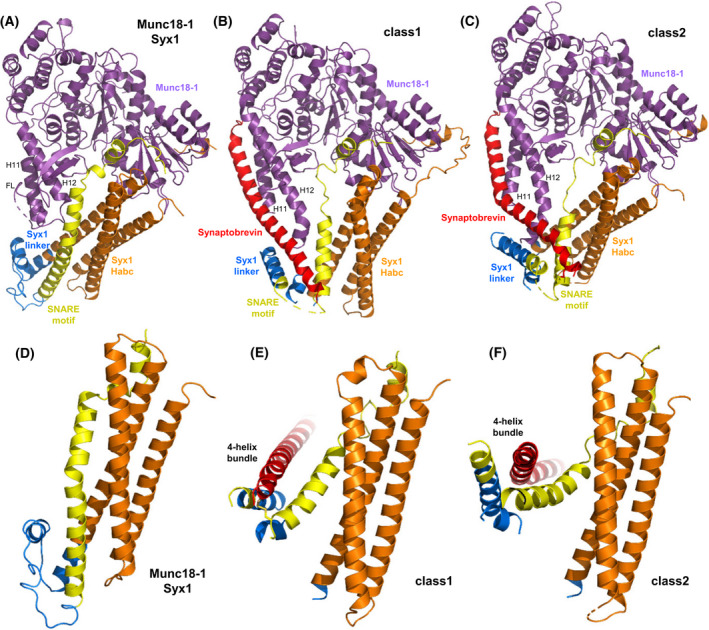
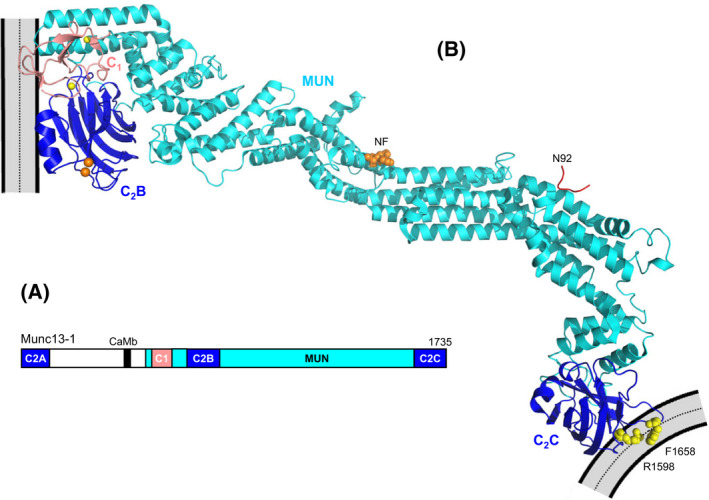
The mechanism of neurotransmitter release has been extensively characterized, showing that vesicle fusion is mediated by the SNARE complex formed by syntaxin-1, SNAP-25 and synaptobrevin. This complex is disassembled by N-ethylmaleimide sensitive factor (NSF) and SNAPs to recycle the SNAREs, whereas Munc18-1 and Munc13s organize SNARE complex assembly in an NSF-SNAP-resistant manner. Synaptotagmin-1 acts as the Ca2+ sensor that triggers exocytosis in a tight interplay with the SNAREs and complexins. Here, we review technical aspects associated with investigation of protein interactions underlying these steps, which is hindered because the release machinery is assembled between two membranes and is highly dynamic. Moreover, weak interactions, which are difficult to characterize, play key roles in neurotransmitter release, for instance by lowering energy barriers that need to be overcome in this highly regulated process. We illustrate the crucial role that structural biology has played in uncovering mechanisms underlying neurotransmitter release, but also discuss the importance of considering the limitations of the techniques used, including lessons learned from research in our lab and others. In particular, we emphasize: (a) the promiscuity of some protein sequences, including membrane-binding regions that can mediate irrelevant interactions with proteins in the absence of their native targets; (b) the need to ensure that weak interactions observed in crystal structures are biologically relevant; and (c) the limitations of isothermal titration calorimetry to analyze weak interactions. Finally, we stress that even studies that required re-interpretation often helped to move the field forward by improving our understanding of the system and providing testable hypotheses.

Keywords: SNAREs; complexin; membrane fusion; neurotransmitter release; synaptotagmin; weak protein interactions.


Conflict of interest statement

The authors declare no conflict of interest.

Figures

Fig. 1
Fig. 1
Working model of the steps that lead to neurotransmitter release. (A) Diagram showing the localization of synaptobrevin (red) and Syt1 (blue) on a synaptic vesicle and of SNAP‐25 (green) and syntaxin‐1 (N‐peptide and Habc domain in orange; SNARE motif and TM region in yellow) on the plasma membrane. Syntaxin‐1 adopts a closed conformation in which the SNARE motif binds intramolecularly to the Habc domain. This closed conformations binds tightly to Munc18‐1 (purple) and this complex is the starting point of the pathway that leads to synaptic vesicle fusion. (B) Munc13‐1 (cyan) bridges the vesicle and plasma membranes and binds to the linker joining the Habc domain and the SNARE motif of syntaxin‐1, helping to open syntaxin‐1. Binding of synaptobrevin to Munc18‐1 forms the template complex. (C) Binding of SNAP‐25 to syntaxin‐1 and synaptobrevin leads to partial assembly of the SNARE four‐helix bundle. Syt1 binds to the SNARE complex and the plasma membrane through the C2B domain, and complexin (pink) binds to the other side of the SNARE complex, stabilizing the complex and likely preventing dissociation of the SNARE complex by NSF/SNAPs but at the same time hindering premature fusion. (D) Ca2+ influx leads to dissociation of Syt1 from the SNARE complex due to tight Ca2+‐ and PIP2‐dependent binding to the plasma membrane. The same Syt1 molecules or others that might be in the space between the vesicle and the plasma membrane (C) cooperate with the SNARE complex in inducing membrane fusion. In (C, D), the complexin N‐ and C‐terminal regions, as well as the flexible linker joining the SNAP‐25 SNARE motifs, are not shown for simplicity.
Fig. 2
Fig. 2
The SNARE complex. (A) Domain diagram of syntaxin‐1, SNAP‐25 and synaptobrevin with the length of each protein indicated by the number on the right, above each diagram. SNARE indicates SNARE motif. N‐pep, N‐peptide. (B) Ribbon diagrams of the NMR structure of the syntaxin‐1 Habc domain (orange) [48] (PDB accession code 1BR0) and the SNARE four‐helix bundle [13] (PDB accession code 1SFC) with syntaxin‐1 SNARE motif in yellow, SNAP‐25 in green and synaptobrevin in red. Acidic and basic side chains are shown as stick models and colored in red and blue, respectively. Selected side chains involved in Syt1 binding mentioned in the text are labeled. N indicates the N‐terminus of syntaxin‐1 and C the C‐termini of the SNARE motifs of syntaxin‐1, SNAP‐25 and synaptobrevin.
Fig. 3
Fig. 3
Complexin‐1 structure and function. (A) Domain diagram of complexin‐1. Selected residue numbers are indicated above the diagram. (B) Ribbon diagram of the crystal structure of Cpx1(26–83) (accessory helix in orange, central helix in pink) bound to the SNARE complex, with synaptobrevin in red, syntaxin‐1 in yellow and SNAP‐25 in green [43] (PDB accession number 1KIL). Selected residue numbers are indicated. C denotes the C‐termini of the SNAREs. (C) Model showing how the accessory helix of complexin‐1 bound to a partially assembled trans‐SNARE complex is expected to have steric clashes with the vesicle that would hinder final C‐terminal zippering of the SNARE four‐helix bundle [84].
Fig. 4
Fig. 4
Structure and membrane interactions of the Synaptotagmin‐1 C2 domains. (A, B) Ribbon diagrams of the NMR structures of the Syt1 C2A (A) and C2B (B) domains [47, 51] bound to Ca2+ (orange spheres) (PDB accession numbers 1BYN and 1K5W, respectively) in the approximate orientations with respect to a flat phospholipid bilayer (gray) defined by EPR [105, 107]. The slightly slanted orientation of the C2B domain in (B) enables interactions of residues from the polybasic region with PIP2 head groups that protrude from the bilayer surface (red hexagon). Basic residues involved in SNARE complex and membrane interactions are labeled and shown by stick models. Hydrophobic side chains that insert into the membrane are shown as green stick models. Note that K313, R322, K325 and K327 in the polybasic face of the C2B domain can readily bind to PIP2 in these orientations whereas K324 and K326 are oriented away from the membrane, farther from the PIP2 head group. These observations explain the selective disruption of neurotransmitter release caused by mutations in the polybasic face [108, 112]. (C) Approximately parallel orientation of the C2B domain with respect to the membrane expected in the absence of Ca2+, which is supported by MD simulations [87]. (D–F) Selectively strong disruption of Syt1 C2AB binding to membranes by the R322E,K325E (REKE) mutation but not by the K324E,K326E (KEKE) mutation is observed in the presence of Ca2+ and PIP2 but not in the absence of Ca2+ and/or PIP2. The plots show binding of C2AB to nanodiscs containing PS and PIP2 (D, E) or PS but not PIP2 (F) in the presence of Ca2+ and 125 mm KCL (D, F) or EGTA and 50 mm KCl (E). These data were reported in [45]. The data in panel (E) were acquired at lower ionic strength because binding is very weak in the absence of Ca2+.
Fig. 5
Fig. 5
Structures of Synaptotagmin‐1‐SNARE complexes. (A–C) Ribbon diagrams of the dynamic structure of a C2B domain‐SNARE complex determined in solution by NMR spectroscopy [112] (A) (only a representative conformer of the large ensemble is shown), of a C2B domain‐SNARE complex determined by X‐ray crystallography [44] (B), and of a C2B domain‐SNARE‐complexin‐1 complex determined also by X‐ray crystallography [138] (C). The PDB accession numbers are 2N1T, 5KJ7 and 5W5C, respectively. The Syt1 C2B domain is in blue, complexin‐1 in pink, synaptobrevin in red, syntaxin‐1 in yellow and SNAP‐25 in green. Selected residues from the C2B polybasic region are shown as blue (R322 and K325) or cyan (K324 and K326) spheres, selected C2B residues that form the primary are shown as pink (E295 and Y338) or deep purple (R281, R398 and R399) spheres, and selected acidic residues of the SNAREs involved in binding to the polybasic region or the primary interface of the C2B domain (D51, E52 and E55 of SNAP‐25, and E224, E228, D231 and E234 of syntaxin‐1) are shown as red spheres.
Fig. 6
Fig. 6
Model of how synaptotagmin‐1, the SNAREs and complexin‐1 form a primed state that prevents premature fusion but is ready for fast membrane fusion upon Ca2+ influx. (A) Model of the Syt1‐SNARE‐complexin‐1 primed complex bridging a synaptic vesicle and the plasma membrane before Ca2+ influx. The ribbon diagram is based on a superposition of the structures of the Cpx1(26–83)/SNARE complex [43] and of Syt1 C2B domain bound to the SNARE complex via the primary interface [44] (PDB accession numbers 1KIL and 5KJ7, respectively). The Syt1 C2B domain is in blue, complexin‐1 in orange (accessory helix) and pink (central helix), synaptobrevin in red, syntaxin‐1 in yellow and SNAP‐25 in green. Selected residues from the C2B polybasic region are shown as blue (R322 and K325) or cyan (K324 and K326) spheres, and selected C2B residues that form the primary are shown as pink (E295 and Y338) or deep purple (R281, R398 and R399) spheres. A PIP2 head group in the flat lipid bilayer representing the plasma membrane is shown as red spheres. Dashed lines indicate unstructured regions of the SNARE motif C‐termini that have not zippered because of steric hindrance of the complexin‐1 accessory helix and the vesicle. The flexible linker joining the SNAP‐25 SNARE motifs is not shown for simplicity. (B) Model of Ca2+‐triggered neurotransmitter release starting with the primed state present before Ca2+ (left), which is analogous to the model of panel (A) but includes the Syt1 C2A domain in an arbitrary position. Ca2+ influx triggers dissociation of Syt1 from the SNARE complex (middle) and Syt1 and the SNAREs trigger fast membrane fusion (right) by a mechanism that remains highly enigmatic. The complexin‐1 N‐ and C‐terminal regions, and the linker joining the SNAP‐25 SNARE motifs, are not shown for simplicity. This figure is adapted from fig. 10 of Ref. [45].
Fig. 7
Fig. 7
Function of Munc18‐1 in organizing SNARE complex assembly. (A–C) Ribbon diagrams of the crystal structure of the Munc18‐1‐closed syntaxin‐1 complex (A) [20] and the two cryo‐EM structures of the Munc18‐1‐syntaxin‐1‐synaptobrevin template complex (B, C) [33] (PDB accession numbers 3C98, 7UDC and 7UDB, respectively). Syntaxin‐1 is abbreviated Syx1 and the two cryo‐EM structures are denoted class1 and class2. Munc18‐1 is in purple, synaptobrevin in red and syntaxin‐1 in orange (N‐peptide and Habc domain, blue (linker region) and yellow (SNARE motif). The positions of helices 11 and 12 (H11 and H12) of Munc18‐1, and the furled loop that connects these helices and hinders synaptobrevin binding (labeled FL) are indicated. (D–F) Close‐up views of the region where the syntaxin‐1 SNARE motif contacts the Habc domain and the linker in the Munc18‐1‐closed syntaxin‐1 complex (D), class1 (E) and class2 (F). Munc18‐1 is not shown for simplicity. Note how the SNARE motif separates gradually from the Habc domain in the three structures from left to right and how the syntaxin‐1 linker forms a short four‐helix bundle with the syntaxin‐1 and synaptobrevin SNARE motifs in class1 and class2.
Fig. 8
Fig. 8
Munc13‐1 bridging a synaptic vesicle and the plasma membrane. (A) Domain diagram of Munc13‐1. The length of Munc13‐1 is indicated by the number on the right, above the diagram. (B) Model of how Munc13‐1 bridges a synaptic vesicle and the plasma membrane in an approximately perpendicular orientation. The ribbon diagram represents one of the structures of Munc13C determined by cryo‐EM of 2D crystals of Munc13C between to phospholipid bilayers [177] (PDB accession code 7T7V) by reconstructing the density map with the help of models from AlphaFold [184] and the crystals structure of Munc13‐1 C1C2BMUN [176], Ca2+‐bound Munc13‐1 C2B domain [60] and the MUN domain [25] (PDB accession codes 5UE8, 6NYT and 4Y21, respectively). The C1 domain is shown in salmon and the C2B and C2C domains in blue. Ca2+‐ions bound to the C2B domain and zinc ions bound to the C1 domain are shown orange and yellow spheres, respectively. Residues N1128 and F1131 (NF), which are critical for the activity of the MUN domain in opening syntaxin‐1 [25], are shown as orange spheres, and R1598 and F1658 in the loops of the C2C domain, which are crucial for the membrane bridging activity of Munc13C [22], are shown as yellow spheres. A peptide corresponding to the juxtamembrane region of synaptobrevin in the position observed in the crystal structure of this peptide bound to the MUN domain [181] (PDB accession code 6A30) is represented by a red ribbon and its C‐terminal residue (N92) is labeled. Note the large distance from this residue to the vesicle, where the TM region of synaptobrevin, which starts at residue 95, is anchored. The orientation with respect to the flat membrane is approximately that observed in MD simulations in the absence of Ca2+ [23].
Fig. 9
Fig. 9
Munc13‐1‐RIM homodimer heterodimer switch. (A, B) Crystal structures of the Munc13‐1 C2A domain homodimer (A) and the Munc13‐1 C2A domain‐Rim ZF heterodimer (B) [59] (PDB accession numbers 2CJT and 2CJS, respectively). In (A), the K32 side chains in the homodimerization interface are labeled. In (B), the RIM ZF domain is in salmon and the two Munc13‐1 fragments containing the C2A domain observed in the crystals are in blue and light green. Zinc ions are shown as yellow spheres. Note that the interface of the blue fragment with RIM is the biologically relevant interface [183], whereas the interfaces formed by the light green fragment arise because of crystal contacts [59].

References

    1. Sudhof TC. Neurotransmitter release: the last millisecond in the life of a synaptic vesicle. Neuron. 2013;80:675–90. - PMC - PubMed
    1. Brunger AT, Choi UB, Lai Y, Leitz J, Zhou Q. Molecular mechanisms of fast neurotransmitter release. Annu Rev Biophys. 2018;47:469–97. - PMC - PubMed
    1. Rizo J. Molecular mechanisms underlying neurotransmitter release. Annu Rev Biophys. 2022;51:377–408. - PMC - PubMed
    1. Dittman JS, Ryan TA. The control of release probability at nerve terminals. Nat Rev Neurosci. 2019;20:177–86. - PubMed
    1. Neher E, Brose N. Dynamically primed synaptic vesicle states: key to understand synaptic short‐term plasticity. Neuron. 2018;100:1283–91. - PubMed

Publication types