. 2022 Sep 6;34(9):1248-1263.e6.
doi: 10.1016/j.cmet.2022.07.014. Epub 2022 Aug 19.

Warburg-like metabolic transformation underlies neuronal degeneration in sporadic Alzheimer's disease

Affiliations

Warburg-like metabolic transformation underlies neuronal degeneration in sporadic Alzheimer's disease

Larissa Traxler et al. Cell Metab. .

Abstract

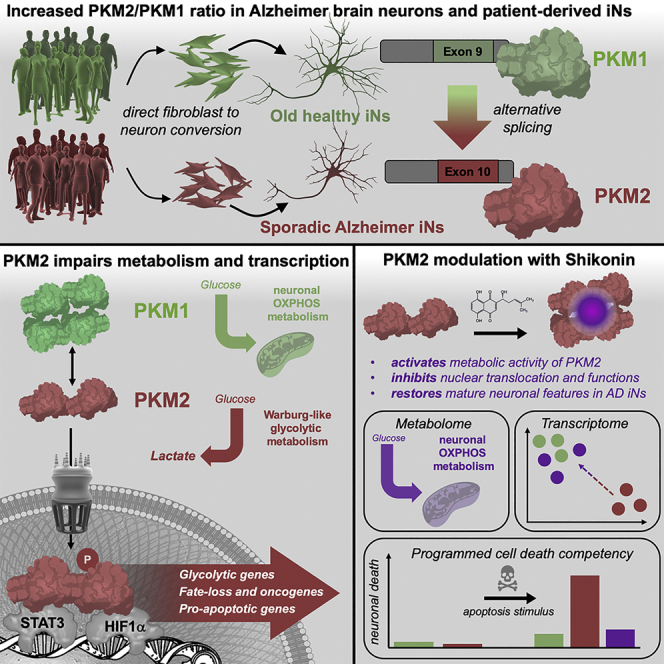
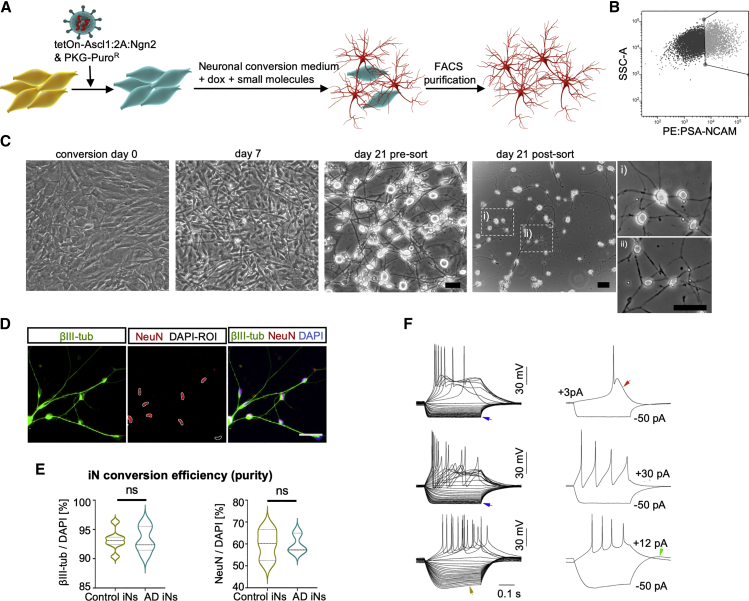
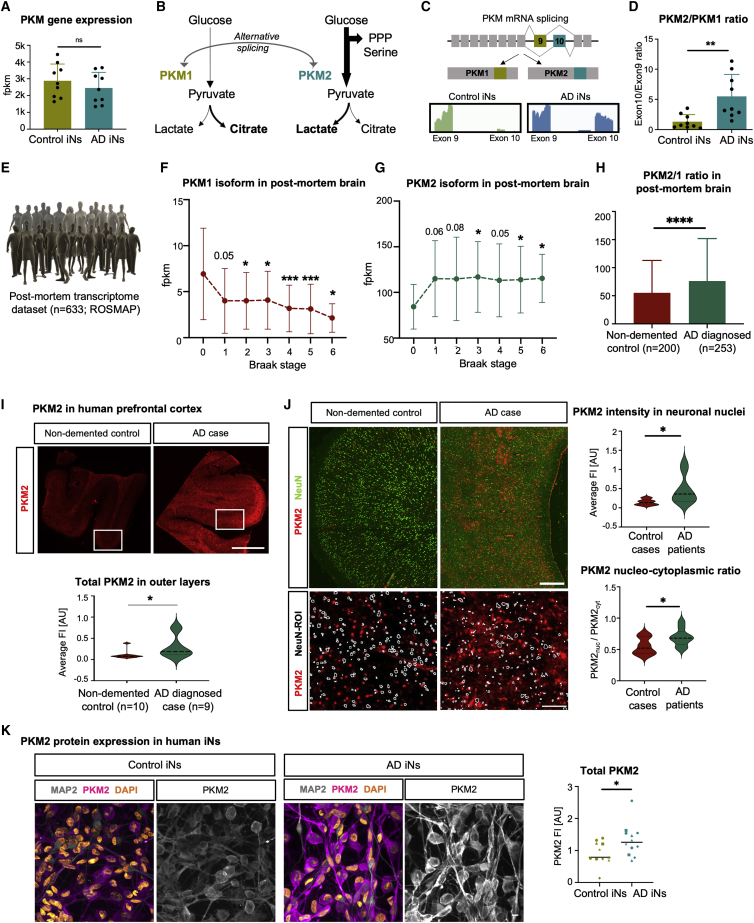
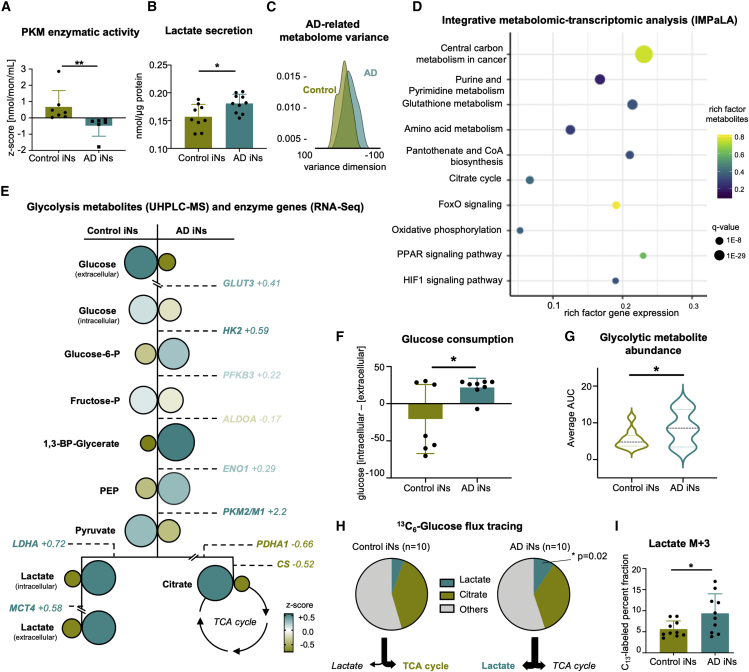
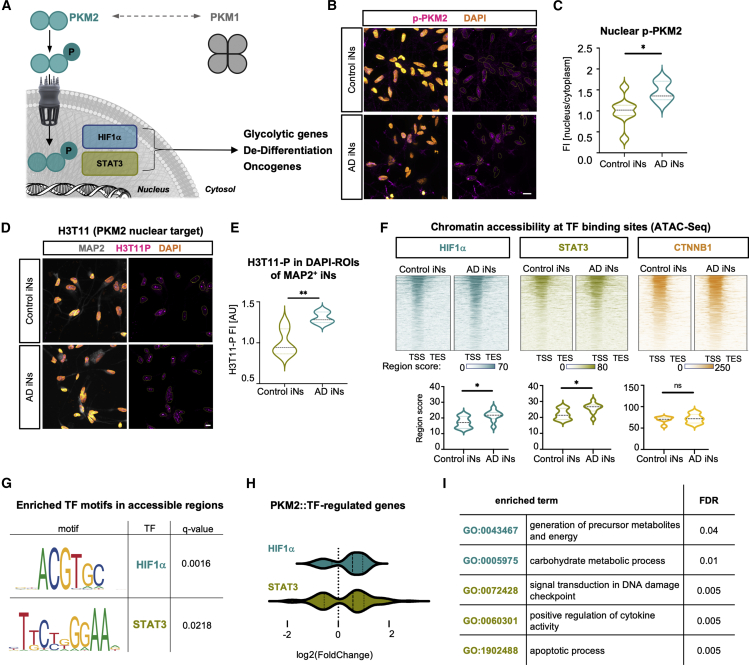
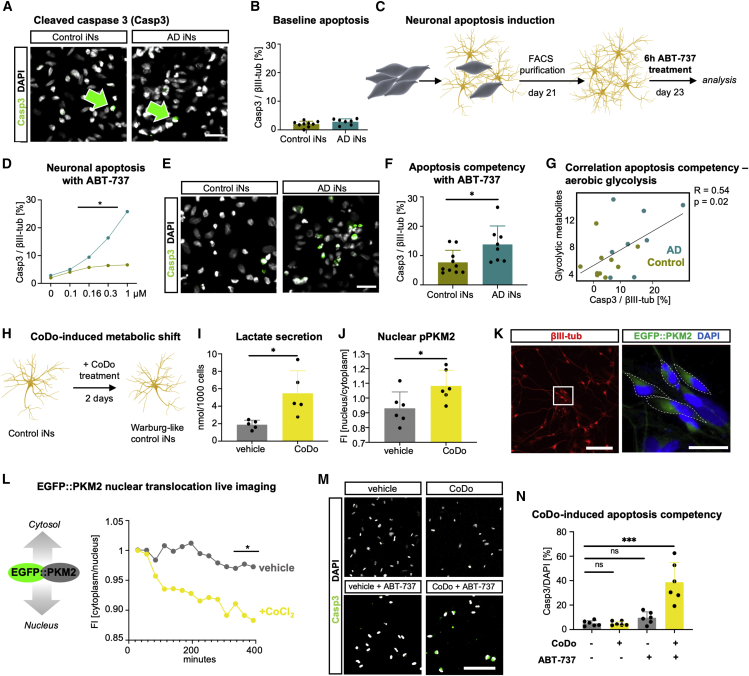
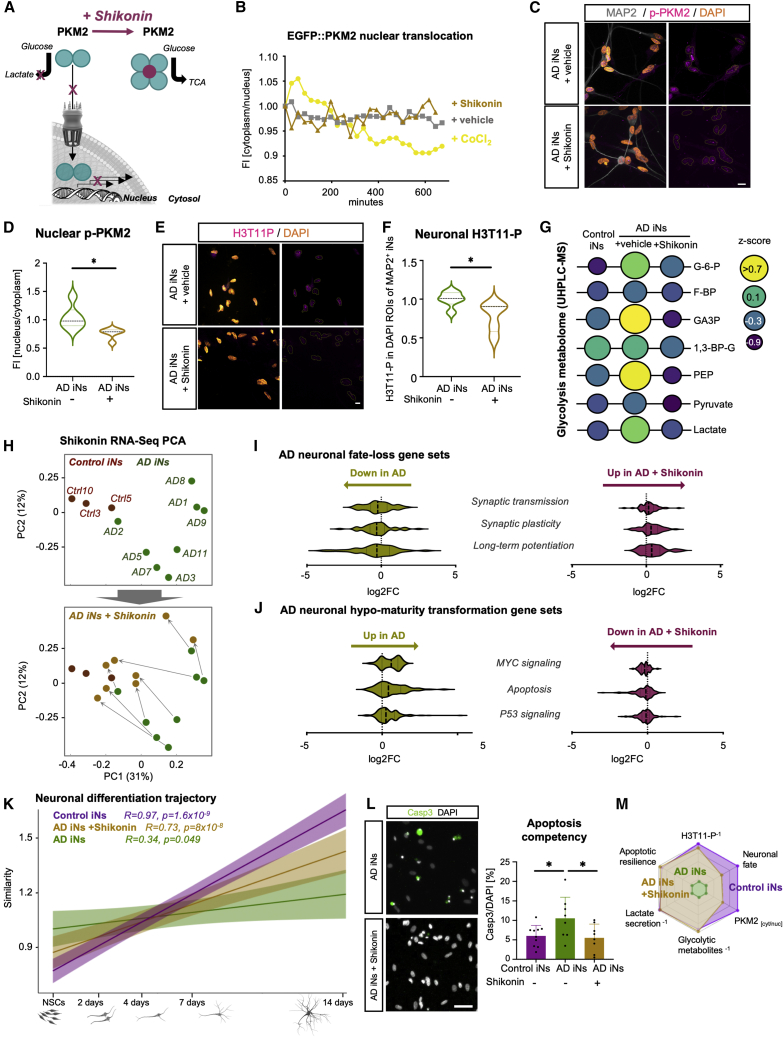
The drivers of sporadic Alzheimer's disease (AD) remain incompletely understood. Utilizing directly converted induced neurons (iNs) from AD-patient-derived fibroblasts, we identified a metabolic switch to aerobic glycolysis in AD iNs. Pathological isoform switching of the glycolytic enzyme pyruvate kinase M (PKM) toward the cancer-associated PKM2 isoform conferred metabolic and transcriptional changes in AD iNs. These alterations occurred via PKM2's lack of metabolic activity and via nuclear translocation and association with STAT3 and HIF1α to promote neuronal fate loss and vulnerability. Chemical modulation of PKM2 prevented nuclear translocation, restored a mature neuronal metabolism, reversed AD-specific gene expression changes, and re-activated neuronal resilience against cell death.

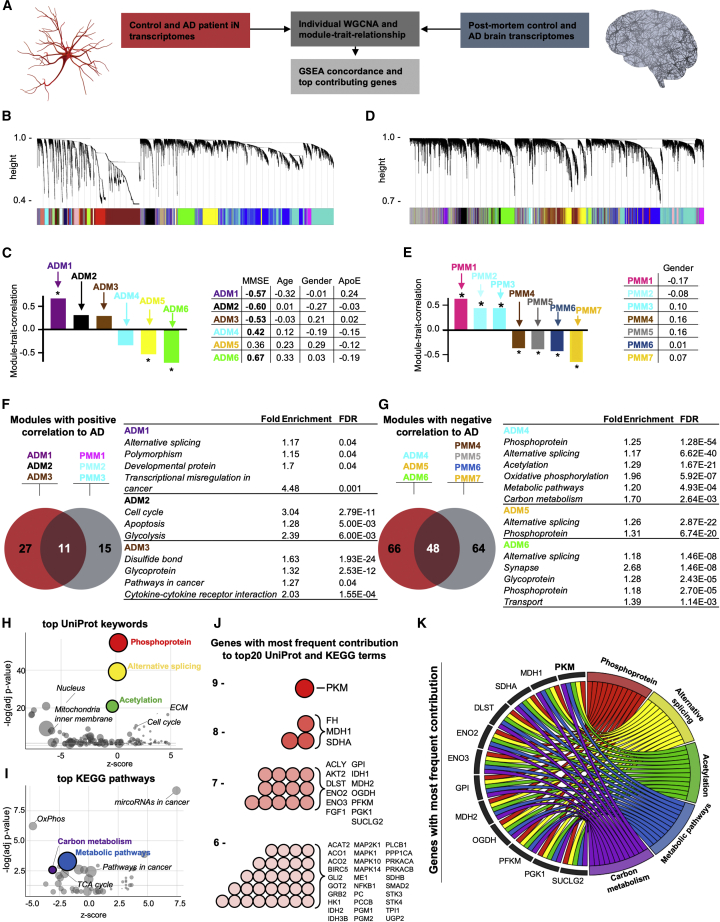
Keywords: Alzheimer's disease; WGCNA; Warburg effect; cancer; direct conversion; induced neurons; metabolomics; pyruvate kinase M; reprogramming.


Conflict of interest statement

Declaration of interests The authors declare no competing interests.

Figures

None
Graphical abstract
Figure 1
Figure 1
Generation of iNs from patient-derived fibroblasts (A and B) Schematic: generation of iNs from fibroblasts (A) and PSA-NCAM-based FACS purification (B). (C) Phase-contrast images of fibroblasts at day 0 (overconfluent) and at different stages of conversion. Scale bars, 10 μm. (D and E) Immunostainings of βIII-tub and NeuN (D) and quantification of βIII-tub and NeuN-positive cells (E) per DAPI (control, n = 7; AD, n = 5), showing median and quartiles. Significance: unpaired t test, p < 0.05 (E). (F) Representative voltage responses of iNs elicited by current step stimulation. Arrows indicate distinctive features associated with specific intrinsic membrane currents. Blue, inward rectification; red, Ca spike; olive, depolarizing voltage sag; green, rebound depolarization.
Figure 2
Figure 2
Gene expression network analysis of AD iNs and postmortem brain (A) WGCNA analysis of transcriptomes of control and AD iNs (E-MTAB-10344) and postmortem (PM) brain transcriptomes (GSE5281). (B and D) Cluster dendrograms representing groups of genes identified using WGCNA in iN (B) and PM (D) datasets with the assigned module colors. (C and E) Module-trait relationship of the significant modules correlating to AD and MMSE in iNs (ADMs, AD modules) (C) and modules correlating to AD in PM tissue (PMMs, postmortem modules) (E), with correlation values to MMSE, age, gender, and ApoE genotype. Asterisks and bold values represent significant (p < 0.05) values. (F and G) Enriched GO terms in modules significantly correlated positively (F) or negatively (G) to AD in cultured iNs and PM brain tissue, with the top common GO terms presented in the table. KEGG pathways are displayed in italic. (H and I) UniProt keywords (H) and KEGG pathways (I) according to their adjusted p value (y axis) and nonstatistical Z score calculated by GoPlot (x axis). The area of each circle represents the number of genes of that pathway. (J) Most abundant genes of top 10 UniProt keywords and top 10 KEGG pathways. (K) Chord plot showing the 17 genes that are present at least seven times in the 20 pathways and pathways that contain at least 14 of these genes.
Figure 3
Figure 3
PKM isoform switch in AD iNs and postmortem brain tissue (A) RNA-seq counts of PKM (control, n = 9; AD, n = 9). (B) Schematic: PKM regulation by alternative splicing. (C) RNA-seq reads mapped to exons 9 and 10 of the PKM. (D) Bar plot representing exon 10/9 ratios (control, n = 9; AD, n = 9). (E–H) Analysis of ROSMAP bulk transcriptomic dataset (n = 633), divided based on Braak stages (one-way ANOVA, Dunnett’s multiple comparison test, compared with Braak 0, DF 632; PKM1, F = 4.28, p = 0.0003; PKM2, F = 0.84, p = 0.53) or diagnosis after death (Mann-Whitney test). (I and J) Immunostaining of prefrontal cortex of human postmortem brain tissue (control, n = 10; AD, n = 9). Scale bars, 1,000 μm in (I) and 500 and 100 μm in (J). Total PKM2 measured in neuron-rich outer layers (Mann-Whitney test) and in NeuN-ROIs compared with perinuclear regions. (K) Immunostaining and quantification of total PKM2 in MAP2-ROI in control (n = 5) and AD (n = 7) iNs (two independent experiments per donor; shape represents the donor). Scale bars, 10 µm. (A–D and H–N) Bars, mean; error bars, SD; significance, unpaired t test unless otherwise indicated, p < 0.05, ∗∗p < 0.01, ∗∗∗p < 0.001, ∗∗∗∗p < 0.0001.
Figure 4
Figure 4
Metabolome reveals Warburg-like metabolic switch in AD iNs (A) Colorimetric assay to determine PKM activity in control (n = 7) and AD (n = 6) iNs (Mann-Whitney test). (B) Colorimetric assay to detect secreted lactate in the supernatant of control (n = 9) and AD (n = 10) iNs. (C) Density plot of PC7 of 160 metabolites measured by UHPLC-MS of control (n = 10) and AD (n = 10) iNs. (D) Integrative transcriptomics and metabolomics (IMPaLa) analysis showing over-represented pathways including gene and metabolites rich factors. (E) UHPLC-MS metabolic landscape in control (left; n = 10) and AD (right; n = 10) iNs. Circles represent Z scores of respective metabolites. Size and color of the font indicate the RNA-seq expression levels of related enzymes. (F) Glucose consumption measured as the drop of extracellular glucose after 6 h in culture. (G) Combined averages of all detected glycolytic metabolites in iNs. (H and I) Tracing of isotope-labeled glucose after 6-h incubation with 13C6-glucose. Fraction of labeled glucose detected in lactate and citrate (n = 10 per group). Dots represent individual donors throughout the figure. Bars, mean; error bars, SD; violin plots, median and quartiles. Significance: unpaired t test, p < 0.05, ∗∗p<0.01.
Figure 5
Figure 5
Nuclear PKM2 activity alters the neuronal epigenetic landscape (A) Schematic: phosphorylated PKM2 translocates to the nucleus to interact with transcription factors to regulate gene expression. (B and C) Immunostaining (B) and quantification (C) of p-PKM2(Ser37) (control, n = 8; AD, n = 5). Scale bars, 10 μm. (D and E) Immunostaining (D) and quantification (E) of phosphorylated histone 3 (T11) of MAP2-positive neurons (control, n = 6; AD, n = 5). Scale bars, 10 μm. (F) ATAC-seq profiles around transcriptional start sites of genes regulated by HIF1α, STAT3, and β-catenin (CTNNB1), based on ReMap2020 (control, n = 11; AD, n = 9). (G) HOMER motif enrichment analysis of AD differentially open peaks for HIF1α and STAT3, as previously published (Mertens et al., 2021). (H and I) Differential expression (H) and GO term enrichment (I) of significant genes regulated by HIF1α or STAT3. (B–H) Violin plots: median and quartiles. Significance: unpaired t test, p < 0.05, ∗∗p < 0.01.
Figure 6
Figure 6
A metabolic shift induces AD-like apoptotic competency in human neurons (A and B) Immunostaining (A) and quantification (B) of cleaved caspase-3 over DAPI of βIII-tub-positive control and AD iNs (control, n = 9; AD, n = 7). Scale bars, 50 μm. Green arrows point out Casp3-positive neurons. (C) Schematic: induction of neuronal apoptosis by ABT-737 treatment. (D) Cell death assessed by cleaved caspase 3/βIII-tub-positive cells of control (green) and AD (teal) iNs in response to 0–1 μM ABT-737. (E and F) Immunostaining (E) and quantification (F) of cleaved caspase-3 in βIII-tub neurons after Bcl2 inhibition in control (n = 10) and AD (n = 8) iNs. Scale bars, 50 μm. (G) Pearson correlation analysis of cleaved caspase-3 immunostaining and glycolytic metabolites (UHPLC-MS). (H and I) Control iNs treated with CoDo for 2 days (H) showed increased lactate secretion (vehicle, n = 5; CoDo, n = 5) (I). (J) Quantification of p-PKM2 FI in the nucleus/cytoplasm comparing vehicle-treated (n = 6) and CoDo-treated control iNs (n = 6). (K) Immunostainings of βIII-tub and EGFP fluorescence of EGFP::PKM2 transduced iNs. Dotted lines show cytoplasmic ROI. Scale bars, 100 and 25 μm. (L) Longitudinal EGFP::PKM2 localization in vehicle-treated (n = 3) or CoCl2-treated (n = 4) control iNs. (M and N) Immunostaining (M) and quantification (N) of cleaved caspase-3 positive cells/DAPI before and after ABT-737 (vehicle and CoDo, n = 6; one-way ANOVA, DF: 23, F = 21.34, p < 0.0001, Dunnett’s multiple comparison). Scale bars, 50 μm. Dots represent individual donors throughout the figure. Bars, mean; error bars, SD; significance, unpaired t test, p < 0.05, ∗∗p < 0.01, ∗∗∗p < 0.001.
Figure 7
Figure 7
PKM2 inhibition ameliorates PKM2-induced apoptotic competency (A) Schematic: shikonin treatment prevents PKM2 nuclear translocation and increases metabolic enzymatic activity. (B) Longitudinal EGFP::PKM2 localization in vehicle-treated (n = 3), CoCl2-treated (n = 4), and CoCl2+shikonin-treated (n = 4) control iNs. (C–F) Immunostaining and quantification of nuclear p-PKM2 (C and D) and H3T11-P (E and F) in AD iNs with and without shikonin (vehicle, n = 6; shikonin, n = 5). Scale bars, 10 μm. (G) Glycolytic metabolites measured by UHPLC-MS-based metabolomics. Size and color of the circles are indicative of abundance (control, n = 3; AD, n = 4; AD-shikonin, n = 4). (H) PCA-based bulk RNA-seq (control, n = 3; AD and AD-S, n = 8). (I and J) Transcriptomic analysis of AD neuronal fate-loss gene sets (I) and hypo-maturity gene sets (J) in control (n = 3), AD (n = 8), and AD + shikonin iNs (n = 8) after 10 days of treatment. (K) Similarity profiles of control, AD, AD + shikonin iNs to neuronal differentiation trajectory of neural stem cells to neurons (Schafer et al., 2019). (L) Quantification of immunostainings for cleaved caspase-3/DAPI in control (n = 9), AD (n = 8), and shikonin-treated AD (n = 8) iNs (one-way ANOVA, DF: 25, F = 4.027, p = 0.03). Scale bars, 50 µm. (M) Radar plot of described phenotype and rescue with shikonin. (D–L) Dots represent individual donors throughout the figure. Bars, mean; error bars, SD; violin plots, median and quartiles. Significance: unpaired t test, p < 0.05.

Comment in

References

    1. Afridi R., Kim J.-H., Rahman M.H., Suk K. Metabolic regulation of glial phenotypes: implications in neuron-glia interactions and neurological disorders. Front. Cell. Neurosci. 2020;14:20. doi: 10.3389/fncel.2020.00020. - DOI - PMC - PubMed
    1. Alves-Filho J.C., Pålsson-McDermott E.M. Pyruvate kinase M2: a potential target for regulating inflammation. Front. Immunol. 2016;7:145. doi: 10.3389/fimmu.2016.00145. - DOI - PMC - PubMed
    1. Arendt T. Cell cycle activation and aneuploid neurons in Alzheimer’s disease. Mol. Neurobiol. 2012;46:125–135. doi: 10.1007/s12035-012-8262-0. - DOI - PubMed
    1. Arendt T., Holzer M., Stöbe A., Gärtner U., Lüth H.J., Brückner M.K., Ueberham U. Activated mitogenic signaling induces a process of dedifferentiation in Alzheimer’s disease that eventually results in cell death. Ann. N. Y. Acad. Sci. 2000;920:249–255. doi: 10.1111/j.1749-6632.2000.tb06931.x. - DOI - PubMed
    1. Bai B., Wang X., Li Y., Chen P.-C., Yu K., Dey K.K., Yarbro J.M., Han X., Lutz B.M., Rao S., et al. Deep multilayer brain proteomics identifies molecular networks in Alzheimer’s disease progression. Neuron. 2020;105:975–991.e7. doi: 10.1016/j.neuron.2019.12.015. - DOI - PMC - PubMed

Publication types