. 2022 Oct 5;110(19):3121-3138.e8.
doi: 10.1016/j.neuron.2022.07.020. Epub 2022 Aug 19.

Enhanced excitability of the hippocampal CA2 region and its contribution to seizure activity in a mouse model of temporal lobe epilepsy

Affiliations

Enhanced excitability of the hippocampal CA2 region and its contribution to seizure activity in a mouse model of temporal lobe epilepsy

Alexander C Whitebirch et al. Neuron. .

Abstract

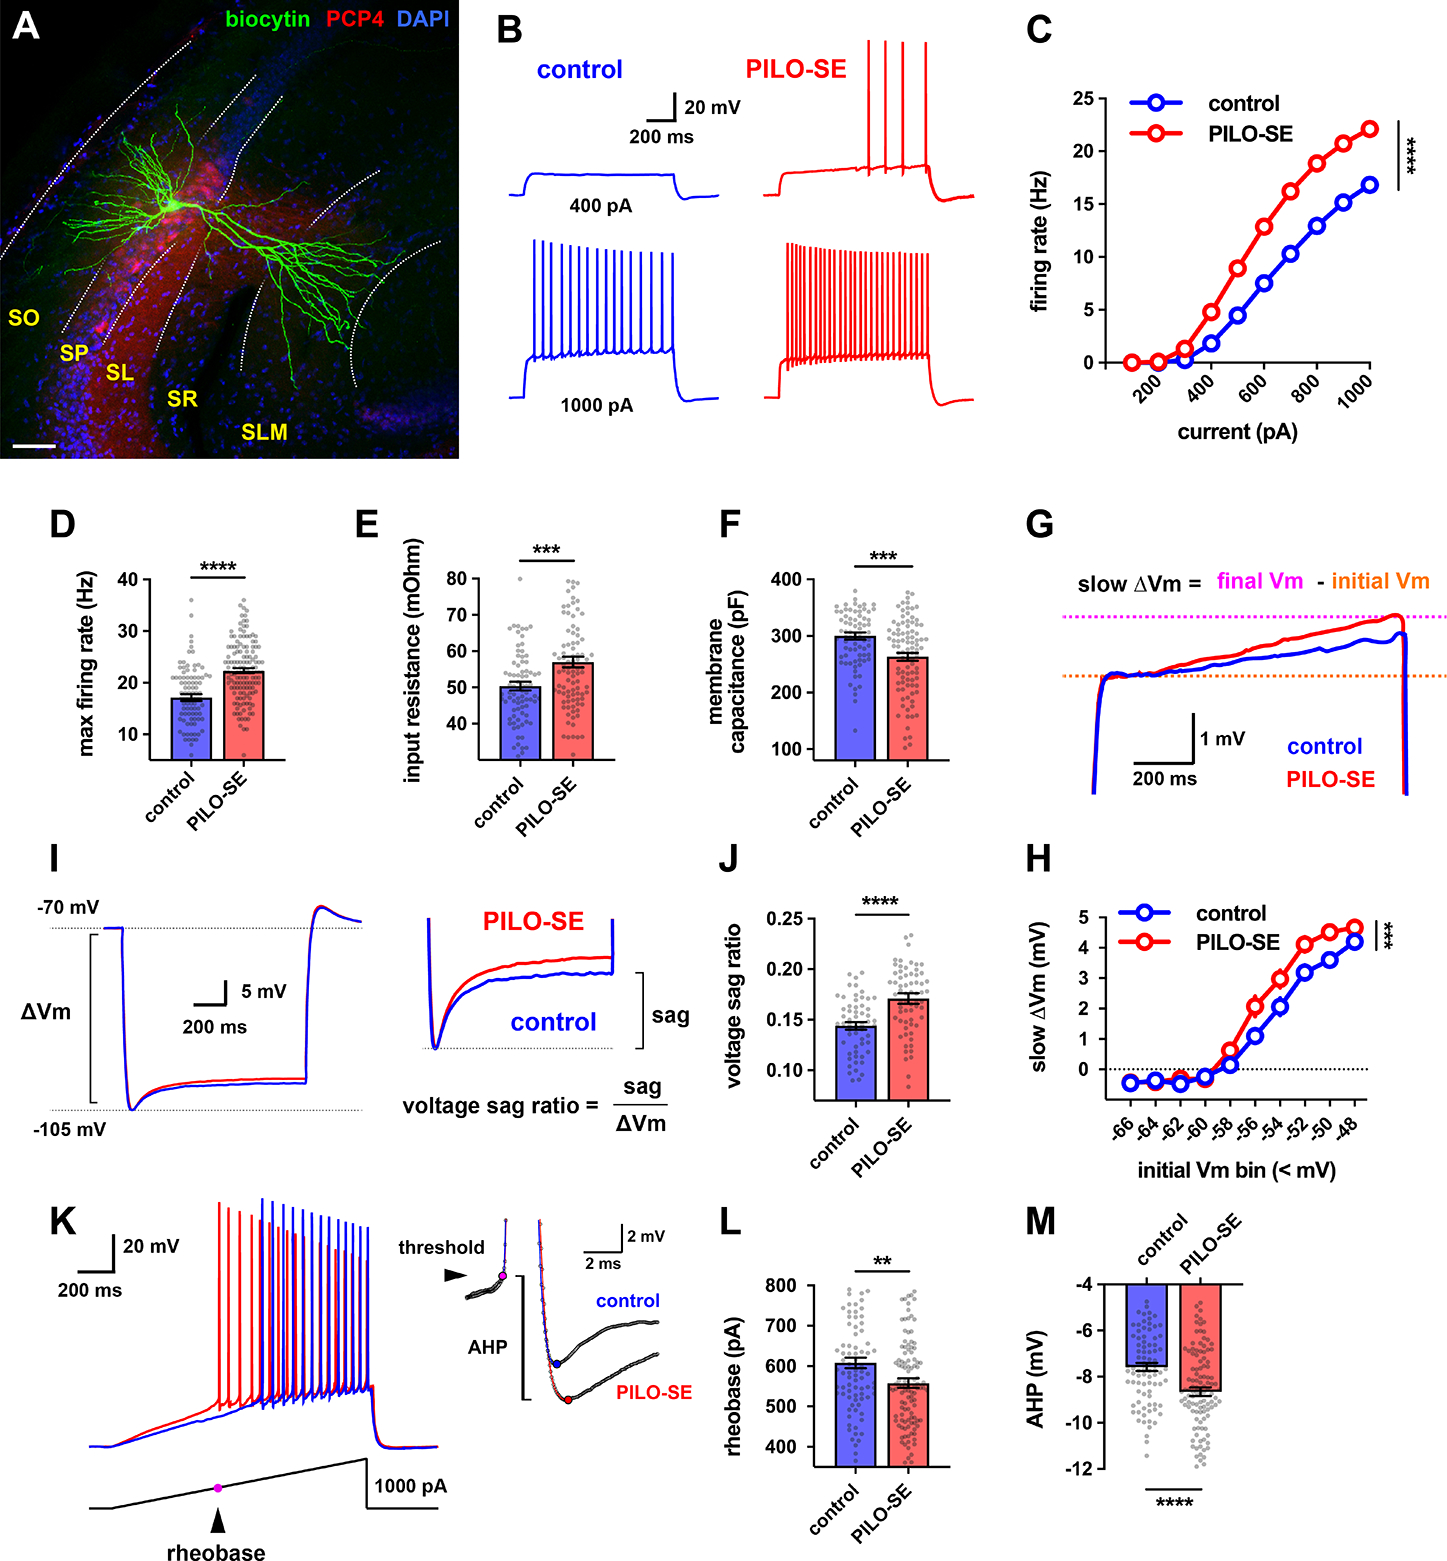
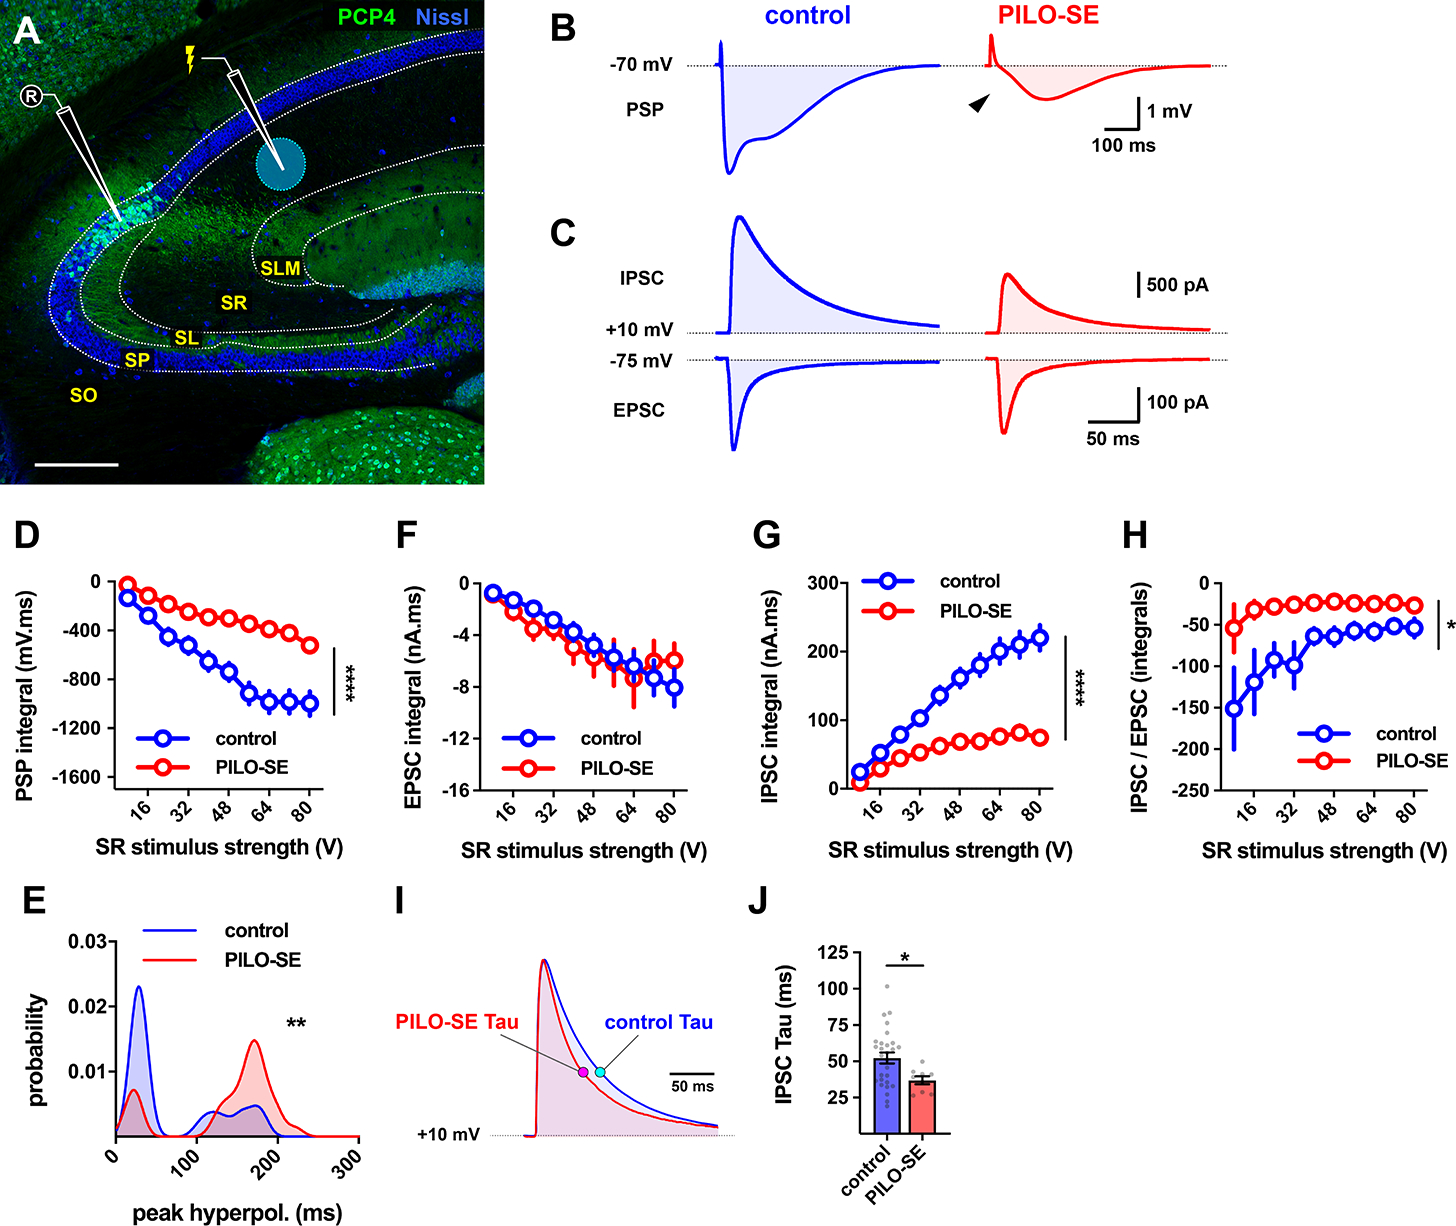
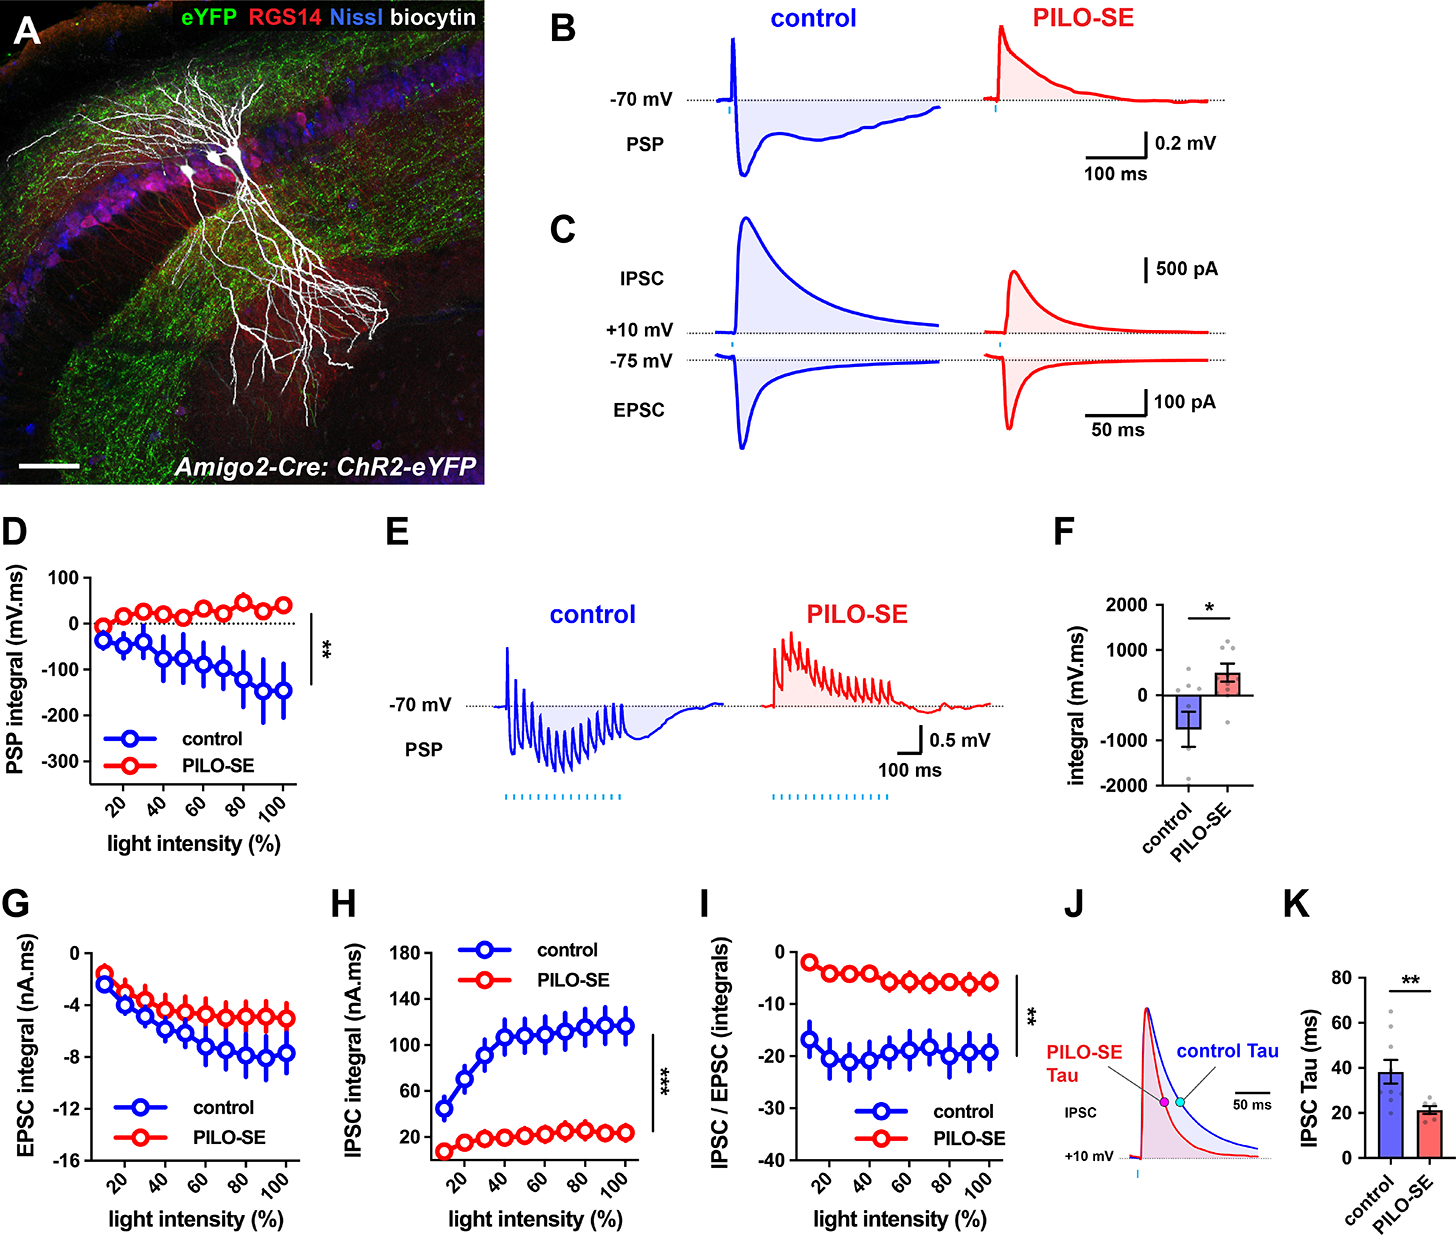
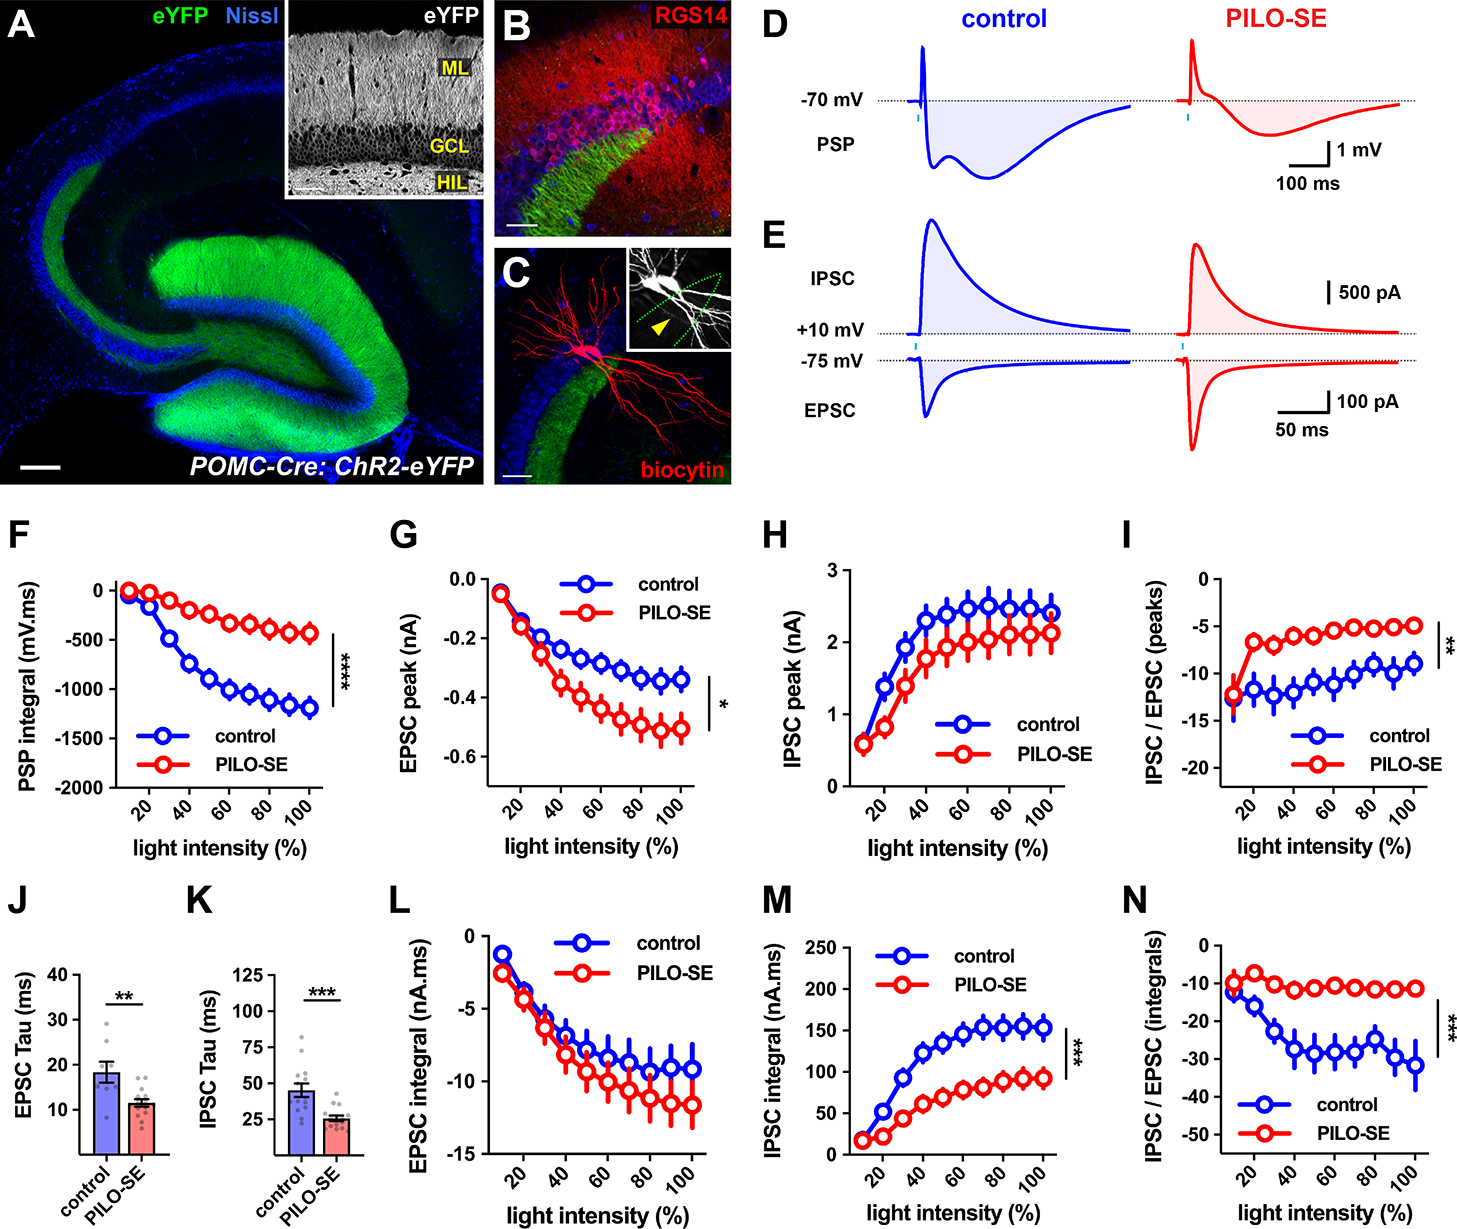
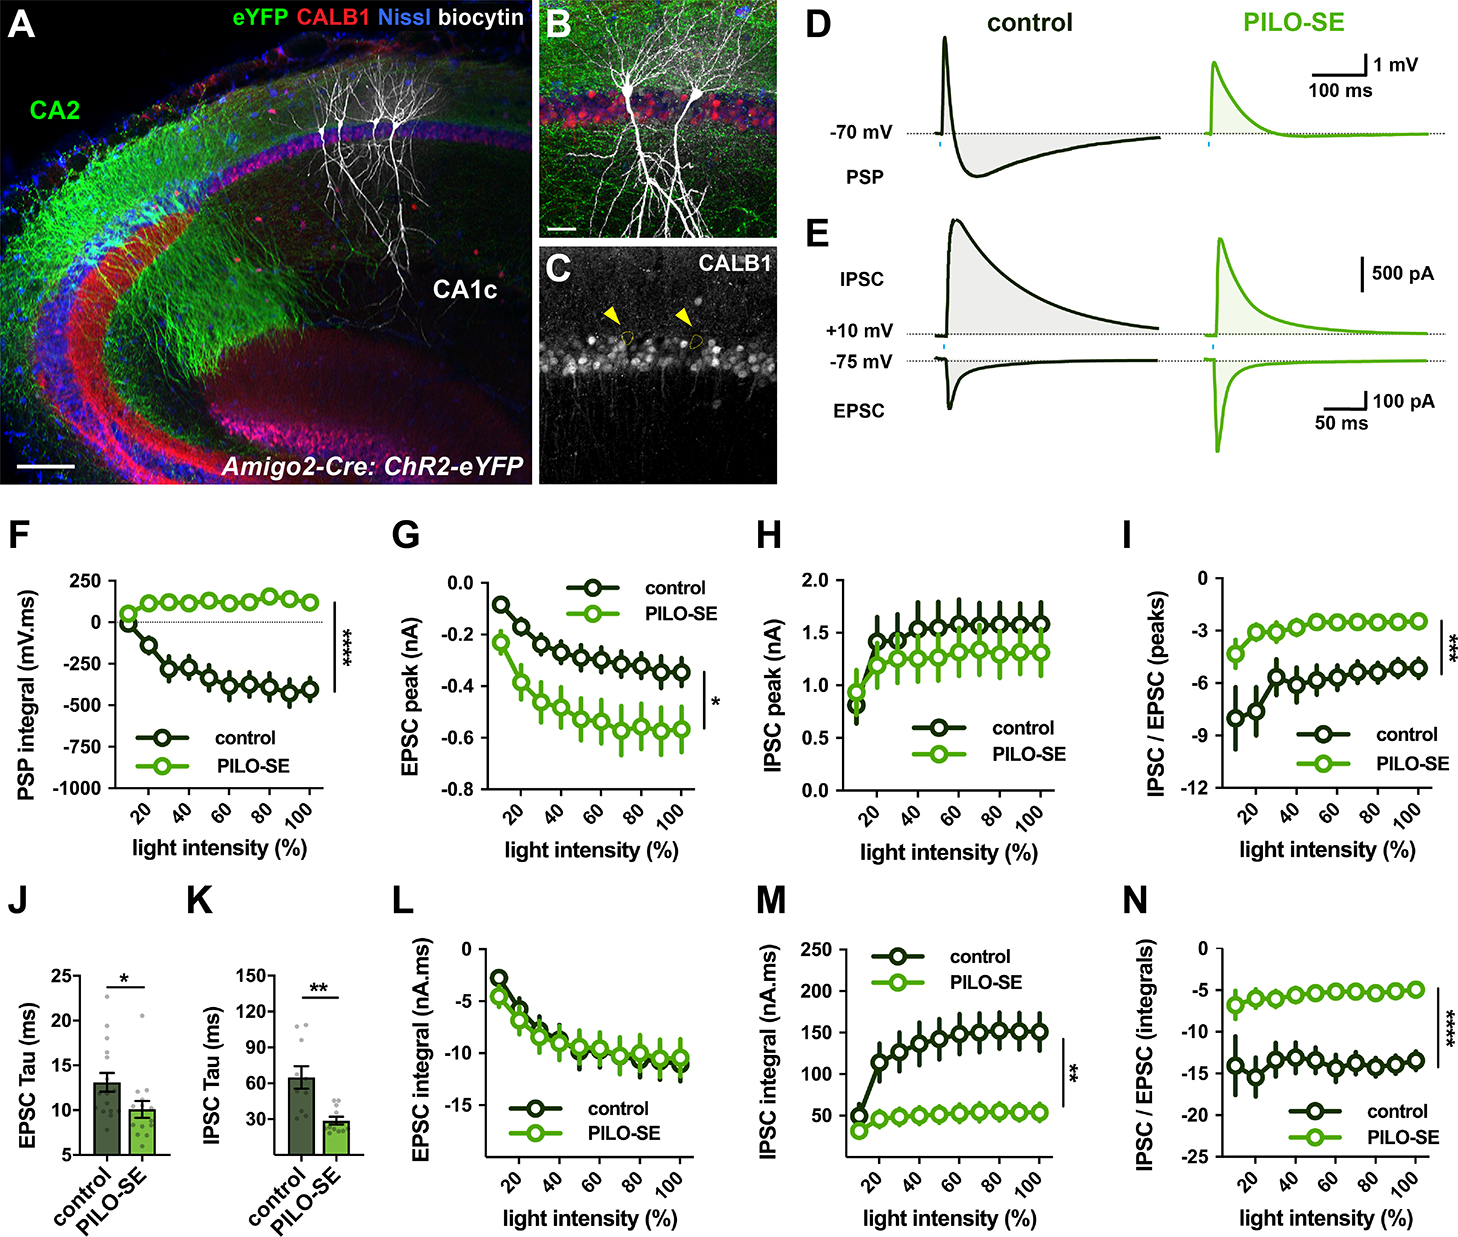
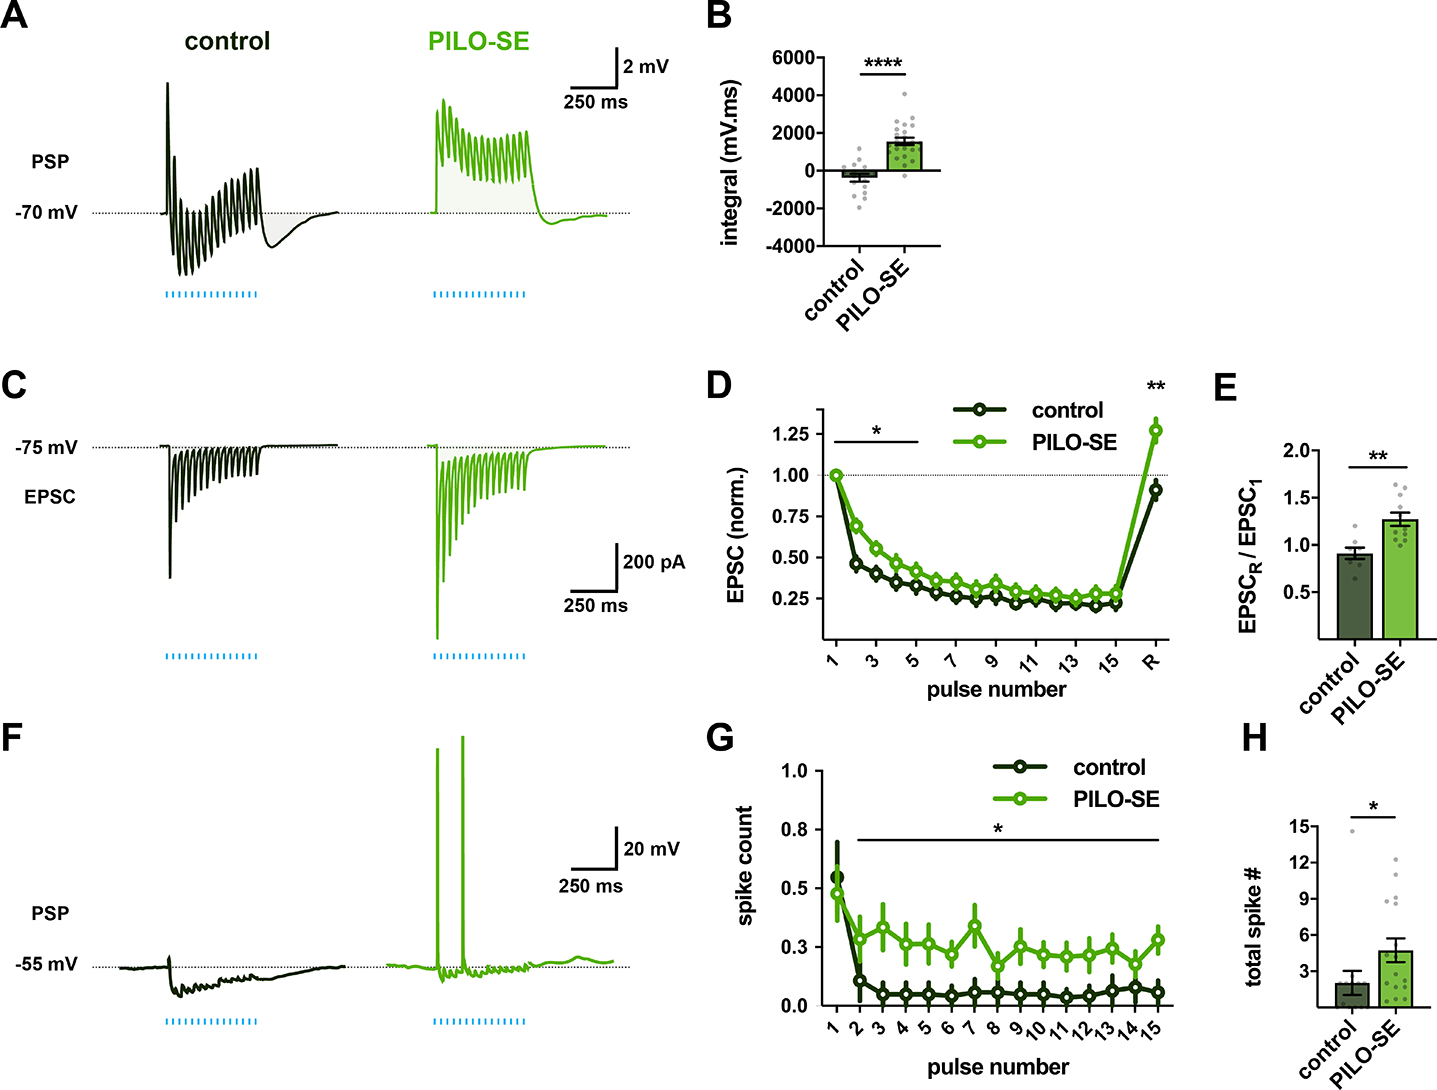
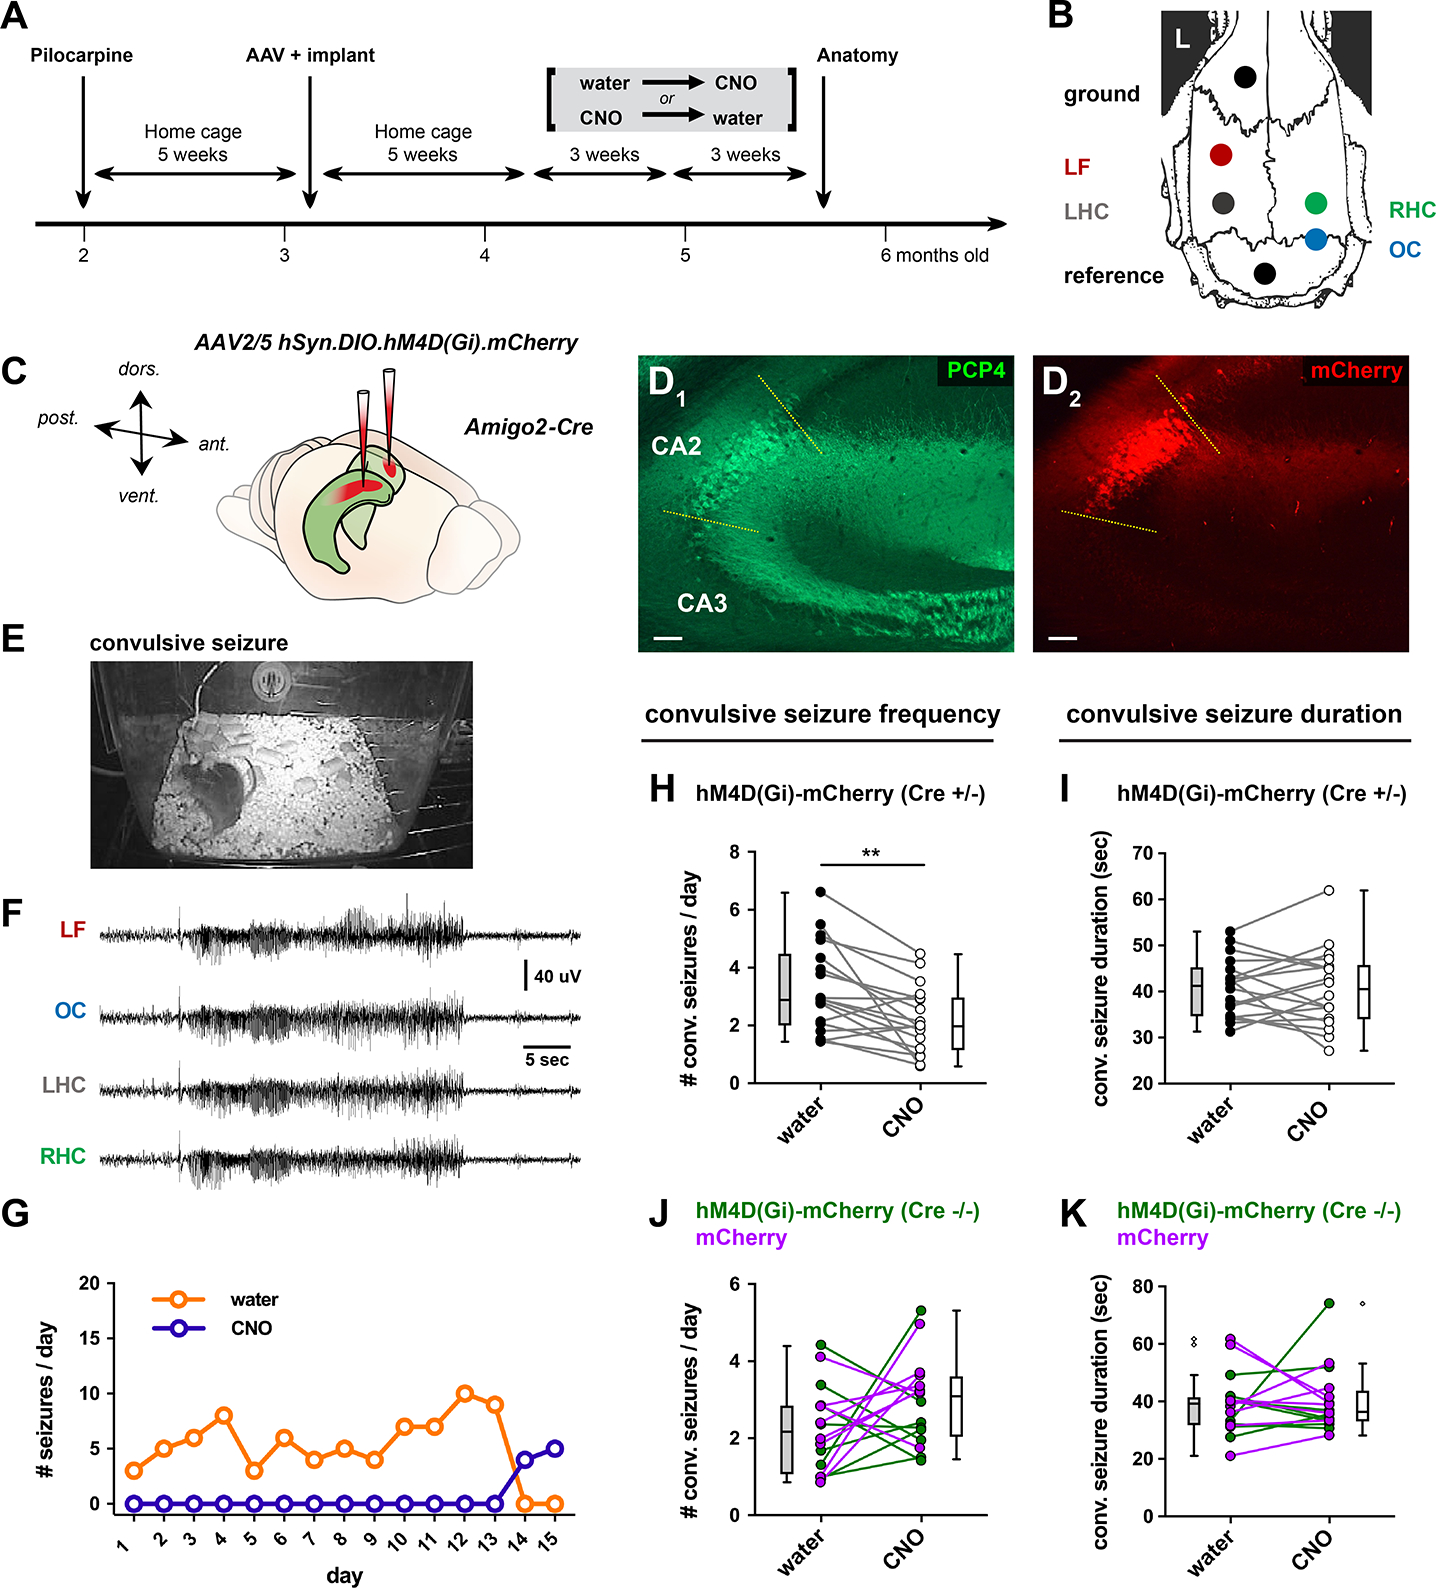
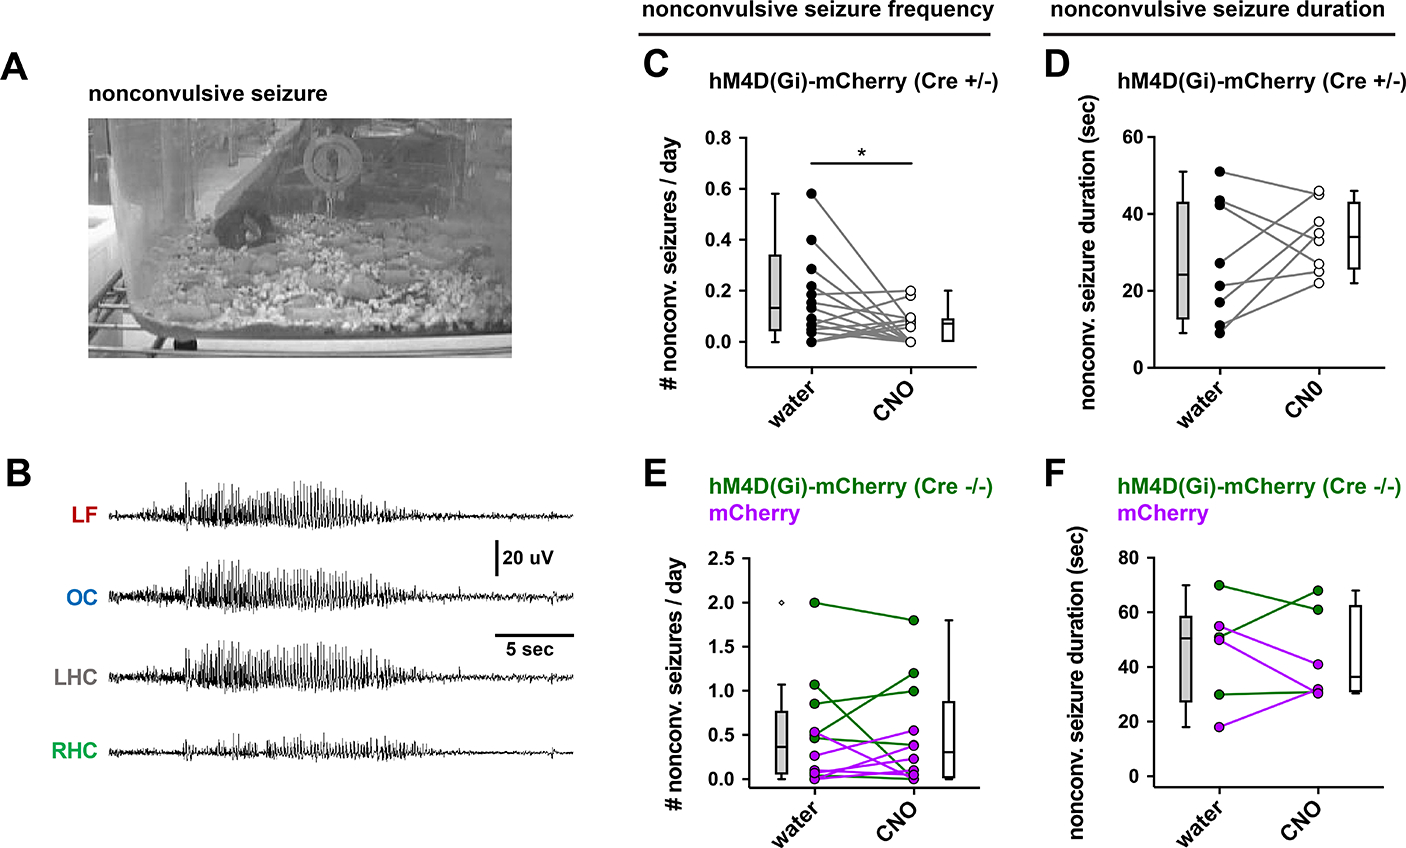
The hippocampal CA2 region, an area important for social memory, has been suspected to play a role in temporal lobe epilepsy (TLE) because of its resistance to degeneration observed in neighboring CA1 and CA3 regions in both humans and rodent models of TLE. However, little is known about whether alterations in CA2 properties promote seizure generation or propagation. Here, we addressed the role of CA2 using the pilocarpine-induced status epilepticus model of TLE. Ex vivo electrophysiological recordings from acute hippocampal slices revealed a set of coordinated changes that enhance CA2 PC intrinsic excitability, reduce CA2 inhibitory input, and increase CA2 excitatory output to its major CA1 synaptic target. Moreover, selective chemogenetic silencing of CA2 pyramidal cells caused a significant decrease in the frequency of spontaneous seizures measured in vivo. These findings provide the first evidence that CA2 actively contributes to TLE seizure activity and may thus be a promising therapeutic target.

Keywords: CA2; designer receptors activated by designer drugs; electroencephalogram; epilepsy; hippocampus; hyperexcitability; inhibitory-excitatory balance; optogenetics; slice electrophysiology; status epilepticus.


Conflict of interest statement

Declaration of interests The authors declare no competing interests.

Figures

Figure 1.
Figure 1.. CA2 pyramidal cells (PCs) in slices from pilocarpine-treated mice had increased intrinsic excitability.
(A) A representative hippocampal slice stained for Nissl (blue) and PCP4, which labels CA2 PCs (red), with a single CA2 PC filled with intracellular biocytin (green). The hippocampal layers in this and all subsequent images are labeled as follows: stratum oriens (SO), stratum pyramidale (SP), stratum lucidum (SL), stratum radiatum (SR), stratum lacunosum moleculare (SLM). Scale bar, 60 μm. (B) Representative traces of membrane depolarization and action potential firing patterns in control (blue) and PILO-SE (red) CA2 PCs in response to a 1 second current step. (C) CA2 PCs in slices from PILO-SE mice fire a greater number of action potentials in response to depolarizing current steps. (D) The maximum firing rate was increased in CA2 PCs from PILO-SE mice. (E) Input resistance was increased in CA2 PCs from PILO-SE mice. (F) Membrane capacitance was reduced in CA2 PCs from PILO-SE mice. (G) Representative averaged traces of the slow ramping depolarization exhibited by CA2 PCs near action potential threshold. (H) Cells in slices from PILO-SE mice exhibited a larger slow depolarization. (I) Representative averaged traces from control and PILO-SE CA2 PCs showing hyperpolarization-induced membrane voltage sag. (J) The voltage sag ratio was greater in CA2 PCs from PILO-SE mice. (K) Representative membrane voltage responses from control (blue) and PILO-SE (red) CA2 PCs to a ramp of applied current. (L) The rheobase current was reduced in CA2 PCs from PILO-SE mice. (M) The amplitude of the AHP was significantly increased in CA2 PCs from PILO-SE mice. See also Supplemental Table 1.
Figure 2.
Figure 2.. Inhibition of CA2 PCs recruited by stimulation of CA2/CA3 axons was diminished in slices from PILO-SE mice.
(A) Representative hippocampal section stained for Nissl (blue) and PCP4 (green) to illustrate the configuration used to measure synaptic input to CA2 PCs from the CA2/3 local collaterals in the SR. Scale bar is 250 μm. (B) Representative averaged PSPs from control and PILO-SE CA2 PCs in response to SR stimulation. (C) Top, representative averaged SR-evoked IPSCs in voltage clamp configuration (with intracellular Cs+) from CA2 PCs voltage-clamped at +10 mV. Below, SR-evoked EPSC from CA2 PCs voltage-clamped at −75 mV. (D) The integral of the SR-evoked postsynaptic potential was significantly less negative in CA2 PCs from PILO-SE mice. (E) Probability density functions constructed from the measured latencies between stimulation and the peak hyperpolarization of SR-evoked PSPs. (F - H) Input-output curves of the integral of the SR-evoked EPSC (F), the integral of the SR-evoked IPSC (G), and the ratio between the integrals of the IPSC and EPSC (H). (I) Representative averaged traces illustrating the time course of SR-evoked IPSCs with the exponential time constant of decay, tau, indicated for the currents from cells from control and PILO-SE mice. (J) The time constant of the SR-evoked IPSC was faster in CA2 PCs from PILO-SE mice. See also Figure S2.
Figure 3.
Figure 3.. The inhibitory-excitatory balance of the CA2 → CA2 recurrent circuit was reduced in slices from PILO-SE.
(A) Biocytin-filled CA2 PCs (white) in a slice from intermediate hippocampus, with ChR2-eYFP-expressing CA2 PC axons (green) visible in SO and SR. CA2 PCs were labeled for RGS14 (red) and neuronal somata were visualized with Nissl stain (blue). Scale bar, 80 μm. (B) Representative averaged light-evoked PSPs from CA2 PCs from control and PILO-SE mice. (C) Representative averaged light-evoked EPSCs and IPSCs from control and PILO-SE CA2 PCs. (D) The integral of the light-evoked PSP was significantly more positive in CA2 PCs from PILO-SE mice. (E) Representative averaged PSPs evoked by 15 pulses of light delivered at 30 Hz in cells from control and PILO-SE mice. (F) The integral of the train-evoked PSP is significantly more positive in cells from PILO-SE mice. (G - I) Input-output curves of the integral of the light-evoked EPSC, the integral of the light-evoked IPSC, and the ratio of the integrals of the light-evoked IPSC and EPSC. (J) Representative averaged light-evoked IPSCs from CA2 PCs with the time constant indicated with magenta and cyan markers on the control and PILO-SE currents, respectively. (K) The time constant of the light-evoked IPSC was significantly shorter in cells from PILO-SE mice. See also Figure S2.
Figure 4.
Figure 4.. The inhibitory-excitatory balance of the dentate gyrus granule cell mossy fiber pathway to CA2 was reduced after PILO-SE.
(A) A representative section from a POMC-Cre mouse expressing ChR2-eYFP (green) in DG granule cells, with neuronal somata stained for Nissl substance (blue). Scale bar is 200 μm. Inset, ChR2-eYFP expression in the granule cell layer (GCL), the apical dendrites in the molecular layer (ML), and the mossy fiber axons in the hilus (HIL). Scale bar, 60 μm. (B) The CA2 region (defined by RSG14, red) straddles the end of the mossy fiber projection (Dudek, Alexander, & Farris, 2016). Scale bar, 60 μm. (C) Two CA2 PCs (filled with biocytin, red) showing a lack of thorny excrescences (inset, arrowhead, biocytin, white). Scale bar, 80 μm. (D) Representative averaged light-evoked PSPs in CA2 PCs from control and PILO-SE mice. (E) Representative averaged light-evoked EPSCs and IPSCs in cells from control and PILO-SE mice. (F) The input-output curve of the integral of the light-evoked PSP in CA2 from control and PILO-SE mice. (G - I) Input-output curves of the peak amplitude of the light-evoked EPSC in CA2 PCs, the peak amplitude of the light-evoked IPSC, and the ratio of the peak amplitudes of the light-evoked IPSC and EPSC. (J, K) The time constants (tau) of the light-evoked EPSC and IPSC were shorter in cells from PILO-SE mice. (L - N) Input-output curves of the integral of the light-evoked EPSC, the integral of the light-evoked IPSC, and the ratio between the integrals of the light-evoked IPSC and the EPSC. See also Figure S5 and Figure S6.
Figure 5.
Figure 5.. PILO-SE strengthened CA2 excitation of CA1.
(A - C) A hippocampal slice with biocytin-filled CA1c PCs (white) located in the deep sublayer of SP, adjacent to SO. ChR2-eYFP-expressing CA2 PC dendrites and axonal projections (green) visible throughout SR and SO. Neuronal somata labeled with Nissl stain (blue); Calbindin-1 stain (CALB1, red) delineates superficial CA1 PCs (Lee et al., 2014). Scale bars, 150 μm in A and 40 μm in B. (D) Representative averaged light-evoked PSPs from deep CA1c PCs in slices from control (left, dark green) and PILO-SE (right, bright green) mice. (E) Representative averaged light-evoked EPSCs and IPSCs from control and PILO-SE CA1c PCs. (F) The integral of the light-evoked PSP was significantly more positive in CA1 PCs from PILO-SE mice. (G - I) Input-output curves of the light-evoked EPSC amplitude, IPSC amplitude, and the ratio of the IPSC and EPSC peak amplitudes. (J, K) The time constants of the light-evoked EPSC and IPSC were significantly shorter in cells from PILO-SE mice. (L - N) Input-output curves of the integral of the light-evoked EPSC, the integral of the IPSC, and the ratio of the IPSC and EPSC integrals.
Figure 6.
Figure 6.. PILO-SE enhanced the ability of CA2 PCs to drive action potential output from CA1 PCs.
(A) Representative averaged PSPs from control and PILO-SE mice evoked by 15 lights pulses delivered at a frequency of 30 Hz for 500 ms. (B) The integral of the train-evoked PSP was significantly larger in deep CA1c PCs from PILO-SE mice. (C) Representative averaged EPSCs evoked by 15 light pulses delivered at a frequency of 30 Hz (blue lines) across 500 ms, recorded from control (dark green) and PILO-SE (bright green) PCs. (D) Normalized EPSC amplitudes evoked by a train of photostimulation, with 15 pulses delivered at 30 Hz, followed after 500 ms by a single recovery pulse. (E) The normalized amplitude of the recovery pulse EPSC was larger in cells from PILO-SE mice than in controls. (F) Representative photostimulation train-evoked PSPs from CA1 PCs held at an initial potential of −55 mV. (G) The mean number of action potentials evoked following the first pulse of the photostimulation train was increased in PILO-SE mice. (H) The mean total number of action potentials evoked by the 30 Hz photostimulation protocol was significantly increased in PCs from PILO-SE mice.
Figure 7.
Figure 7.. Chemogenetic silencing of CA2 reduced convulsive seizure frequency.
(A) Timeline of experiments. 5 weeks after PILO-SE, Cre-dependent AAV expressing hM4Di-mCherry or mCherry alone were injected in CA2 of Amigo2-Cre mice or wild-type controls. EEG electrodes were implanted at same time. CNO was either present or absent from drinking water for 3-week periods of continuous video EEG recording. Order of CNO delivery was randomized. (B) Locations of electrodes for EEG. LF, left frontal; LHC, left hippocampus; RHC, right hippocampus; OC, occipital cortex. (C) Locations of bilateral AAV injections in dorsal CA2. (D) Representative immunohistochemistry micrographs for CA2 marker PCP4 (D1) and AAV-mediated expression of hM4D(Gi)-mCherry (D2). Scale bars, 100 μm. (E, F) Frame from the continuous video (E) and corresponding EEG (F) during a convulsive seizure in an Amigo2-Cre mouse injected with hM4D(Gi)-mCherry. (G) Daily seizure counts in one mouse expressing hM4D(Gi)-mCherry in CA2 during 15 days in the absence of CNO (orange) followed by 15 days with CNO in drinking water (purple). (H) Paired analysis of convulsive seizure frequency in the presence of CNO compared with the absence of CNO (water control) in the same Amigo2-Cre mice expressing hM4D(Gi)-mCherry in CA2. CNO reduced convulsive seizure frequency. (I) CNO did not alter convulsive seizure duration in Amigo2-Cre mice expressing hM4D(Gi)-mCherry in CA2 (paired t-test; t = 0.0804, df = 17; P = 0.9368; n = 18 mice). (J) CNO did not alter convulsive seizure frequency in two groups of control mice: Amigo2-Cre mice expressing mCherry in CA2 (magenta symbols and lines) and wild-type mice (Cre−/−) injected with AAV2/5 hSyn.DIO.hM4D(Gi).mCherry (paired t-test; t = 1.573, df = 15; P = 0.1366; n = 16 mice). (K) CNO did not alter convulsive seizure duration in control mice (paired t-test; t = 0.3446, df = 15; P = 0.7352; n = 16 mice). See also Figure S9.
Figure 8.
Figure 8.. CA2 silencing reduced nonconvulsive seizure frequency.
(A, B) A representative example of a nonconvulsive seizure in an Amigo2-Cre mouse expressing hM4D(Gi)-mCherry in CA2. Despite the absence of behavioral indicators (A), EEG revealed significant seizure activity in all electrodes (B). (C) CNO reduced nonconvulsive seizure frequency. (D) CNO did not alter seizure duration (paired t-test; t = 0.6743, df = 6; P = 0.5252; n = 8 mice). (E) CNO did not reduce nonconvulsive seizure frequency in two control groups of mice described in the previous figure (paired t-test; t = 0.1333, df = 11; P = 0.8963; n = 12 mice). (F) CNO did not reduce nonconvulsive seizure duration in control groups (paired t-test; t = 0.2927, df = 5; P = 0.7815; n = 6 mice).

Comment in

References

    1. Alexander GM, Brown LY, Farris S, Lustberg D, Pantazis C, Gloss B, ... Dudek SM (2018). CA2 neuronal activity controls hippocampal low gamma and ripple oscillations. ELife, 7, 1–25. 10.7554/eLife.38052 - DOI - PMC - PubMed
    1. Andrioli A, & Arellano JI (2007). Quantitative analysis of parvalbumin-immunoreactive cells in the human epileptic hippocampus. Neuroscience, 149, 131–143. 10.1016/j.neuroscience.2007.07.029 - DOI - PubMed
    1. Arnold EC, Mcmurray C, Gray R, & Johnston D (2019). Epilepsy-induced reduction in HCN channel expression contributes to an increased excitability in dorsal, but not ventral, hippocampal CA1 neurons. ENeuro, 6(April), 1–22. - PMC - PubMed
    1. Baud MO, Kleen JK, Mirro EA, Andrechak JC, King-Stephens D, Chang EF, & Rao VR (2018). Multi-day rhythms modulate seizure risk in epilepsy. Nature Communications, 9(1), 1–10. 10.1038/s41467-017-02577-y - DOI - PMC - PubMed
    1. Blümcke I, Thom M, Aronica E, Armstrong DD, Bartolomei F, Bernasconi A, ... Spreafico R (2013). International consensus classification of hippocampal sclerosis in temporal lobe epilepsy: A task force report from the ILAE commission on diagnostic methods. Epilepsia, 54(7), 1315–1329. 10.1111/epi.12220 - DOI - PubMed

Publication types

LinkOut - more resources