. 2023 Feb;112(2):247-257.
doi: 10.1007/s00392-022-02081-4. Epub 2022 Aug 20.

Genetic and modifiable risk factors combine multiplicatively in common disease

Affiliations

Genetic and modifiable risk factors combine multiplicatively in common disease

Shichao Pang et al. Clin Res Cardiol. 2023 Feb.

Abstract

Background: The joint contribution of genetic and environmental exposures to noncommunicable diseases is not well characterized.

Objectives: We modeled the cumulative effects of common risk alleles and their prevalence variations with classical risk factors.

Methods: We analyzed mathematically and statistically numbers and effect sizes of established risk alleles for coronary artery disease (CAD) and other conditions.

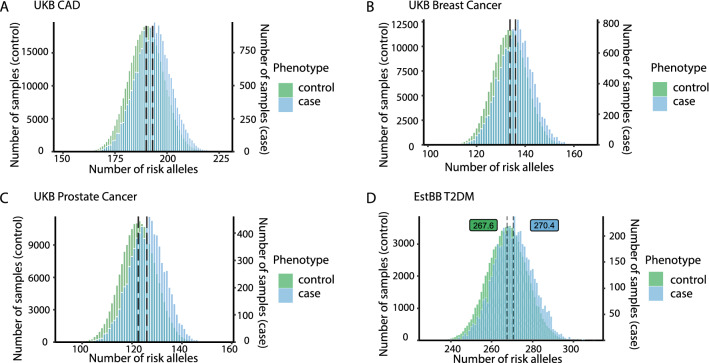
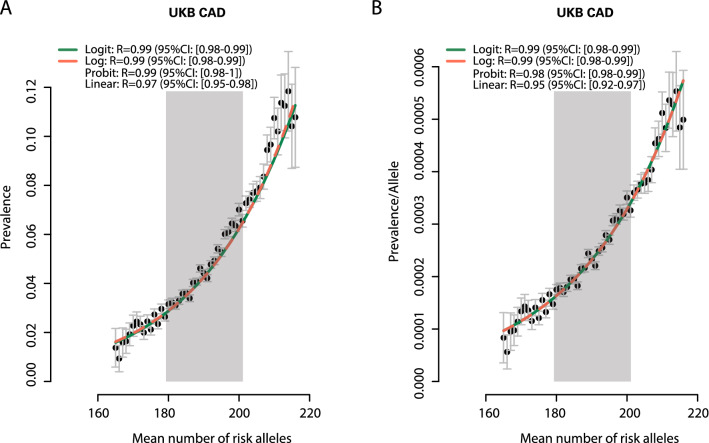
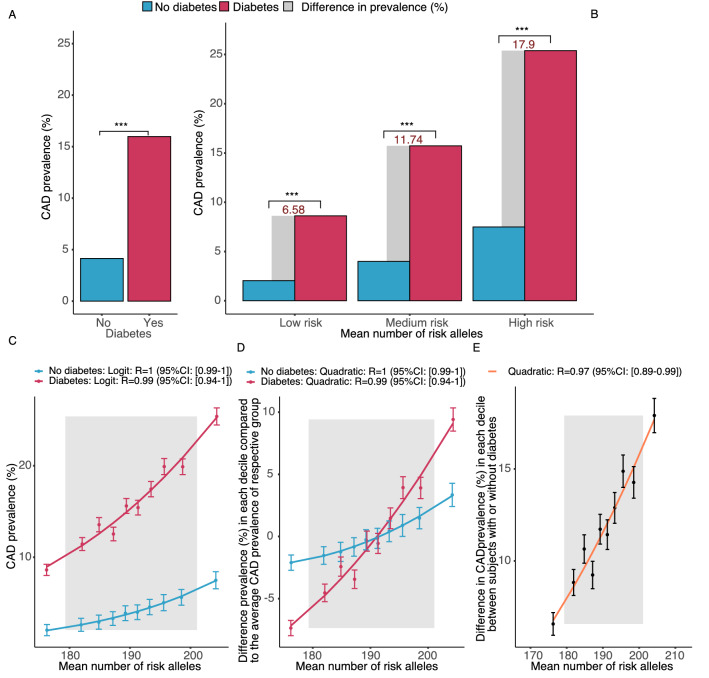
Results: In UK Biobank, risk alleles counts in the lowest (175.4) and highest decile (205.7) of the distribution differed by only 16.9%, which nevertheless increased CAD prevalence 3.4-fold (p < 0.01). Irrespective of the affected gene, a single risk allele multiplied the effects of all others carried by a person, resulting in a 2.9-fold stronger effect size in the top versus the bottom decile (p < 0.01) and an exponential increase in risk (R > 0.94). Classical risk factors shifted effect sizes to the steep upslope of the logarithmic function linking risk allele numbers with CAD prevalence. Similar phenomena were observed in the Estonian Biobank and for risk alleles affecting diabetes mellitus, breast and prostate cancer.

Conclusions: Alleles predisposing to common diseases can be carried safely in large numbers, but few additional ones lead to sharp risk increments. Here, we describe exponential functions by which risk alleles combine interchangeably but multiplicatively with each other and with modifiable risk factors to affect prevalence. Our data suggest that the biological systems underlying these diseases are modulated by hundreds of genes but become only fragile when a narrow window of total risk, irrespective of its genetic or environmental origins, has been passed.

Keywords: Coronary artery disease; Genome-wide association studies; Liability threshold; Risk prediction; Risk score.


Conflict of interest statement

The author(s) declare(s) that there is no conflict of interest.

Figures

Fig. 1
Fig. 1
Histograms showing the distribution of risk alleles counts, which were normally distributed by Kolmogorov–Smirnov test (p values < 0.05), for coronary artery disease (CAD), breast cancer, prostate cancer, and type 2 diabetes mellitus (T2DM) in cases and controls separately. The number of common risk alleles per person were grouped in bins width of 2 risk alleles per person for respective diseases. Each person carried more than one hundred respective risk alleles with, on average, cases carrying 3–4 more than controls. Average numbers are shown for controls in green and for cases in blue boxes
Fig. 2
Fig. 2
A Disease prevalence in relation to the number of risk alleles. The Y-axis displays the prevalence of coronary artery disease (CAD) in the UKB population. The X-axis displays the cumulative number of risk alleles per person. The correlation (R) between observed and predicted prevalence is given for each of four fitted functions, with its 95% confidence interval. B We divided the prevalence of each disease by the number of risk alleles per person, showing the effect of a single risk allele depending on a person’s overall burden of risk variants. The parts of the population residing between the 2nd and 9th decile of allele count distribution are highlighted in grey. The green and red lines show the fit from the logit and logarithmic functions, respectively
Fig. 3
Fig. 3
A Prevalence of coronary artery disease in relation to 28 risk alleles affecting lipid levels (red dots) and 28 risk alleles with equal odds ratios but no effects on lipids (blue dots). In the first decile individuals carried on average 18.9 ± 1.3 lipid-related risk alleles and 17.8 ± 1.3 non-lipid-related risk alleles. The respective numbers for the tenth decile were 30.9 ± 1.3 and 28.9 ± 1.3. B CAD prevalence is shown in subgroups of the tenth deciles of lipid and non-lipid SNPs. We subdivided subjects in the tenth decile of lipid-related SNPs in a high, medium, and low number non-lipid-related SNP subgroup. Vice versa, we subdivided the tenth decile of non-lipid-related SNPs according to high, medium and low numbers of lipid-associated variants. Top*, middle*, low* refers to the 10th decile, 2nd to 9th deciles and 1st decile. The effects of lipid-related and non-lipid-related risk alleles are interchangeable with respect to the prevalence of CAD
Fig. 4
Fig. 4
Prevalence of CAD in risk allele deciles with and without diabetes (other risk factors are shown in Supplementary Figure S7). A shows the prevalence for CAD in individuals with and without diabetes in UKB. B shows CAD prevalence in low (1st), medium (2nd–9th) and high (10th) deciles of risk allele distribution in the UKB without and with diabetes. The grey bars represent the difference in prevalence related to diabetes in the three genetic subgroups. As can be seen, the effect of diabetes is much larger in subjects with a high burden of risk alleles. C shows disease prevalence across the deciles of risk alleles in subjects with (red line) and without diabetes (blue line). The correlation (R) between observed and predicted prevalence is given for fitted logit functions with their 95% confidence interval. D shows disease prevalence across the deciles of risk alleles in subjects with (red line) and without diabetes (blue line) as a deviation from the average in the respective group. In the diabetes group the increase in risk with increasing numbers of risk alleles is by far steeper (linear regression coefficient: diabetes 0.0058, no diabetes 0.0019). E displays the difference in prevalence between subjects with diabetes and without diabetes across increasing deciles of risk alleles indicating that increasing risk alleles numbers enhance the effect of diabetes. In D and E, the correlation (R) between observed and predicted prevalence is given for a quadratic function, with its 95% confidence interval

References

    1. Erdmann J, Kessler T, Munoz Venegas L, Schunkert H. A decade of genome-wide association studies for coronary artery disease: the challenges ahead. Cardiovasc Res. 2018;114:1241–1257. doi: 10.1093/cvr/cvy084. - DOI - PubMed
    1. Michailidou K, Lindström S, Dennis J, et al. Association analysis identifies 65 new breast cancer risk loci. Nature. 2017;551:92–94. doi: 10.1038/nature24284. - DOI - PMC - PubMed
    1. Schumacher FR, Al Olama AA, Berndt SI, et al. Association analyses of more than 140,000 men identify 63 new prostate cancer susceptibility loci. Nat Genet. 2018;50:928–936. doi: 10.1038/s41588-018-0142-8. - DOI - PMC - PubMed
    1. Mahajan A, Taliun D, Thurner M, et al. Fine-mapping type 2 diabetes loci to single-variant resolution using high-density imputation and islet-specific epigenome maps. Nat Genet. 2018;50:1505–1513. doi: 10.1038/s41588-018-0241-6. - DOI - PMC - PubMed
    1. Hughes MF, Saarela O, Stritzke J, et al. Genetic markers enhance coronary risk prediction in men: the MORGAM prospective cohorts. PLoS ONE. 2012;7:e40922. doi: 10.1371/journal.pone.0040922. - DOI - PMC - PubMed