. 2022 Aug 20;14(1):103.
doi: 10.1186/s13148-022-01325-4.

Genomic targets and selective inhibition of DNA methyltransferase isoforms

Affiliations

Genomic targets and selective inhibition of DNA methyltransferase isoforms

Chanachai Sae-Lee et al. Clin Epigenetics. .

Abstract

Background: DNA methylation in the human genome is established and maintained by DNA methyltransferases (DNMTs). DNMT isoforms show differential expression by cell lineage and during development, but much remains to be elucidated about their shared and unique genomic targets.

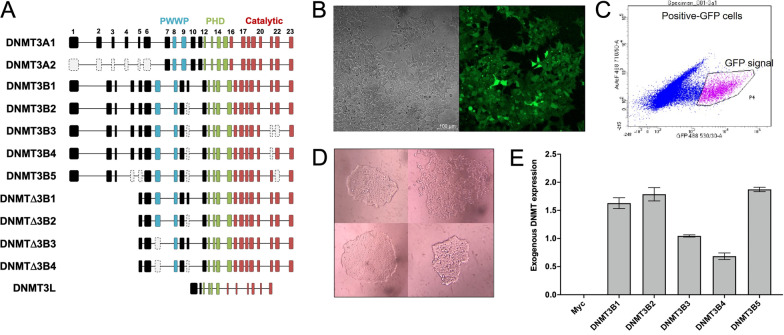
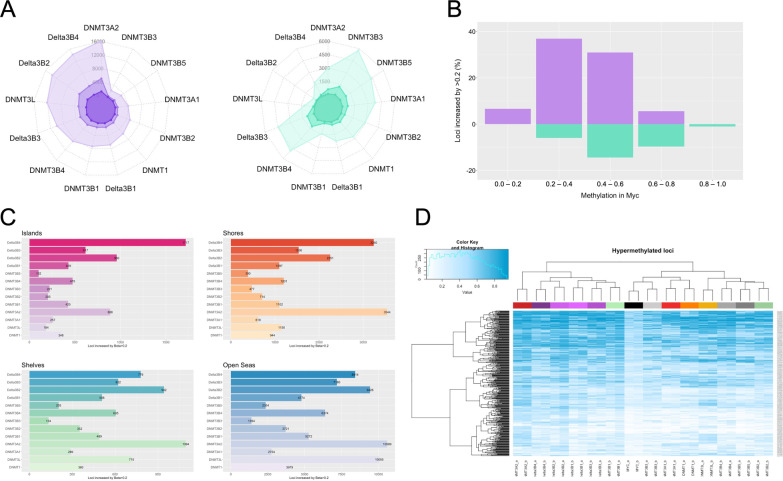
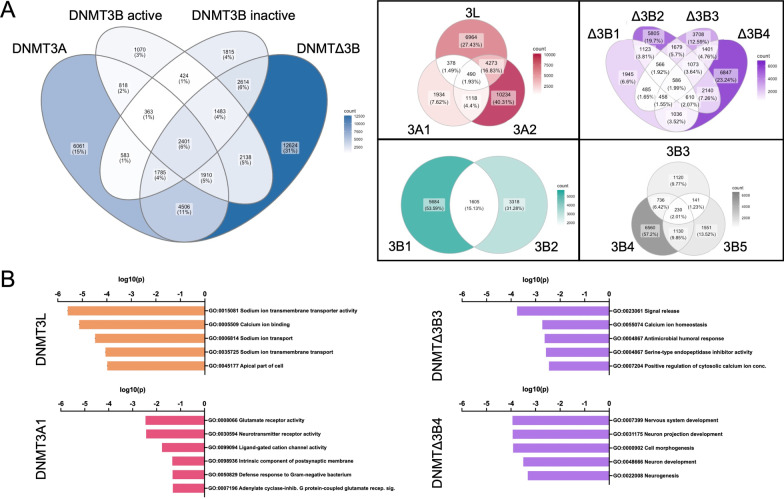
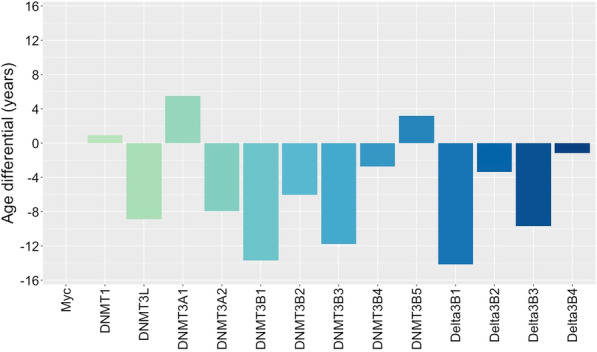
Results: We examined changes in the epigenome following overexpression of 13 DNMT isoforms in HEK293T cells. We observed increased methylation (Δβ > 0.2) at 43,405 CpG sites, with expression of DNMT3A2, DNMTΔ3B4 and DNMTΔ3B2 associated with the greatest impact. De novo methylation occurred primarily within open sea regions and at loci with intermediate methylation levels (β: 0.2-0.6). 53% of differentially methylated loci showed specificity towards a single DNMT subfamily, primarily DNMTΔ3B and DNMT3A and 39% towards a single isoform. These loci were significantly enriched for pathways related to neuronal development (DNMTΔ3B4), calcium homeostasis (DNMTΔ3B3) and ion transport (DNMT3L). Repetitive elements did not display differential sensitivity to overexpressed DNMTs, but hypermethylation of Alu elements was associated with their evolutionary age following overexpression of DNMT3A2, DNMT3B1, DNMT3B2 and DNMT3L. Differential methylation (Δβ > 0.1) was observed at 121 of the 353 loci associated with the Horvath 'epigenetic clock' model of ageing, with 51 showing isoform specificity, and was associated with reduction of epigenetic age by 5-15 years following overexpression of seven isoforms. Finally, we demonstrate the potential for dietary constituents to modify epigenetic marks through isoform-specific inhibition of methylation activity.

Conclusions: Our results provide insight into regions of the genome methylated uniquely by specific DNMT isoforms and demonstrate the potential for dietary intervention to modify the epigenome.

Keywords: DNA methylation; DNA methyltransferases; DNMT isoforms; Dietary constituents; Epigenetic clock; Epigenome; Repetitive elements.


Conflict of interest statement

The authors declare that they have no competing interests.

Figures

Fig. 1
Fig. 1
Construction of DNMT overexpressing cell lines. A Diagrammatic representation of isoforms from the DNMT3A, DNMT3B, DNMTΔ3B and DNMT3L subfamilies. Exons are indicated, with missing or excluded exons in grey. Also indicated are the proline-tryptophan-tryptophan-proline (PWWP) domain (blue), cysteine-rich PHD zinc finger domain (green), and C-terminal catalytic domain (red). DNMT1 is not illustrated due to its highly divergent N-terminal region. B Bright field and fluorescence microscope images of HEK293T cells transduced with the DNMT3L construct, expressing GFP. C Selection of GFP-positive (pink) transduced cells by FACS. D Morphology of single-cell colonies grown in cells transduced to overexpress DNMTΔ3B4. E Exogenous expression of DNMT3B1-5 in transduced cells, relative to PPIA and GAPDH. Data are expressed as means ± SD
Fig. 2
Fig. 2
Characterisation of changes in DNA methylation in response to DNMT isoform overexpression. A Number of CpG sites displaying gains (left, purple) and losses (right, green) of Δβ > 0.4 (dark purple/green), Δβ > 0.3 (medium purple/green) and Δβ > 0.2 (light purple/green) by DNMT isoform. B Frequency of gains of Δβ > 0.2 (purple) and losses of Δβ < − 0.2 (green) across all isoform-overexpressing cell lines by methylation levels in control cells. C Number of CpG sites displaying gains of Δβ > 0.2 mapping to CpG islands, shores, shelves and open seas by DNMT isoform. D Heatmap displaying methylation at loci displaying gains of methylation of Δβ > 0.3 in response to expression of one or more isoforms
Fig. 3
Fig. 3
Specificity of hypermethylated loci to DNMT subfamilies and isoforms. A Venn diagram illustrating CpG sites showing gains of methylation of Δβ > 0.2 by DNMT subfamily (blue) and by isoform within the DNMT3A (red), DNMT3B catalytically active (green), DNMT3B catalytically inactive (grey) and DNMTΔ3B (purple) subfamilies. B GO pathway analysis for CpG sites displaying gains of Δβ > 0.2 uniquely in response to overexpression of DNMT3L, DNMT3A1, DNMTΔ3B3 and DNMTΔ3B4
Fig. 4
Fig. 4
Analysis of repetitive elements. A DNA methylation at loci mapping to LINES, SINES, long terminal repeats (LTR), satellite DNA, regions of low complexity, and simple repeats. B Gains of methylation of Δβ > 0.2 (light purple), Δβ > 0.3 (medium purple) and Δβ > 0.4 (dark purple) at loci mapping to repetitive elements in response to DNMT isoform overexpression. C Correlation between changes in DNA methylation (Δβ) at Alu subfamilies by their time since integration within the genome (million years ago, MYA)
Fig. 5
Fig. 5
Impact of DNMT isoform overexpression of epigenetic ageing. Changes in estimates of epigenetic age (‘Age differential’, years) in cell lines overexpressing DNMT isoforms, calculated by the Horvath ‘epigenetic clock’ model of ageing
Fig. 6
Fig. 6
Inhibition of DNMTΔ3B4 by caffeic acid. A Changes in global methylation (%), measured by LINE-1 assay, in response to exposure to 0, 100 and 200 µM caffeic acid in cell lines expressing seven DNMT isoforms. B Changes in methylation at cg25843713 (top) and cg04458645 (bottom) in response to caffeic acid exposure. C Changes in methylation at two loci uniquely methylated by DNMTΔ3B4 (cg07504154, left; cg22976313, right) in response to caffeic acid exposure. Methylation in control cells (black) and those overexpressing DNMT3L (grey) and DNMTΔ3B4 (red) are displayed. D Methylase activity of DNMTΔ3B4 in the presence of 0–300 µM caffeic acid. Data are presented as means ± SD

References

    1. Jurkowska RZ, Jurkowski TP, Jeltsch A. Structure and function of mammalian DNA methyltransferases. ChemBioChem. 2011;12(2):206–222. doi: 10.1002/cbic.201000195. - DOI - PubMed
    1. Song J, Teplova M, Ishibe-Murakami S, Patel DJ. Structure-based mechanistic insights into DNMT1-mediated maintenance DNA methylation. Science. 2012;335(6069):709–712. doi: 10.1126/science.1214453. - DOI - PMC - PubMed
    1. Hermann A, Goyal R, Jeltsch A. The Dnmt1 DNA-(cytosine-C5)-methyltransferase methylates DNA processively with high preference for hemimethylated target sites. J Biol Chem. 2004;279(46):48350–48359. doi: 10.1074/jbc.M403427200. - DOI - PubMed
    1. Okano M, Bell DW, Haber DA, Li E. DNA methyltransferases Dnmt3a and Dnmt3b are essential for de novo methylation and mammalian development. Cell. 1999;99(3):247–257. doi: 10.1016/S0092-8674(00)81656-6. - DOI - PubMed
    1. Sharma S, De Carvalho DD, Jeong S, Jones PA, Liang G. Nucleosomes containing methylated DNA stabilize DNA methyltransferases 3A/3B and ensure faithful epigenetic inheritance. PLoS Genet. 2011;7(2):e1001286. doi: 10.1371/journal.pgen.1001286. - DOI - PMC - PubMed

MeSH terms

Substances

LinkOut - more resources