. 2022 Aug 20;13(1):4913.
doi: 10.1038/s41467-022-32649-7.

Transposon-activated POU5F1B promotes colorectal cancer growth and metastasis

Affiliations

Transposon-activated POU5F1B promotes colorectal cancer growth and metastasis

Laia Simó-Riudalbas et al. Nat Commun. .

Abstract

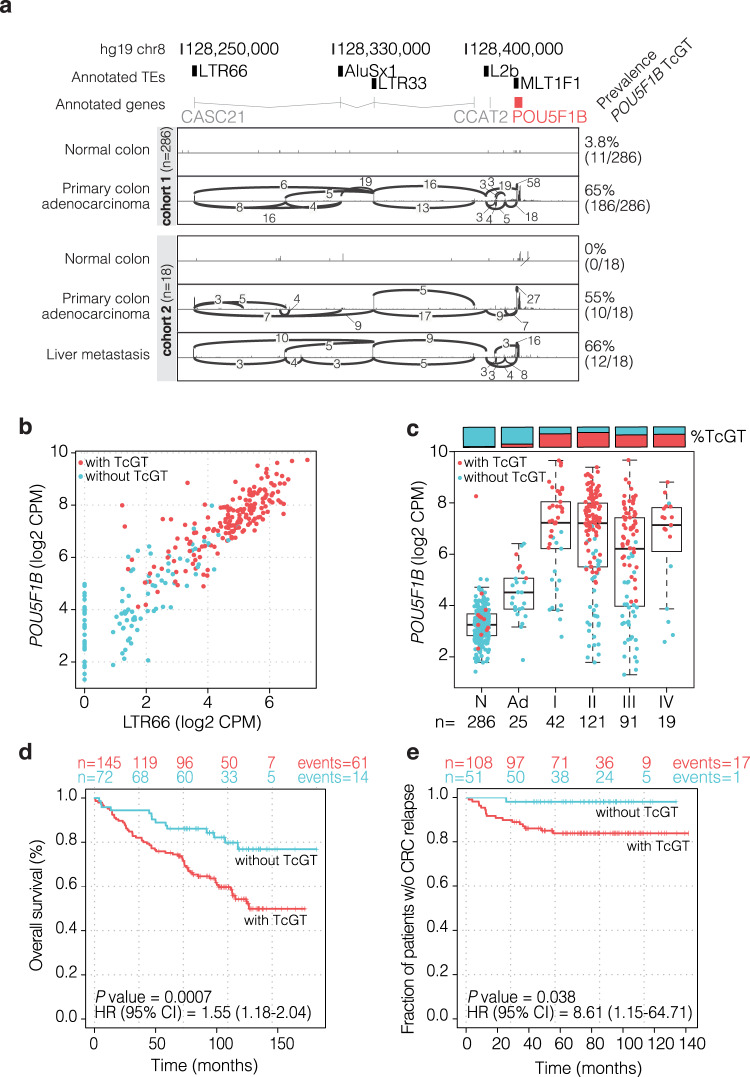
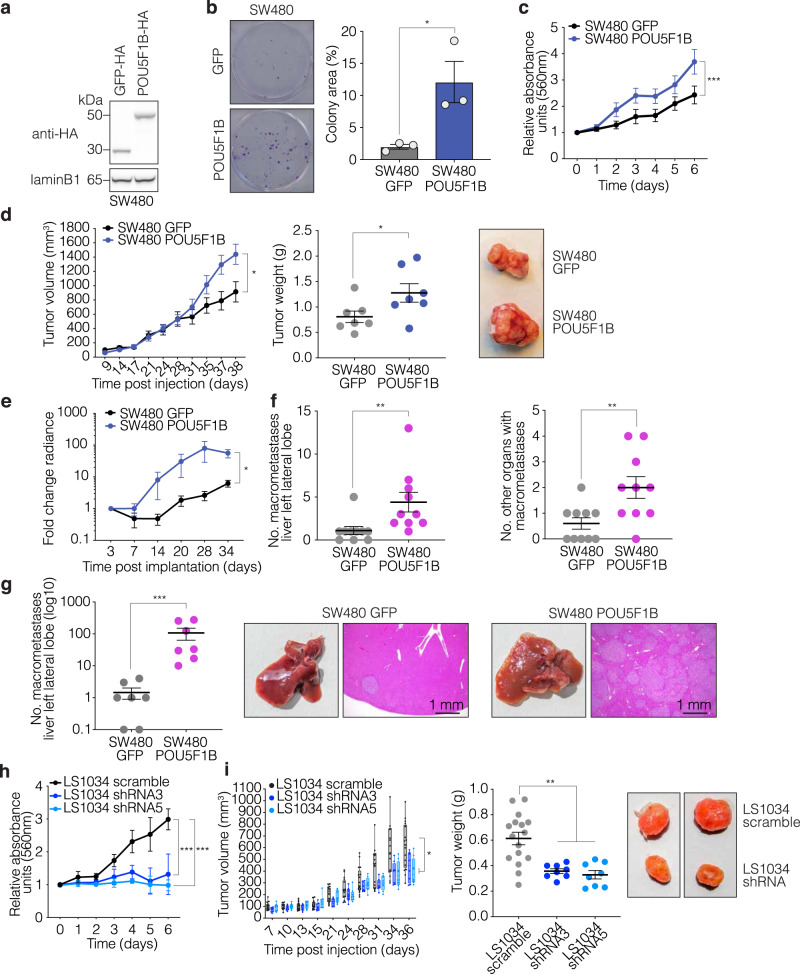
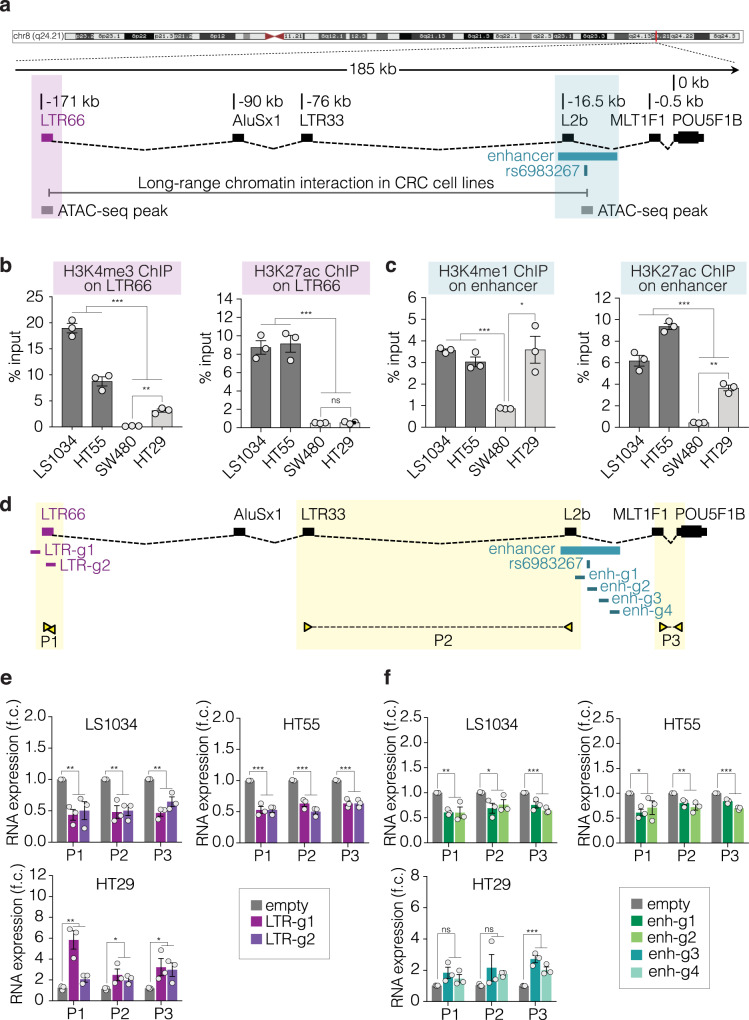
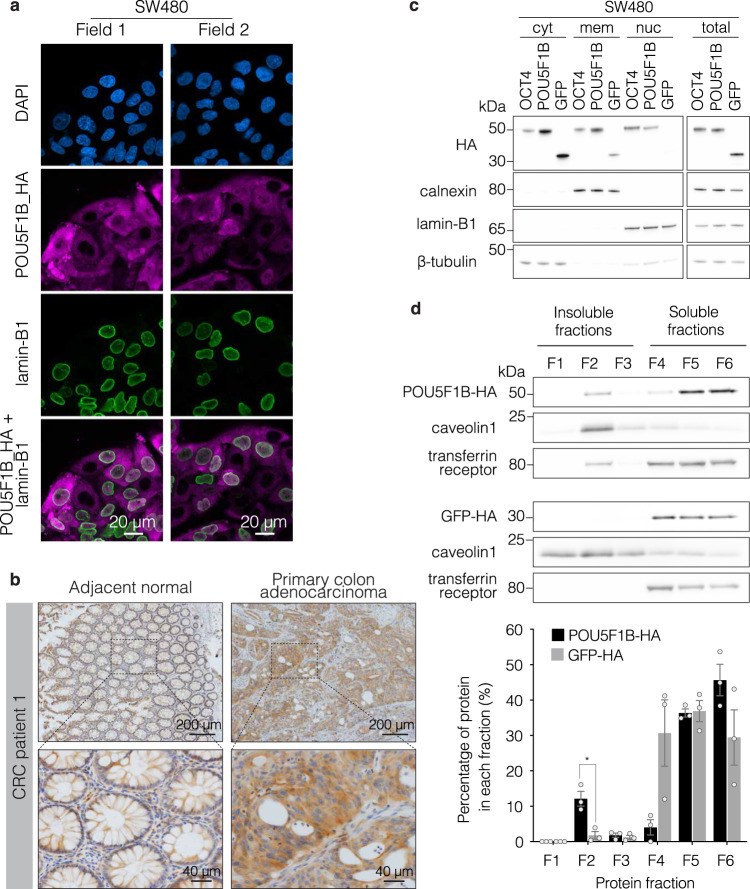
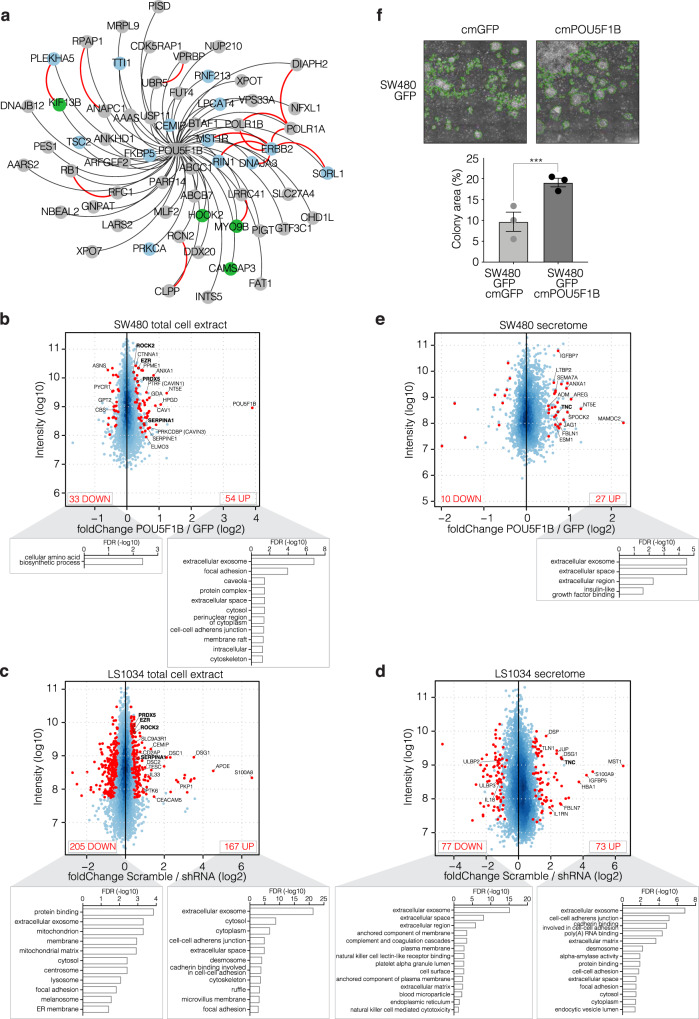
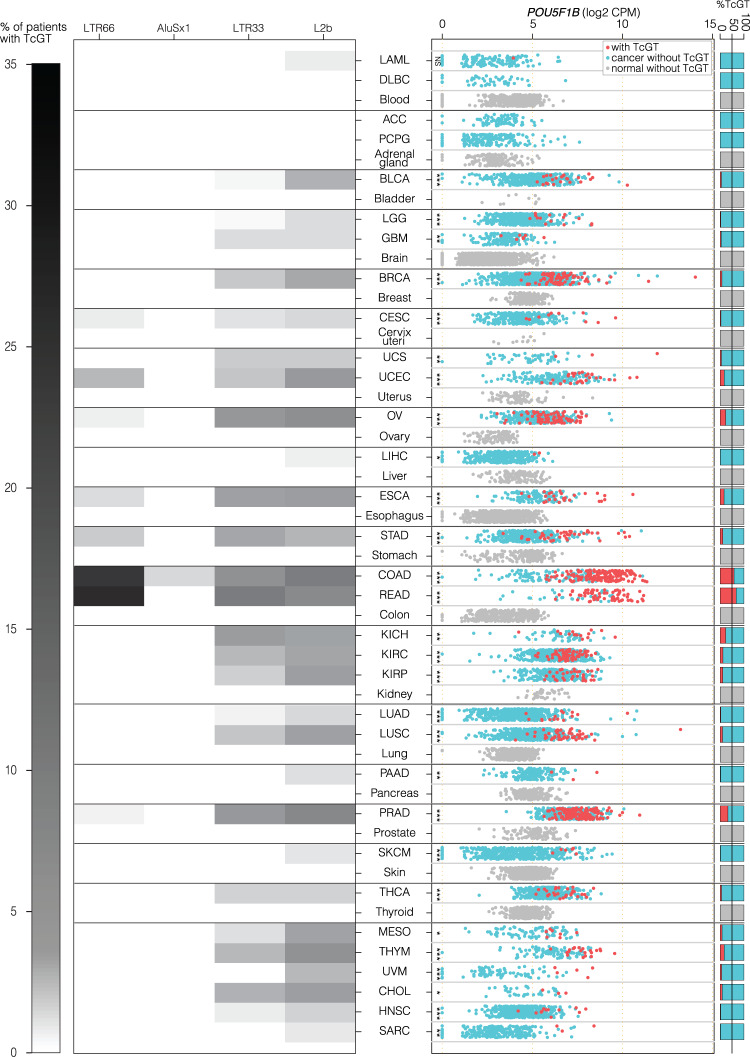
The treatment of colorectal cancer (CRC) is an unmet medical need in absence of early diagnosis. Here, upon characterizing cancer-specific transposable element-driven transpochimeric gene transcripts (TcGTs) produced by this tumor in the SYSCOL cohort, we find that expression of the hominid-restricted retrogene POU5F1B through aberrant activation of a primate-specific endogenous retroviral promoter is a strong negative prognostic biomarker. Correlating this observation, we demonstrate that POU5F1B fosters the proliferation and metastatic potential of CRC cells. We further determine that POU5F1B, in spite of its phylogenetic relationship with the POU5F1/OCT4 transcription factor, is a membrane-enriched protein that associates with protein kinases and known targets or interactors as well as with cytoskeleton-related molecules, and induces intracellular signaling events and the release of trans-acting factors involved in cell growth and cell adhesion. As POU5F1B is an apparently non-essential gene only lowly expressed in normal tissues, and as POU5F1B-containing TcGTs are detected in other tumors besides CRC, our data provide interesting leads for the development of cancer therapies.


Conflict of interest statement

L.S.R., E.P., J.D., and D.T. are inventors on an international patent application (title: Transpochimeric gene trancripts (tcgts) as cancer biomarkers; identification number: US2022145395 (A1)) submitted by the École Polytechnique Fédérale de Lausanne that covers methods for transposcriptome–based biomarker discovery. The remaining authors declare no competing interests.

Figures

Fig. 1
Fig. 1. An LTR66 endogenous retroviral promoter drives POU5F1B expression in CRC.
a Chromosome 8q24.21 genomic locus, with transposable elements (TEs) (black boxes), non-coding RNAs CASC21 and CCAT2 (gray lines) and POU5F1B gene (red box). Splice junctions were highlighted in two representative CRC patients, respectively, from the SYSCOL (cohort 1) and GSE50760 (cohort 2) cohorts. b Correlation of LTR66 and POU5F1B RNA levels in SYSCOL CRC RNA-seq dataset (n = 286 patients, two-sided Pearson cor = 0.91, P = 1e-16). c POU5F1B expression levels in normal colon (N), adenoma (Ad), and stage I-IV carcinoma samples from the SYSCOL cohort, as measured by RNA-seq. Boxplots are represented as first and third quartiles with a median in the center. Whiskers are defined as 1.5 times the interquartile range. d Kaplan–Meier representation of overall survival in stages II-III SYSCOL patients according to the presence (n = 145) or absence (n = 72) of POU5F1B TcGT. e Kaplan-Meier representation of relapse-free survival in stage II-III SYSCOL patients with respect to the presence (n = 108) or absence (n = 51) of POU5F1B TcGTs. In d, e HR and CI were computed by fitting the univariate Cox model. Source data are provided as a Source Data file.
Fig. 2
Fig. 2. POU5F1B enhances CRC progression in vitro and in vivo.
a Western blot analysis of HA-tagged GFP and POU5F1B in SW480 cells (representative blot out of three independent experiments). b Colony formation assay in GFP- and POU5F1B-overexpressing SW480 cells (n = 3 independent experiments; P = 0.011 by two-sided t-test). c 3-(4,5-dimethylthiazol-2-yl)−2,5-diphenyltetrazolium bromide (MTT) assay in GFP- and POU5F1B-overexpressing SW480 cells (n = 3 independent experiments; P = 4.67e-05 by two-sided Wilcoxon test). d Tumor volume and weight in subcutaneous implanted POU5F1B-overexpressing SW480 cells (n = 7 tumors per group; P = 0.041 by two-sided Wilcoxon test; P = 0.048 by two-sided t-test, respectively), with representative macroscopy. e Tumor invasion based on bioluminescence in orthotopically implanted animals (n = 10 animals per group, P = 0.038 by two-sided Wilcoxon test). f Number of macrometastases in liver left lobe and of additional organs affected by metastases (n = 10 animals per group, P = 0.002, P = 0.009, respectively, by two-sided t-test). g Number of macrometastases in liver left lobe following intrasplenic injection and splenectomy, with at right macroscopic view and microscopy of H&E-stained slices (n = 7 animals per group, P = 2.4e–04 by two-sided t-test). h MTT assay (n = 3 independent experiments; sh3 P = 2e–04, sh5 P = 1.19e–06 by Wilcoxon test) of LS1034 cells transduced with two different TcGT-targeting shRNAs or a control scramble sequence. i Tumor volume and weight in mice subcutaneously implanted with POU5F1B-downregulated or control LS1034 cells (n = 16 tumors scramble and n = 8 tumors shRNA, P = 0.018, P = 1e–04 respectively, by two-sided Wilcoxon test, boxplots left panel are represented as first and third quartiles with median in the center and whiskers are defined as 1.5 times the interquartile range clipped to the maximum/minimum of the data), with representative macroscopy (shRNA3 left, shRNA5 right). Data in bh, i right) are presented as mean values ± s.e.m., with single values as circles. *P < 0.05, **P < 0.01, ***P < 0.001. Source data are provided as a Source Data file.
Fig. 3
Fig. 3. The rs6983267-containing enhancer regulates LTR66-POU5F1B expression.
a The LTR66-POU5F1B genomic locus, with depiction of TcGT (black boxes linked by broken dashed lines), rs6983267-containing enhancer from UCSC GeneHancer tracks (turquoise box), long-range chromatin interaction in CRC cell lines from the literature (gray line), and ATAC-seq peaks in CRC tumor samples from TCGA (gray boxes). b, c ChIP-PCR analyzes of LTR66-POU5F1B-expressing (LS1034 and HT55) and non-expressing (SW480 and HT29) CRC cell lines for indicated chromatin marks (n = 3 independent experiments; from left to right b: ***P = 6.70e–08, **P = 9.64e–03, ***P = 5.58e–07, nsP = 0.68; c: ***P = 6.45e–04, *P = 4.81e–02, ***P = 1.01e-05, **P = 6.38e–03, respectively, by two-sided t-test). d Schematic representation of gRNAs (g) and primers (P) used to target CRISPRi or CRISPRa to either LTR66 or the rs6983267-containing region and measure LTR66-POU5F1B transcripts by qRT-PCR. e,f Impact of indicated manipulations on LTR66-POU5F1B RNA levels (n = 3 independent experiments; e: LS1034 P1 **P = 4.21e-03, P2 **P = 1.33e–03, P3 **P = 4.67e–03; HT55 P1 ***P = 6.79e–05, P2 ***P = 6.03e–05, P3 ***P = 7e-05; HT29 P1 **P = 6.30e–03, P2 *P = 4.93e-02, P3 *P = 4.32e-02; f: LS1034 P1 **P = 2.96e-03, P2 *P = 2.94e-02, P3 ***P = 9.62e–03; HT55 P1 *P = 2.03e–02, P2 **P = 3.92e–03, P3 ***P = 3.69e–05; HT29 P1 ns P = 8.64e–02, P2 nsP = 0.18, P3 ***P = 6.62e–04, respectively, by two-sided t-test). Data in bf are presented as mean ± s.e.m., with single values as circles. Ns, not significant; *P < 0.05, **P < 0.01, ***P < 0.001. Source data are provided as a Source Data file.
Fig. 4
Fig. 4. POU5F1B differs from OCT4.
a Representative immunofluorescence–confocal microscopy of POU5F1B-HA overexpressing SW480 cells, with DAPI in blue, HA in pink, and the nuclear membrane marker lamin-B1 in green. Two fields out of eight are shown. b Immunohistochemistry for endogenous POU5F1B in adjacent normal colon and primary colon adenocarcinoma samples from CRC patient 1. Two levels of magnification from a representative field out of three are shown. More patients are depicted in Supplementary Fig 4e. c Subcellular fractionation into the cytoplasm (cyto), membrane (mem), and nuclear (nuc) compartments from OCT4-, POU5F1B- and GFP-overexpressing SW480 cells, with total cell extracts on right. Calnexin, lamin-B1, and beta-tubulin are used as controls for membrane, nucleus, and cytoplasm, respectively (representative blot out of three independent experiments). d Top, isolation of detergent-resistant membranes (DRMs) from POU5F1B- and GFP-overexpressing SW480 cells. F1–F3 correspond to insoluble fractions, F4–F6 to soluble fractions, DRMs being traditionally found in fraction F2. Caveolin1 and transferrin receptors are used as controls for insoluble and soluble fractions, respectively (representative blot out of three independent experiments). Bottom, western blot quantification indicating the percentage of protein in each fraction (n = 3 independent experiments; P = 2.1e–02 by two-sided t-test). Source data are provided as a Source Data file.
Fig. 5
Fig. 5. Proteomic characterization of POU5F1B-induced molecular changes.
a High-confidence interactome of POU5F1B detected by AP/MS in HT29 and LS1034 CRC cells overexpressing POU5F1B-HA. Weighted black edges are based on the average fold change over controls (n = 12 samples, 4 conditions, 3 replicates/condition; all depicted interactions have a fold change over controls >5 and P < 0.01). Red edges depict previously documented protein-protein interactions. Interactors with signaling functions are highlighted in blue and cytoskeleton-related proteins in green. be MA plot depicting relative abundance and average intensity of individual proteins identified by SILAC in total cell extracts (b, c) or in the secretome (d, e) of POU5F1B- vs. GFP-overexpressing SW480 cells (b, e) or in sh-scramble vs. shRNA3 & shRNA5 LS1034 cells (c, d). All SILAC measurements were performed in independent duplicates, each dot represents a detected protein, with significantly changed ones (P < 0.05, outlier detection test as computed by MaxQuant) in red and their numbers indicated in upper corners. Names in bold are for proteins common to the corresponding settings in both cell lines. Significantly enriched proteins were clustered in GO terms using the Functional Annotation Chart from DAVID bioinformatics resources 6.8. f Conditioned-medium colony formation assay; GFP-overexpressing SW480 cells form bigger colonies when exposed to POU5F1B- rather than GFP-conditioned medium (cm). A green line delimits the quantified area in representative pictures (n = 3 independent experiments with 3 replicates; P = 1.27e–05 by two-sided t-test). Data presented as mean ± s.e.m., with single values as circles. Source data are provided as a Source Data file.
Fig. 6
Fig. 6. POU5F1B-encoding TcGTs are detected in several other cancers.
a Left, heatmap depicting the percentage of patients with POU5F1B TcGTs for indicated TCGA cancers and normal tissues of the Genotype–Tissue Expression (GTEx) dataset. Locations of TEs acting as TSS are indicated on top, with the intensity of gray shade proportional to usage frequency. Right, levels of expression of POU5F1B transcripts in 9,566 samples from 32 cancer types of the TCGA dataset and in 8878 samples from 29 normal tissue types of the GTEx dataset. For each TCGA and GTEX category, expression of TcGT samples was compared to non-TcGT samples with a two-sided t-test. Significance levels are shown as stars (*** pval < 0.001, **pval < 0.01, *pval < 0.05). Right margin, percentage of samples with (red) or without TcGT (blue -cancer-, gray -normal tissue–). Abbreviations: ACC adrenocortical carcinoma; BLCA bladder urothelial carcinoma; BRCA breast carcinoma; CESC cervical squamous cell carcinoma; CHOL cholangiocarcinoma; COAD colon adenocarcinoma; DLBC diffuse large B-cell lymphoma; ESCA esophageal carcinoma; GBM glioblastoma multiforme; HNSC head, and neck squamous cell carcinoma; KICH kidney chromophobe; KIRC kidney renal clear cell carcinoma; KIRP kidney renal papillary cell carcinoma; LAML acute myeloid leukemia; LGG low grade glioma; LIHC liver hepatocellular carcinoma; LUAD lung adenocarcinoma; LUSC lung squamous cell carcinoma; MESO mesothelioma; OV ovarian cancer; PAAD pancreatic adenocarcinoma; PCPG pheochromocytoma, and paraganglioma; PRAD prostate adenocarcinoma; READ rectal adenocarcinoma; SARC sarcoma; SKCM skin cutaneous melanoma; STAD stomach adenocarcinoma; THCA thyroid carcinoma; THYM thymoma; UCEC uterine corpus endometrial carcinoma; UCS uterine carcinosarcoma; UVM uveal melanoma.

References

    1. Bourque G, et al. Evolution of the mammalian transcription factor binding repertoire via transposable elements. Genome Res. 2008;18:1752–1762. doi: 10.1101/gr.080663.108. - DOI - PMC - PubMed
    1. Trizzino M, et al. Transposable elements are the primary source of novelty in primate gene regulation. Genome Res. 2017;27:1623–1633. doi: 10.1101/gr.218149.116. - DOI - PMC - PubMed
    1. Chuong EB, Elde NC, Feschotte C. Regulatory evolution of innate immunity through co-option of endogenous retroviruses. Science. 2016;351:1083–1087. doi: 10.1126/science.aad5497. - DOI - PMC - PubMed
    1. Trono D. Transposable elements, polydactyl proteins, and the genesis of human-specific transcription networks. Cold Spring Harb. Symp. Quant. Biol. 2015;80:281–288. doi: 10.1101/sqb.2015.80.027573. - DOI - PMC - PubMed
    1. Imbeault M, Helleboid P-Y, Trono D. KRAB zinc-finger proteins contribute to the evolution of gene regulatory networks. Nature. 2017;543:550–554. doi: 10.1038/nature21683. - DOI - PubMed

Publication types

Substances