. 2022 Aug 20;79(9):491.
doi: 10.1007/s00018-022-04470-4.

Environmental and intrinsic modulations of venous differentiation

Affiliations

Environmental and intrinsic modulations of venous differentiation

Laurence Pibouin-Fragner et al. Cell Mol Life Sci. .

Abstract

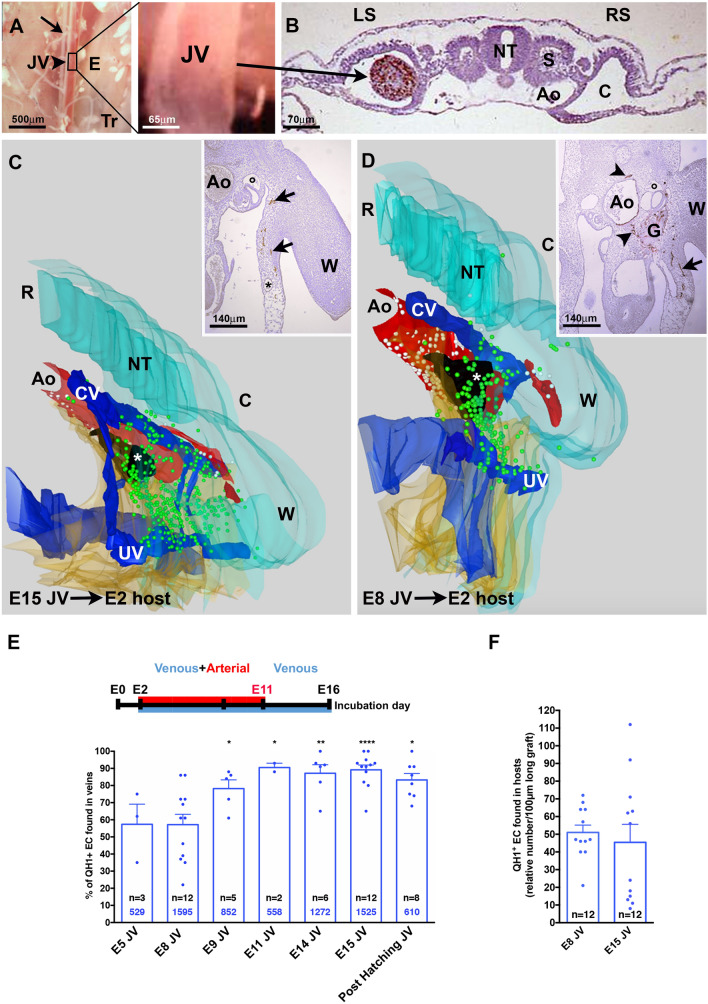
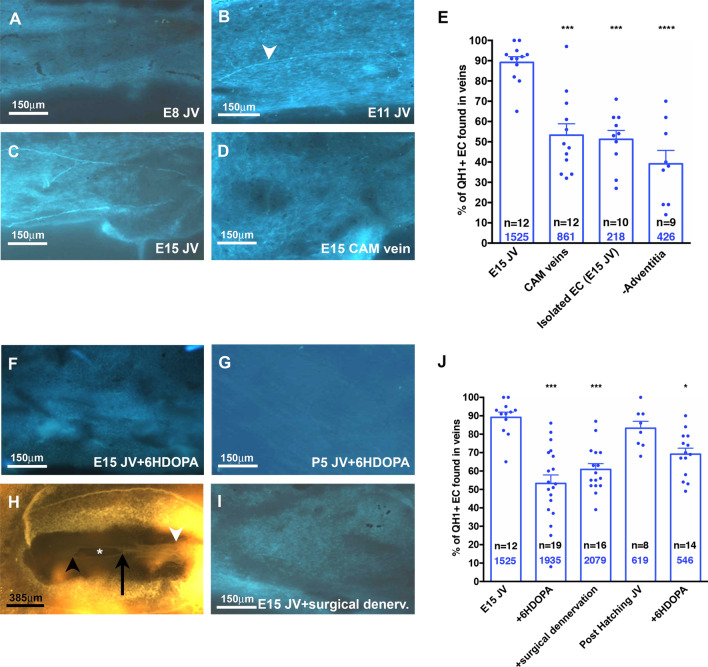
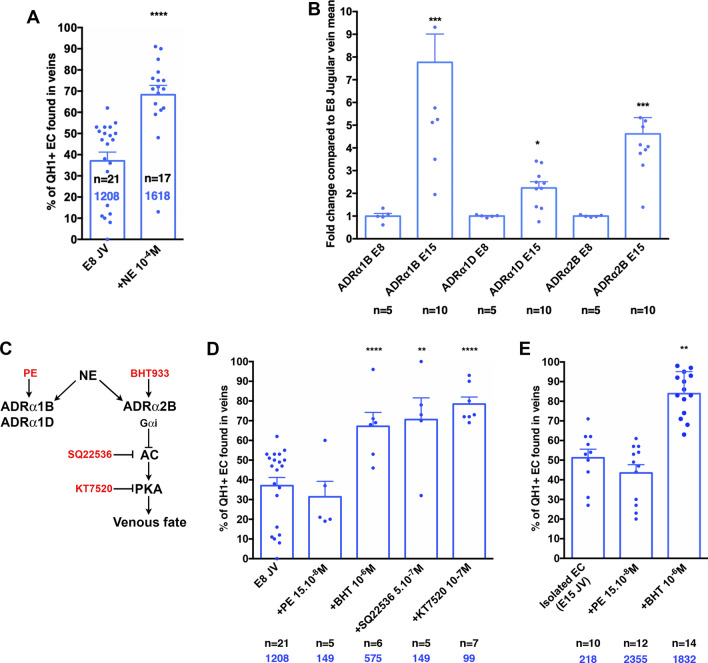
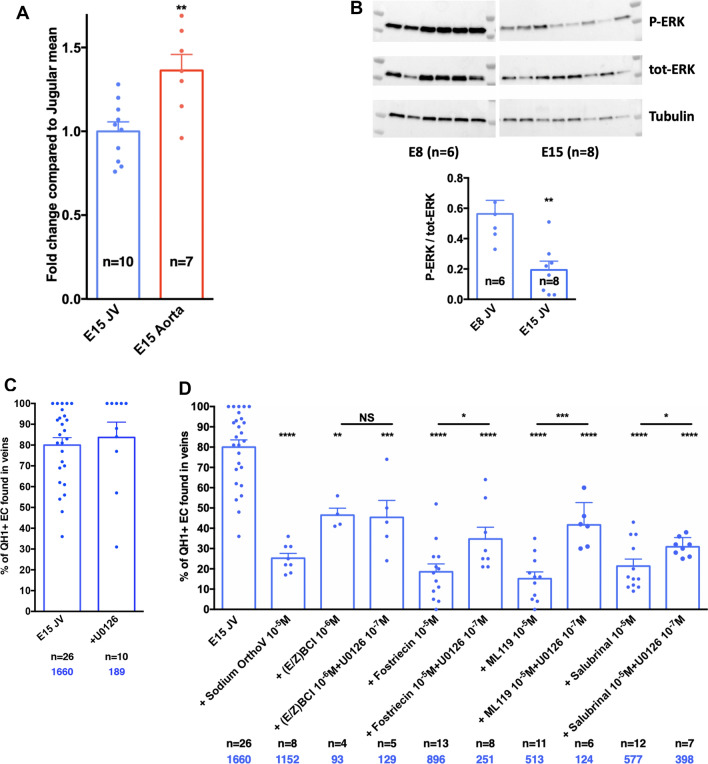
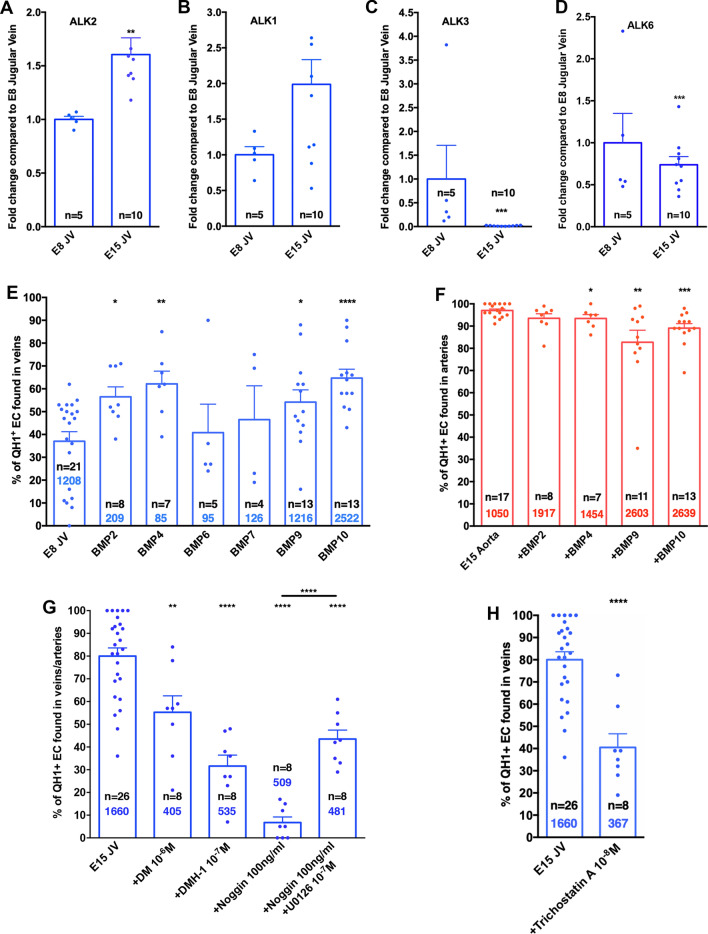
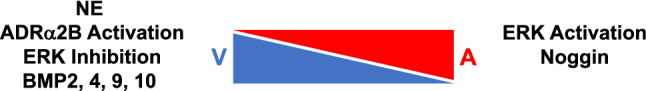
Endothelial cells in veins differ in morphology, function and gene expression from those in arteries and lymphatics. Understanding how venous and arterial identities are induced during development is required to understand how arterio-venous malformations occur, and to improve the outcome of vein grafts in surgery by promoting arterialization of veins. To identify factors that promote venous endothelial cell fate in vivo, we isolated veins from quail embryos, at different developmental stages, that were grafted into the coelom of chick embryos. Endothelial cells migrated out from the grafted vein and their colonization of host veins and/or arteries was quantified. We show that venous fate is promoted by sympathetic vessel innervation at embryonic day 11. Removal of sympathetic innervation decreased vein colonization, while norepinephrine enhanced venous colonization. BMP treatment or inhibition of ERK enhanced venous fate, revealing environmental neurotransmitter and BMP signaling and intrinsic ERK inhibition as actors in venous fate acquisition. We also identify the BMP antagonist Noggin as a potent mediator of venous arterialization.

Keywords: Avian embryo; BMPs; ERK; Sympathetic pathway; Venous differentiation.


Conflict of interest statement

The authors declare no competing or financial interests.

Figures

Fig. 1
Fig. 1
Method to test venous fate in avian chimeras. A Dissection of an E15 quail jugular vein (JV, arrowhead) adjacent to the vagus nerve (arrow), the esophagus (E) and the trachea (Tr). A segment of JV (magnified box, A) is isolated and grafted in the coelomic cavity (C) of an E2 chick embryo (arrow, A–B). B Transverse section of a chick host 3 h after grafting shows QCPN + quail tissue implanted in the coelom (arrow) on the left side (LS). Ao: aorta; NT: neural tube; S: somite; RS: right side. C and D Representative 3D reconstructions [31] of QH1 + EC distribution in chick hosts 48 h after the graft: as grafted cells never cross the midline, only the left half is illustrated. The neural tube (NT) and wing bud (W) are colored blue, the viscera in yellow, the graft (*) in black, the arterial plexus in red and the venous plexus in dark blue. C The majority of QH1 + ECs originating from an E15 JV graft colonized host veins (green dots) but not arteries (white dots). D QH1 + ECs emigrating from an E8 JV colonized host veins (green dots) and arteries (white dots). Insets show transverse sections that served to generate the 3D reconstructions in C and D respectively. The inset in C illustrates the colonization of the umbilical vein plexus (*) by QH1 + ECs (arrows). The inset in D shows QH1 + ECs around the graft (G), both in the aorta (Ao) and its dorsal and ventral branches (arrowheads) and in branches of the umbilical vein (arrow). C caudal; R rostral; CV cardinal vein; UV umbilical vein; W wing bud. E Histogram of venous colonization from JV grafts at different developmental stages. The columns show the percentage of QH1 + ECs that colonize host veins, each dot corresponds to one JV sample. *P < 0.05, **P < 0.01, ****P < 0.0001, by comparison with E8 column, Mann–Whitney or Unpaired 2-tailed non-parametric t tests. Top, Schematic illustration of the results: when isolated from E11 or older embryos, grafted JV ECs mainly colonize host veins (blue), but when isolated before E11, grafted JV ECs colonize host veins and arteries (blue and red). F) Quantification of the total number of emigrating QH1 + ECs in E15 and E8 grafts, each dot corresponds to one JV sample. Unpaired 2-tailed nonparametric t test. Error bars: SEM. n number of grafts. The blue numbers correspond to the total number of cells counted in each condition
Fig. 2
Fig. 2
Denervation inhibits vein colonization. AD Glyoxylic acid staining of sympathetic nerves in the JV vessel wall. No staining was detected at E8 (A); the first fibers were visible at E11 (B, arrowhead) and formed a network at E15 (C). D CAM veins lack innervation. E Quantification of host venous colonization by QH1 + ECs from CAM veins, isolated E15 JV ECs and E15 JV without adventitia, each dot corresponds to one sample. ***P < 0.001, ****P < 0.0001 by comparison with E15 JV column, Unpaired 2-tailed nonparametric t tests. F, G 6HDOPA treatment abolished innervation of E15 (F) and P5 (G) JVs. H Surgical denervation of a 15 somite-stage quail embryo by resection (*) of the neural tube and the notochord between the fifth somite (arrow) and the caudal region (black arrowhead). Rostrally, the neural tube is intact (white arrowhead). I Post-surgery glyoxylic acid staining shows the absence of nerve fibers at the surface of an E15 JV. J Quantification of host venous colonization by QH1 + ECs from denervated JVs, each dot corresponds to one JV sample. *P < 0.05, ***P < 0.001, by comparison with E15 or post-hatching vessels, Unpaired 2-tailed nonparametric t tests. Error bars: SEM, n number of grafts. The blue numbers correspond to the total number of cells counted in each condition
Fig. 3
Fig. 3
Sympathetic pathways regulating venous fate. A Quantification of host venous colonization by QH1 + ECs from E8 JVs treated or not with NE overnight on semi-solid medium prior to grafting into E2 chick hosts, each dot corresponds to one JV sample. ****P < 0.0001, by comparison with untreated E8 JVs, Unpaired 2-tailed nonparametric t test. B QPCR analyses of ADR expression in E8 versus E15 JVs. Expression levels at E8 are set as 1, each dot corresponds to one JV sample. *P < 0.05, ***P < 0.001, Mann–Whitney tests. C Schematic of NE signaling via ADRα2B, including pharmacological agents used against downstream effectors that affect venous colonization. D Quantification of host venous colonization by QH1 + ECs from E8 JVs treated or not with the indicated molecules, each dot corresponds to one JV sample. **P<0.01, ****P<0.0001, by comparison with untreated E8 JVs, Unpaired 2-tailed non parametric t test. E Quantification of host venous colonization by QH1 + cells from isolated ECs from E15 JVs. **P < 0.01, by comparison with the control column, Unpaired 2-tailed nonparametric t tests. n number of grafts. The blue numbers correspond to the total number of cells counted in each condition
Fig. 4
Fig. 4
ERK inhibition enhances vein colonization. A QPCR analysis of ERK expression on E15 aortae and JVs samples, each dot corresponds to one vessel graft. Expression levels in JVs are set as 1. **P < 0.01 by comparison with E15 JVs, Mann–Whitney test. B Top: Western blot of p-ERK, total ERK and tubulin in E8 and E15 JVs. Avian ERK migrates at 44 kD. Each lane represents one JV sample. Bottom: Western blot quantification, each dot corresponds to one JV sample. **P < 0.01, Mann–Whitney tests. C Quantification of effect of ERK inhibitor treatment on host venous colonization by QH1 + ECs from E15 JVs, each dot corresponds to one JV sample. By comparison with E15 JVs, Unpaired 2-tailed nonparametric t tests. D Effects of treatment with phosphatase inhibitors (SOV, E/Z-BCI, Fostriecin, Salubrinal, ML119) with or without ERK inhibition on host venous colonization by QH1 + ECs from E15 JVs, each dot corresponds to one JV sample. *P < 0.05, **P < 0.01, ***P < 0.001, ****P < 0.0001 by comparison with E15 JVs, Unpaired 2-tailed nonparametric t tests. Error bars: SEM, n number of grafts. The blue numbers correspond to the total number of cells counted in each condition
Fig. 5
Fig. 5
BMP signaling promotes venous fate. AD QPCR analyses of ALK2, ALK1, ALK3 and ALK6 expression in E8 and E15 JVs. Each dot corresponds to one sample. Expression levels in E8 JVs are set as 1. **P < 0.01, ***P < 0.001, Mann–Whitney tests. E Quantification of BMP effects on host venous colonization by QH1 + ECs from E8 JVs, each dot corresponds to one JV sample. *P < 0.05, **P < 0.01, ****P < 0.0001, by comparison with E8 JVs, Mann–Whitney or Unpaired 2-tailed nonparametric t tests. F Quantification of BMP effects on host arterial colonization by QH1 + ECs from E15 aortae, each dot corresponds to one aorta sample. *P < 0.05, **P < 0.01, ***P < 0.001, by comparison with E15 aortae, Unpaired 2-tailed nonparametric t tests. G Quantification of BMP inhibitor effects on host venous colonization by QH1 + ECs from E15 JVs, each dot corresponds to one JV sample. **P < 0.01, ****P < 0.0001, by comparison with E15 JVs, Unpaired 2-tailed nonparametric t tests. H Quantification of HDAC 1 inhibitor effect on host venous colonization by QH1 + ECs from E15 JVs, each dot corresponds to one JV sample. ****P < 0.0001, by comparison with E15 JVs, Unpaired 2-tailed nonparametric t test. Error bars: SEM, n number of grafts. The blue and red numbers correspond to the total number of cells counted in each condition
Fig. 6
Fig. 6
Summary model. Venous colonization in quail chick embryo chimeras is enhanced by NE activation of ADRα2B, ERK inhibition and BMP stimulation, while arterial differentiation is enhanced by ERK activation and BMP inhibition using Noggin

Similar articles

Cited by

References

    1. Aird WC. Endothelial cell heterogeneity. Cold Spring Harb Perspect Med. 2012 doi: 10.1101/cshperspect.a006429. - DOI - PMC - PubMed
    1. Kalluri AS, Vellarikkal SK, Edelman ER, Nguyen L, Subramanian A, Ellinor PT, Regev A, Kathiresan S, Gupta RM. Single-cell analysis of the normal mouse aorta reveals functionally distinct endothelial cell populations. Circulation. 2019;140:147–163. - PMC - PubMed
    1. Kalucka J, de Rooij LPMH, Goveia J, Rohlenova K, Dumas SJ, Meta E, Conchinha NV, Taverna F, Teuwen LA, Veys K, et al. Single-cell transcriptome atlas of murine endothelial cells. Cell. 2020;180:764–779. - PubMed
    1. Vanlandewijck M, He L, Mäe MA, Andrae J, Ando K, Del Gaudio F, Nahar K, Lebouvier T, Laviña B, Gouveia L, et al. A molecular atlas of cell types and zonation in the brain vasculature. Nature. 2018;554:475–480. - PubMed
    1. Zarkada G, Howard JP, Xiao X, Park H, Bizou M, Leclerc S, Künzel SE, Boisseau B, Li J, Cagnone G, et al. Specialized endothelial tip cells guide neuroretina vascularization and blood-retina-barrier formation. Dev Cell. 2021;56:2237–2251. - PMC - PubMed

LinkOut - more resources