

Multicenter Study on COVID-19 Lung Computed Tomography Segmentation with varying Glass Ground Opacities using Unseen Deep Learning Artificial Intelligence Paradigms: COVLIAS 1.0 Validation
- PMID: 35988110
- PMCID: PMC9392994
- DOI: 10.1007/s10916-022-01850-y
Multicenter Study on COVID-19 Lung Computed Tomography Segmentation with varying Glass Ground Opacities using Unseen Deep Learning Artificial Intelligence Paradigms: COVLIAS 1.0 Validation
Abstract
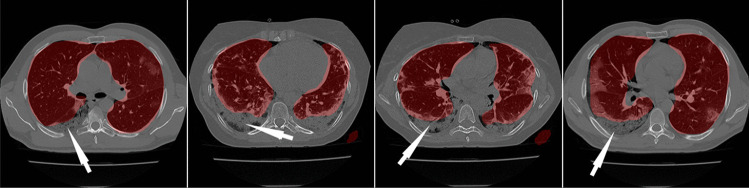
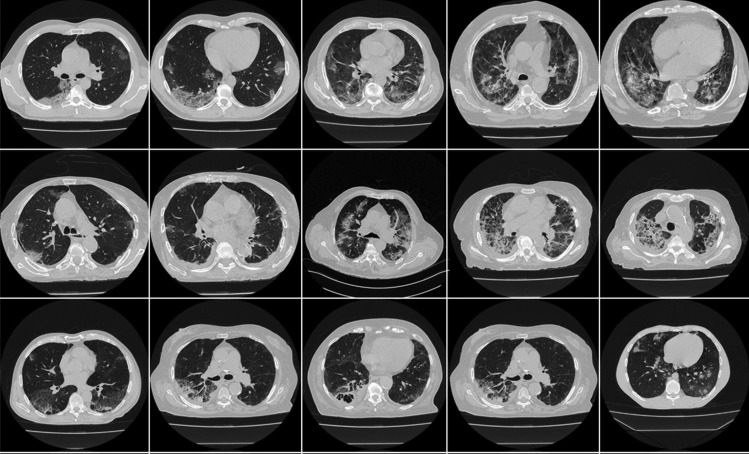
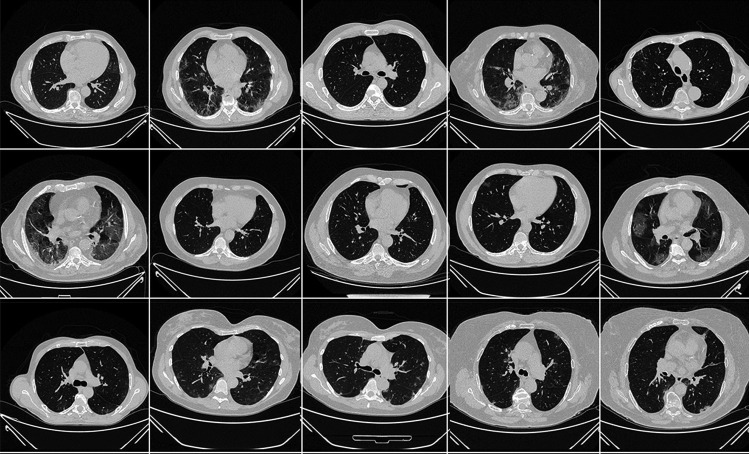
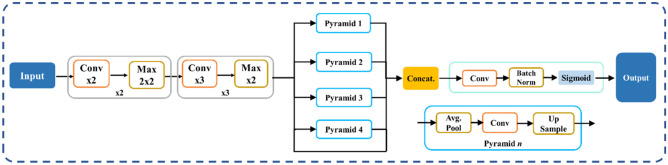
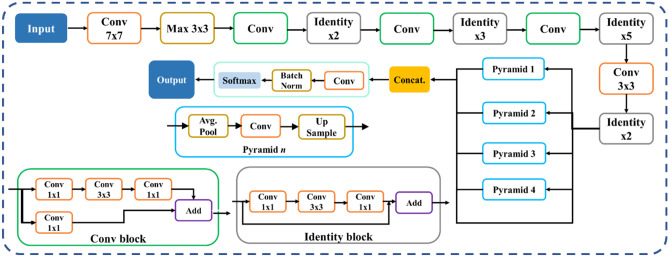
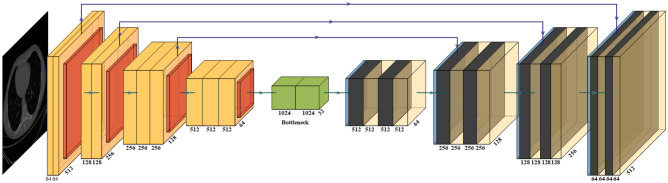
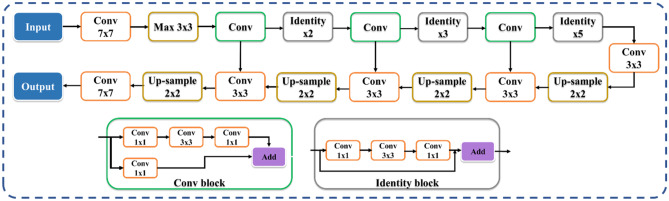
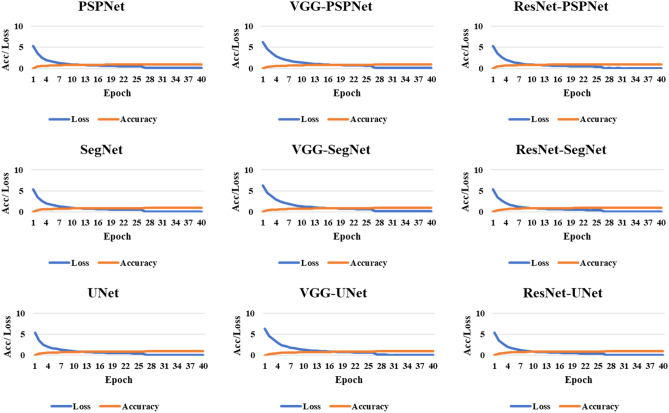
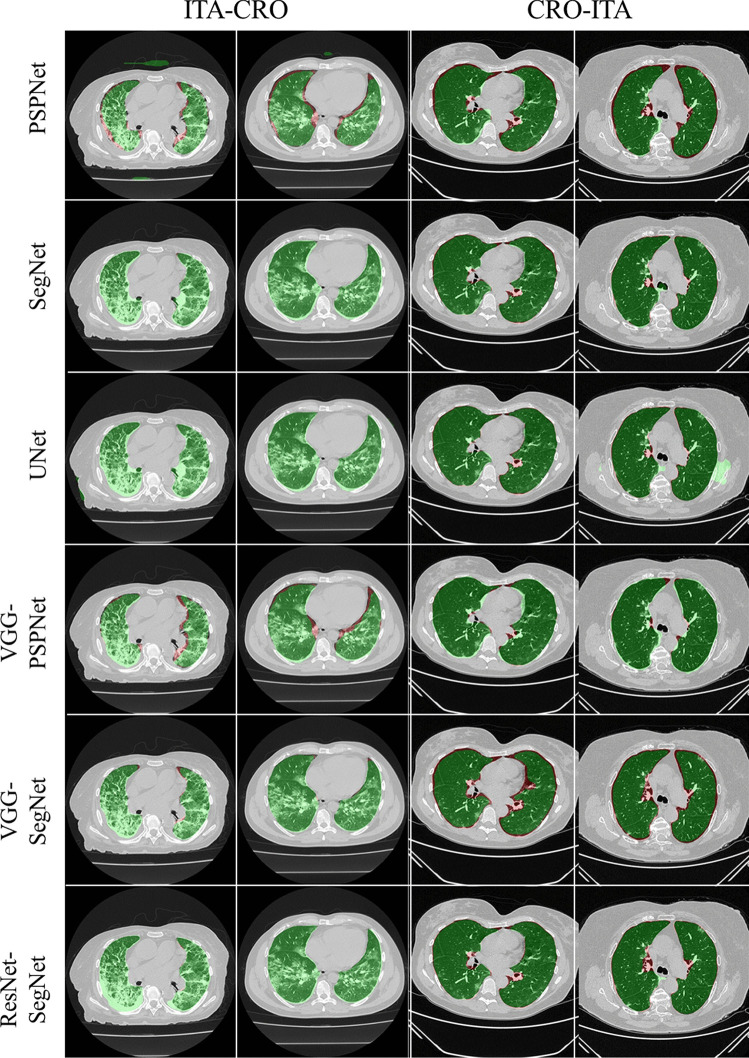
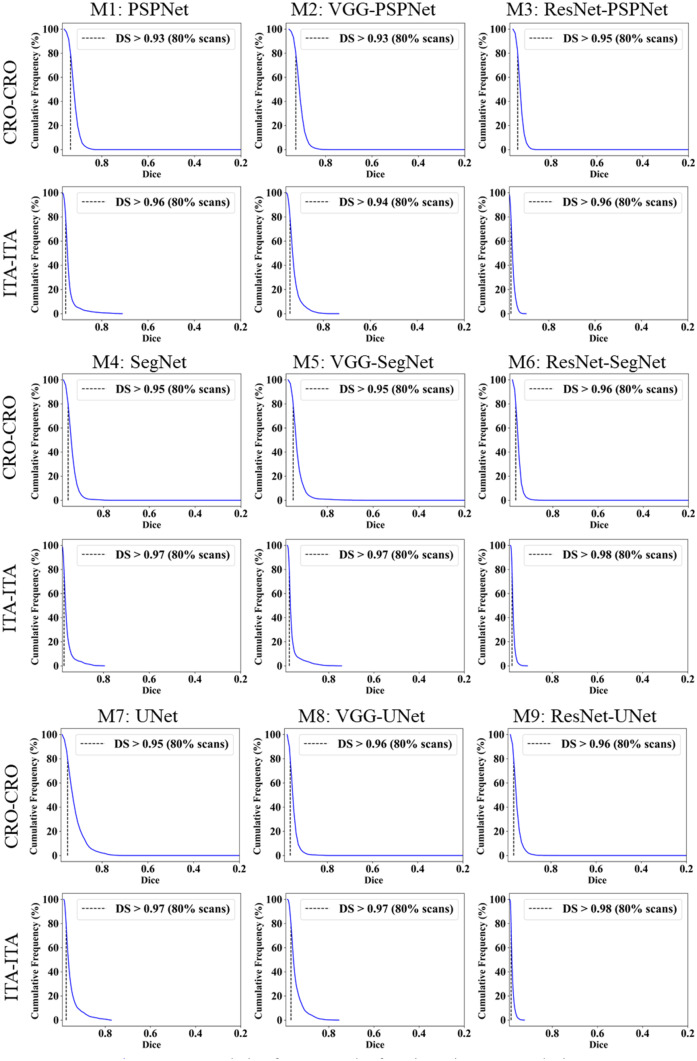
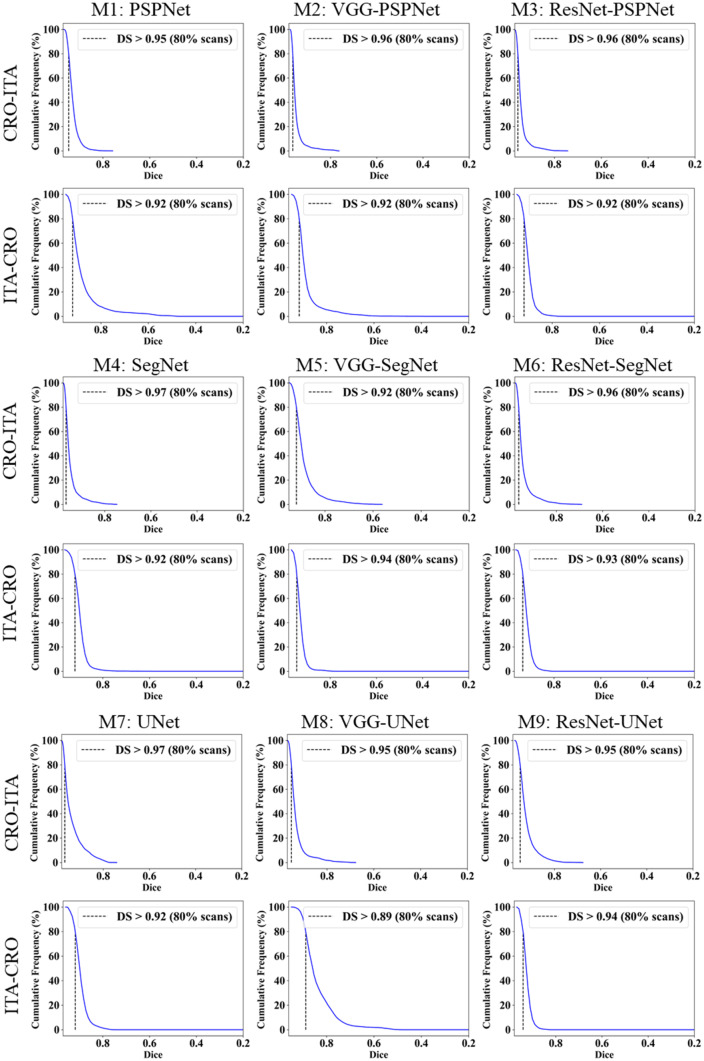
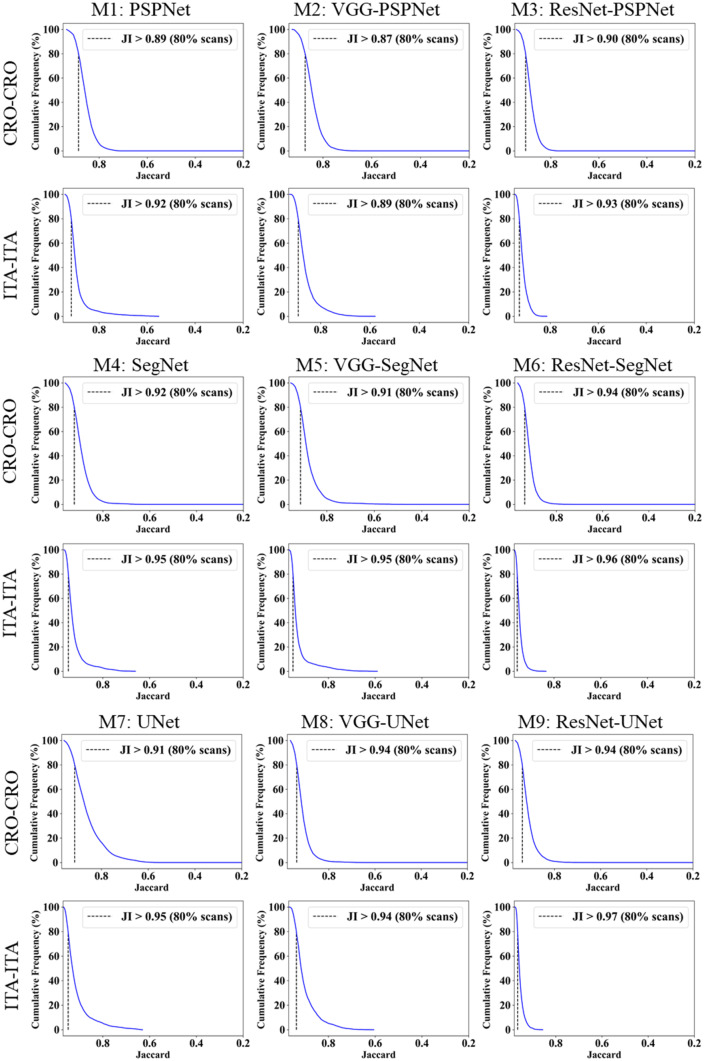
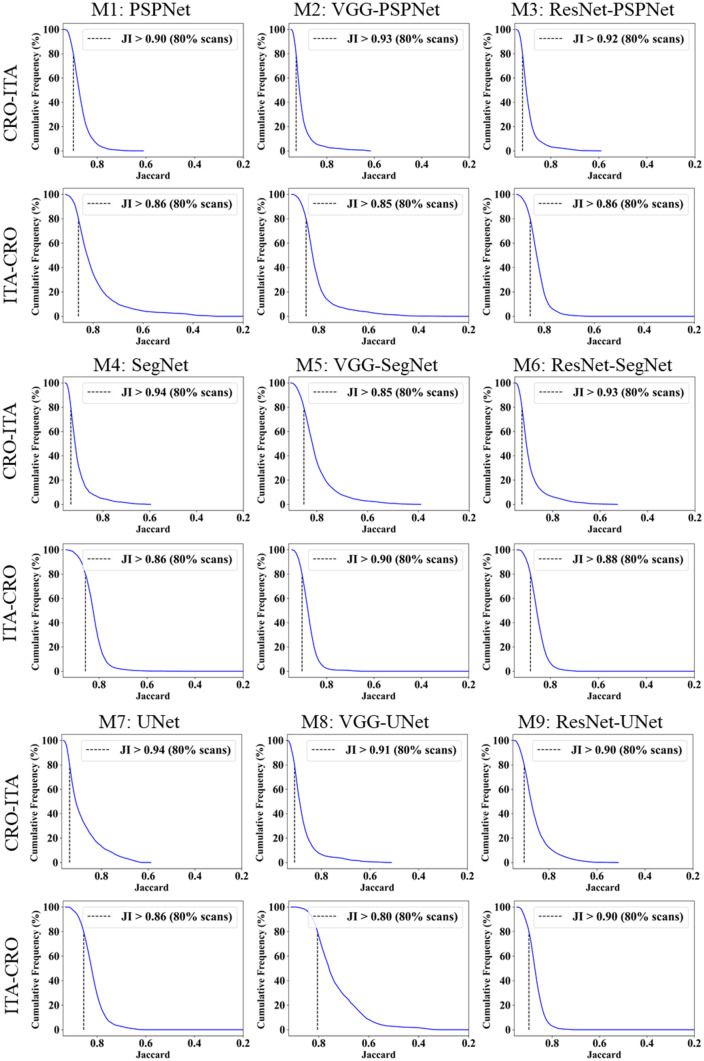
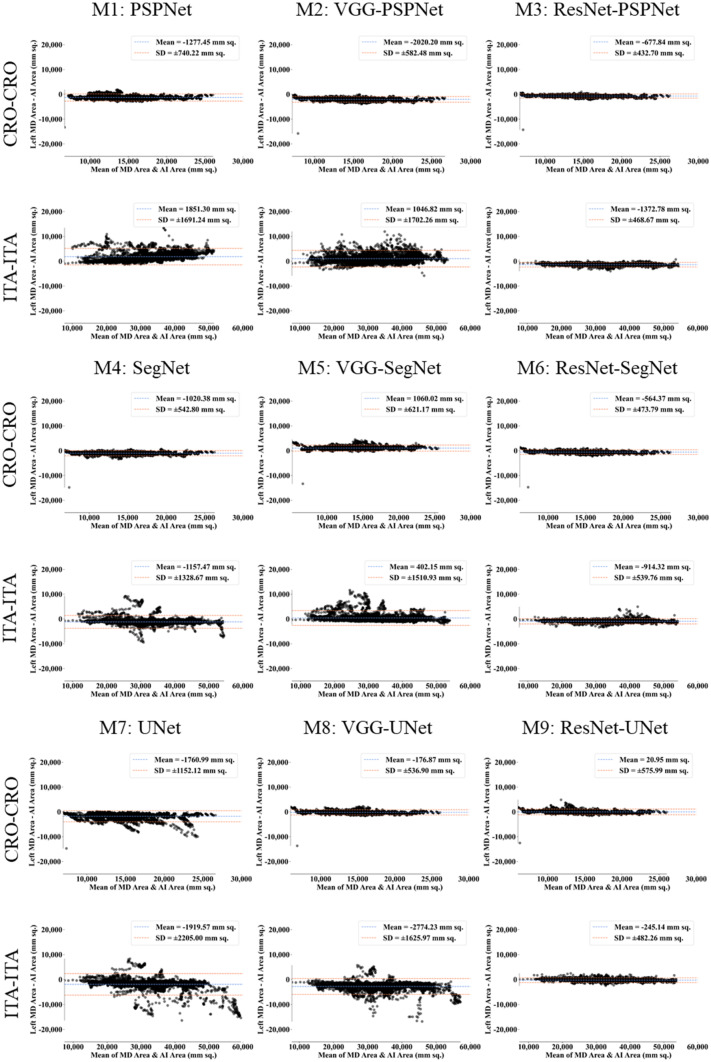
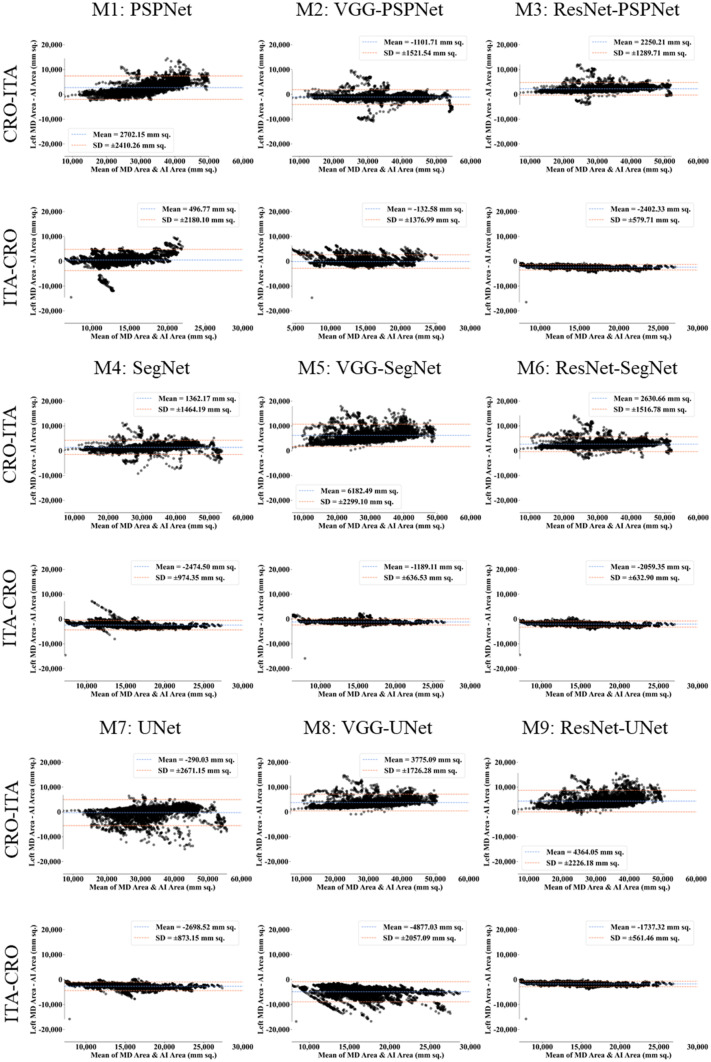
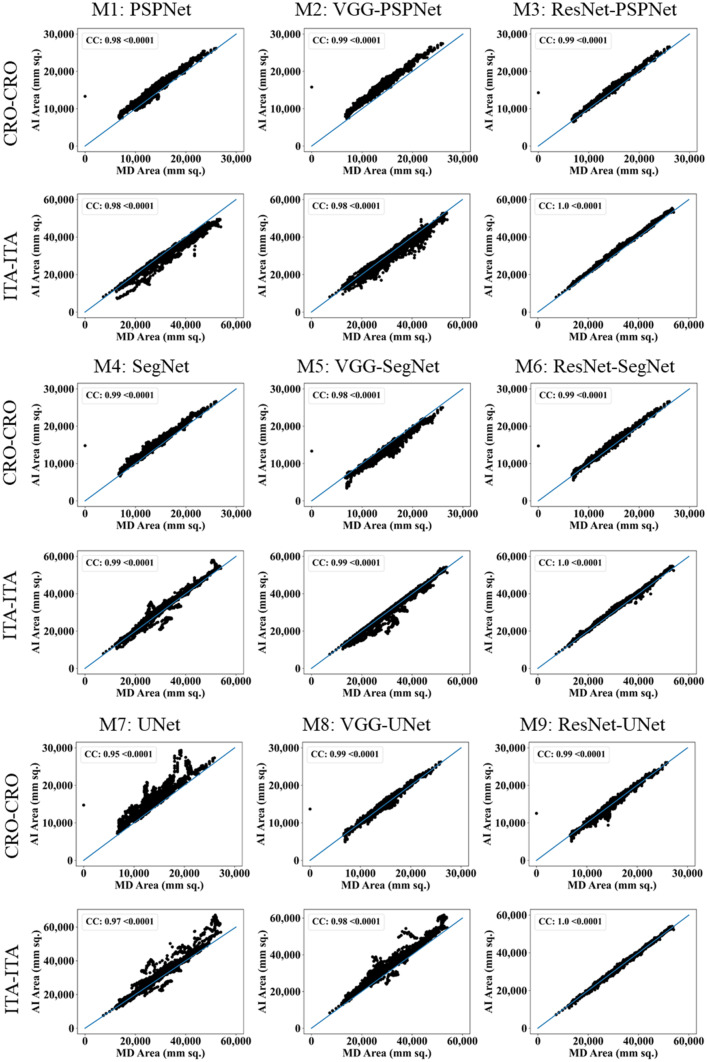
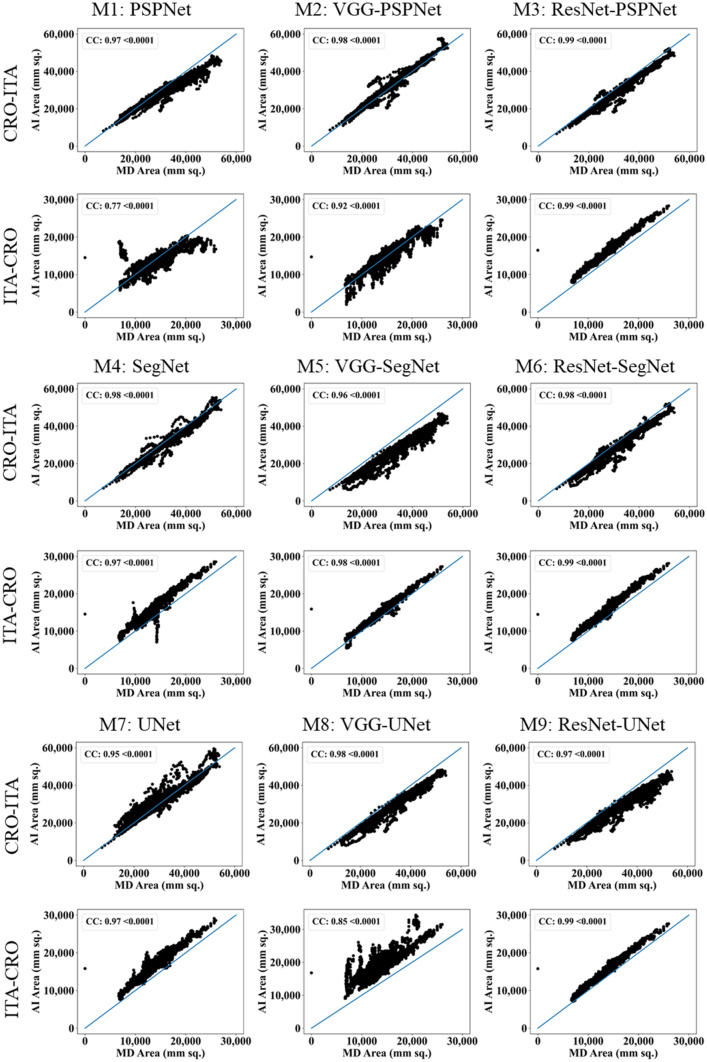
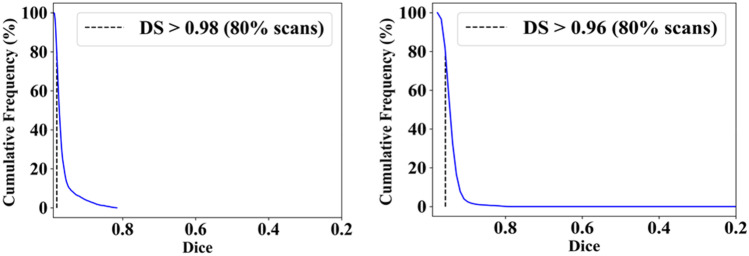
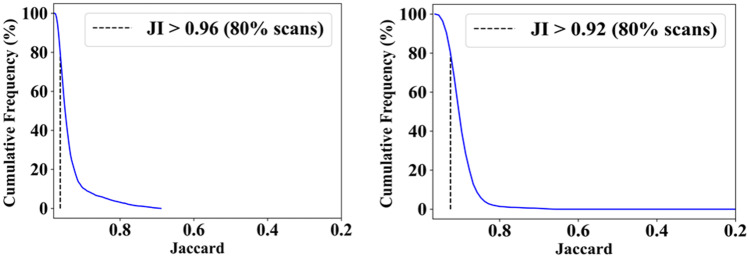
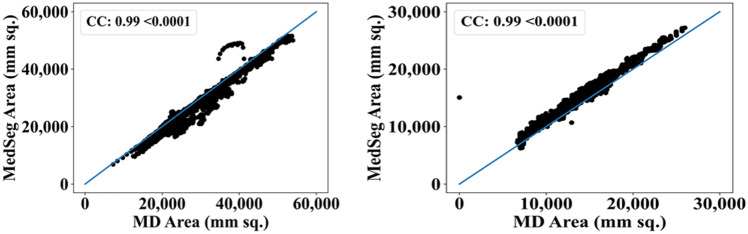
Variations in COVID-19 lesions such as glass ground opacities (GGO), consolidations, and crazy paving can compromise the ability of solo-deep learning (SDL) or hybrid-deep learning (HDL) artificial intelligence (AI) models in predicting automated COVID-19 lung segmentation in Computed Tomography (CT) from unseen data leading to poor clinical manifestations. As the first study of its kind, "COVLIAS 1.0-Unseen" proves two hypotheses, (i) contrast adjustment is vital for AI, and (ii) HDL is superior to SDL. In a multicenter study, 10,000 CT slices were collected from 72 Italian (ITA) patients with low-GGO, and 80 Croatian (CRO) patients with high-GGO. Hounsfield Units (HU) were automatically adjusted to train the AI models and predict from test data, leading to four combinations-two Unseen sets: (i) train-CRO:test-ITA, (ii) train-ITA:test-CRO, and two Seen sets: (iii) train-CRO:test-CRO, (iv) train-ITA:test-ITA. COVILAS used three SDL models: PSPNet, SegNet, UNet and six HDL models: VGG-PSPNet, VGG-SegNet, VGG-UNet, ResNet-PSPNet, ResNet-SegNet, and ResNet-UNet. Two trained, blinded senior radiologists conducted ground truth annotations. Five types of performance metrics were used to validate COVLIAS 1.0-Unseen which was further benchmarked against MedSeg, an open-source web-based system. After HU adjustment for DS and JI, HDL (Unseen AI) > SDL (Unseen AI) by 4% and 5%, respectively. For CC, HDL (Unseen AI) > SDL (Unseen AI) by 6%. The COVLIAS-MedSeg difference was < 5%, meeting regulatory guidelines.Unseen AI was successfully demonstrated using automated HU adjustment. HDL was found to be superior to SDL.
Keywords: And AI; COVID-19; Glass ground opacities; Hounsfield units; Hybrid deep learning; Lung CT; Segmentation; Solo deep learning.
© 2022. The Author(s), under exclusive licence to Springer Science+Business Media, LLC, part of Springer Nature.
Conflict of interest statement
There are no Conflict of Interest.
Figures
Similar articles
-
COVLIAS 1.0 vs. MedSeg: Artificial Intelligence-Based Comparative Study for Automated COVID-19 Computed Tomography Lung Segmentation in Italian and Croatian Cohorts.Diagnostics (Basel). 2021 Dec 15;11(12):2367. doi: 10.3390/diagnostics11122367. Diagnostics (Basel). 2021. PMID: 34943603 Free PMC article.
-
COVLIAS 1.0: Lung Segmentation in COVID-19 Computed Tomography Scans Using Hybrid Deep Learning Artificial Intelligence Models.Diagnostics (Basel). 2021 Aug 4;11(8):1405. doi: 10.3390/diagnostics11081405. Diagnostics (Basel). 2021. PMID: 34441340 Free PMC article.
-
Eight pruning deep learning models for low storage and high-speed COVID-19 computed tomography lung segmentation and heatmap-based lesion localization: A multicenter study using COVLIAS 2.0.Comput Biol Med. 2022 Jul;146:105571. doi: 10.1016/j.compbiomed.2022.105571. Epub 2022 May 21. Comput Biol Med. 2022. PMID: 35751196 Free PMC article.
-
Artificial intelligence-based deep learning algorithms for ground-glass opacity nodule detection: A review.Narra J. 2025 Apr;5(1):e1361. doi: 10.52225/narra.v5i1.1361. Epub 2025 Mar 5. Narra J. 2025. PMID: 40352244 Free PMC article. Review.
-
Artificial intelligence-based hybrid deep learning models for image classification: The first narrative review.Comput Biol Med. 2021 Oct;137:104803. doi: 10.1016/j.compbiomed.2021.104803. Epub 2021 Aug 27. Comput Biol Med. 2021. PMID: 34536856 Review.
Cited by
-
Role of Ensemble Deep Learning for Brain Tumor Classification in Multiple Magnetic Resonance Imaging Sequence Data.Diagnostics (Basel). 2023 Jan 28;13(3):481. doi: 10.3390/diagnostics13030481. Diagnostics (Basel). 2023. PMID: 36766587 Free PMC article.
-
Attention-Enabled Ensemble Deep Learning Models and Their Validation for Depression Detection: A Domain Adoption Paradigm.Diagnostics (Basel). 2023 Jun 16;13(12):2092. doi: 10.3390/diagnostics13122092. Diagnostics (Basel). 2023. PMID: 37370987 Free PMC article.
-
Four Transformer-Based Deep Learning Classifiers Embedded with an Attention U-Net-Based Lung Segmenter and Layer-Wise Relevance Propagation-Based Heatmaps for COVID-19 X-ray Scans.Diagnostics (Basel). 2024 Jul 16;14(14):1534. doi: 10.3390/diagnostics14141534. Diagnostics (Basel). 2024. PMID: 39061671 Free PMC article.
-
GeneAI 3.0: powerful, novel, generalized hybrid and ensemble deep learning frameworks for miRNA species classification of stationary patterns from nucleotides.Sci Rep. 2024 Mar 26;14(1):7154. doi: 10.1038/s41598-024-56786-9. Sci Rep. 2024. PMID: 38531923 Free PMC article.
-
Polygenic Risk Score for Cardiovascular Diseases in Artificial Intelligence Paradigm: A Review.J Korean Med Sci. 2023 Nov 27;38(46):e395. doi: 10.3346/jkms.2023.38.e395. J Korean Med Sci. 2023. PMID: 38013648 Free PMC article. Review.
References
-
- WHO Coronavirus (COVID-19) Dashboard. Available online: https://covid19.who.int/ (accessed on 24 Jan 2022).
-
- Saba L, Gerosa C, Fanni D, Marongiu F, La Nasa G, Caocci G, Barcellona D, Balestrieri A, Coghe F, Orru G, et al. Molecular pathways triggered by COVID-19 in different organs: ACE2 receptor-expressing cells under attack? A review. Eur Rev Med Pharmacol Sci. 2020;24:12609–12622. doi: 10.26355/eurrev_202012_24058. - DOI - PubMed
-
- Suri JS, Puvvula A, Biswas M, Majhail M, Saba L, Faa G, Singh IM, Oberleitner R, Turk M, Chadha PS, et al. COVID-19 pathways for brain and heart injury in comorbidity patients: A role of medical imaging and artificial intelligence-based COVID severity classification: A review. Comput Biol Med. 2020;124:103960. doi: 10.1016/j.compbiomed.2020.103960. - DOI - PMC - PubMed
Publication types
MeSH terms
LinkOut - more resources
Full Text Sources
Medical
Research Materials
