

Deep learning-based automated segmentation of resection cavities on postsurgical epilepsy MRI
- PMID: 35988342
- PMCID: PMC9402390
- DOI: 10.1016/j.nicl.2022.103154
Deep learning-based automated segmentation of resection cavities on postsurgical epilepsy MRI
Abstract
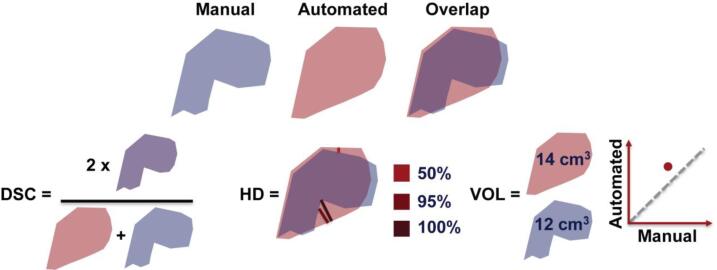
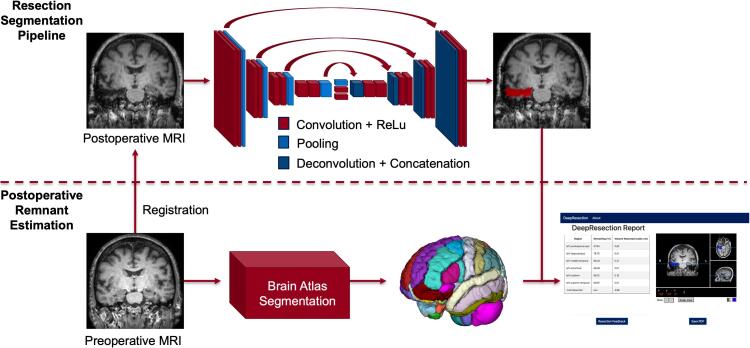
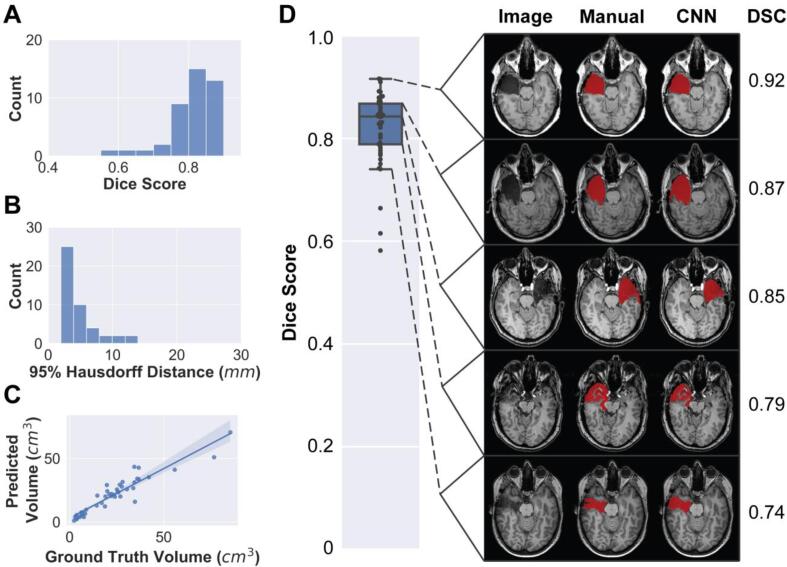
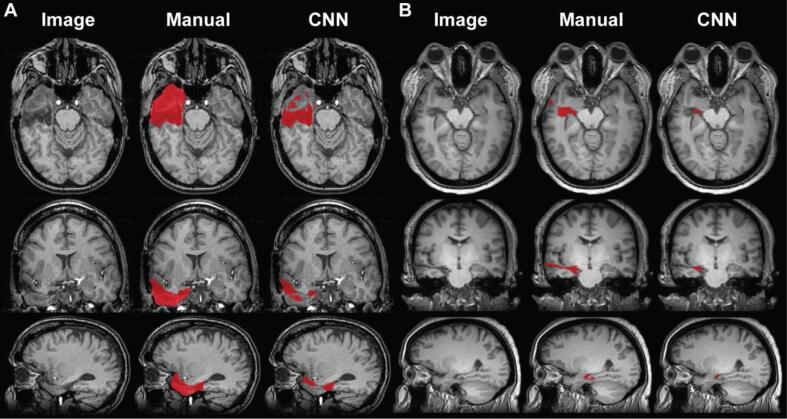
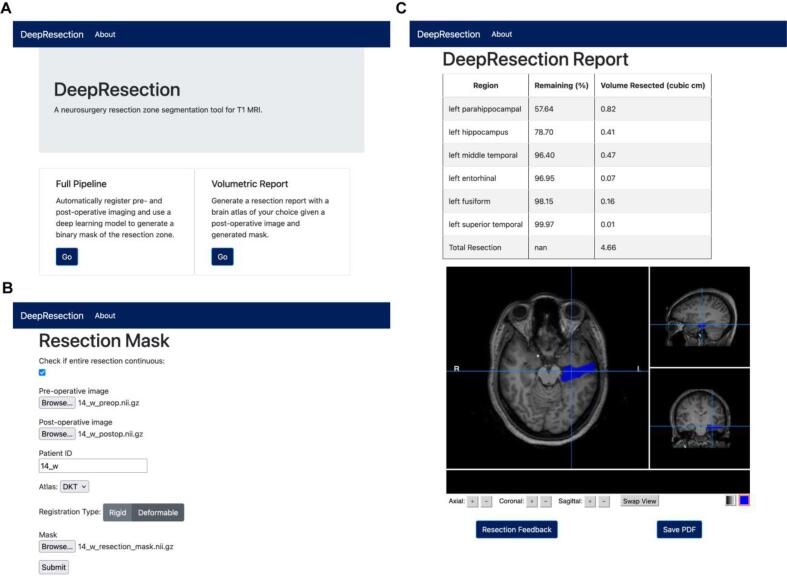
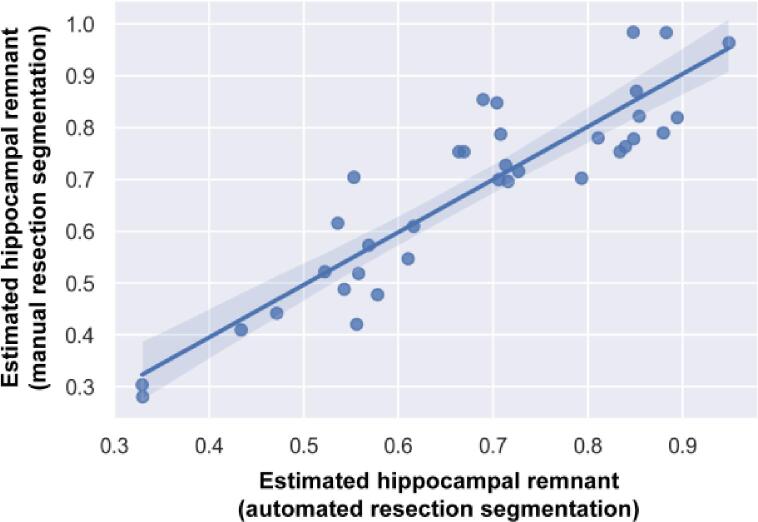
Accurate segmentation of surgical resection sites is critical for clinical assessments and neuroimaging research applications, including resection extent determination, predictive modeling of surgery outcome, and masking image processing near resection sites. In this study, an automated resection cavity segmentation algorithm is developed for analyzing postoperative MRI of epilepsy patients and deployed in an easy-to-use graphical user interface (GUI) that estimates remnant brain volumes, including postsurgical hippocampal remnant tissue. This retrospective study included postoperative T1-weighted MRI from 62 temporal lobe epilepsy (TLE) patients who underwent resective surgery. The resection site was manually segmented and reviewed by a neuroradiologist (JMS). A majority vote ensemble algorithm was used to segment surgical resections, using 3 U-Net convolutional neural networks trained on axial, coronal, and sagittal slices, respectively. The algorithm was trained using 5-fold cross validation, with data partitioned into training (N = 27) testing (N = 9), and validation (N = 9) sets, and evaluated on a separate held-out test set (N = 17). Algorithm performance was assessed using Dice-Sørensen coefficient (DSC), Hausdorff distance, and volume estimates. Additionally, we deploy a fully-automated, GUI-based pipeline that compares resection segmentations with preoperative imaging and reports estimates of resected brain structures. The cross-validation and held-out test median DSCs were 0.84 ± 0.08 and 0.74 ± 0.22 (median ± interquartile range) respectively, which approach inter-rater reliability between radiologists (0.84-0.86) as reported in the literature. Median 95 % Hausdorff distances were 3.6 mm and 4.0 mm respectively, indicating high segmentation boundary confidence. Automated and manual resection volume estimates were highly correlated for both cross-validation (r = 0.94, p < 0.0001) and held-out test subjects (r = 0.87, p < 0.0001). Automated and manual segmentations overlapped in all 62 subjects, indicating a low false negative rate. In control subjects (N = 40), the classifier segmented no voxels (N = 33), <50 voxels (N = 5), or a small volumes<0.5 cm3 (N = 2), indicating a low false positive rate that can be controlled via thresholding. There was strong agreement between postoperative hippocampal remnant volumes determined using automated and manual resection segmentations (r = 0.90, p < 0.0001, mean absolute error = 6.3 %), indicating that automated resection segmentations can permit quantification of postoperative brain volumes after epilepsy surgery. Applications include quantification of postoperative remnant brain volumes, correction of deformable registration, and localization of removed brain regions for network modeling.
Keywords: Automated segmentation; Convolutional neural network; Hippocampal remnant; Postoperative MRI; Resection cavity; Temporal lobe epilepsy.
Copyright © 2022 The Authors. Published by Elsevier Inc. All rights reserved.
Conflict of interest statement
Declaration of Competing Interest The authors declare that they have no known competing financial interests or personal relationships that could have appeared to influence the work reported in this paper.
Figures

References
-
- Abadi M., Barham P., Chen J., et al. Tensorflow: A system for large-scale machine learning. USENIX Symp. Oper. Syst. Des. Implement. 2016:265–283.
-
- Asadi-Pooya A.A., Stewart G.R., Abrams D.J., Sharan A. Prevalence and incidence of drug-resistant mesial temporal lobe epilepsy in the United States. World Neurosurgery. 2017;99:662–666. - PubMed
-
- Atsina K.-B., Gorniak R., Sharan A., Wu C. A Methodology for systematic volumetric analysis of perioperative cranial imaging in neurosurgical patients. JHN J. Thomas Jefferson University. 2016;11(2) doi: 10.29046/jhnj.011.2.002. - DOI
-
- Avants B.B., Tustison N., Song G. Advanced normalization tools (ANTS) Insight J. 2009;2:1–35.
-
- Bakas S, Reyes M, Jakab A, et al. Identifying the Best Machine Learning Algorithms for Brain Tumor Segmentation, Progression Assessment, and Overall Survival Prediction in the BRATS Challenge. 2018; http://arxiv.org/abs/1811.026Accessed July 18, 2019.
