Saccades during visual search in macular degeneration
- PMID: 35988396
- PMCID: PMC9869771
- DOI: 10.1016/j.visres.2022.108113
Saccades during visual search in macular degeneration
Abstract
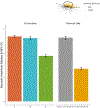
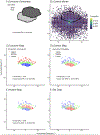
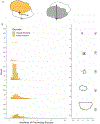
Macular degeneration (MD) compromises both high-acuity vision and eye movements when the foveal regions of both eyes are affected. Individuals with MD adapt to central field loss by adopting a preferred retinal locus (PRL) for fixation. Here, we investigate how individuals with bilateral MD use eye movements to search for targets in a visual scene under realistic binocular viewing conditions. Five individuals with binocular scotomata, 3 individuals with monocular scotomata and 6 age-matched controls participated in our study. We first extensively mapped the binocular scotoma with an eyetracker, while fixation was carefully monitored (Vullings & Verghese, 2020). Participants then completed a visual search task where 0, 1, or 2 Gaussian blobs were distributed randomly across a natural scene. Participants were given 10 s to actively search the display and report the number of blobs. An analysis of saccade characteristics showed that individuals with binocular scotomata made more saccades in the direction of their scotoma than controls for the same directions. Saccades in the direction of the scotoma were typically of small amplitude, and did not fully uncover the region previously hidden by the scotoma. Rather than make more saccades to explore this hidden region, participants frequently made saccades back toward newly uncovered regions. Backward saccades likely serve a similar purpose to regressive saccades exhibited during reading in MD, by inspecting previously covered regions near the direction of gaze. Our analysis suggests that the higher prevalence of backward saccades in individuals with binocular scotomata might be related to the PRL being adjacent to the scotoma.
Keywords: Backward/regressive saccade; Binocular scotoma; Macular degeneration; Visual search.
Copyright © 2022 Elsevier Ltd. All rights reserved.
Conflict of interest statement
Declaration of Competing Interest The authors declare that they have no known competing financial interests or personal relationships that could have appeared to influence the work reported in this paper.
Figures


Similar articles
-
Mapping the binocular scotoma in macular degeneration.J Vis. 2021 Mar 1;21(3):9. doi: 10.1167/jov.21.3.9. J Vis. 2021. PMID: 33666643 Free PMC article.
-
Eccentric fixation with macular scotoma.Invest Ophthalmol Vis Sci. 1988 Feb;29(2):268-78. Invest Ophthalmol Vis Sci. 1988. PMID: 3338884
-
Training eye movements for visual search in individuals with macular degeneration.J Vis. 2016 Dec 1;16(15):29. doi: 10.1167/16.15.29. J Vis. 2016. PMID: 28027382 Free PMC article.
-
Binocular visual function and fixational control in patients with macular disease: A review.Ophthalmic Physiol Opt. 2022 Mar;42(2):258-271. doi: 10.1111/opo.12925. Epub 2021 Dec 4. Ophthalmic Physiol Opt. 2022. PMID: 34862635 Free PMC article. Review.
-
Eye Movements in Macular Degeneration.Annu Rev Vis Sci. 2021 Sep 15;7:773-791. doi: 10.1146/annurev-vision-100119-125555. Epub 2021 May 26. Annu Rev Vis Sci. 2021. PMID: 34038144 Free PMC article. Review.
Cited by
-
Eye movements in visual impairment.Vision Res. 2023 Oct;211:108296. doi: 10.1016/j.visres.2023.108296. Epub 2023 Jul 26. Vision Res. 2023. PMID: 37506496 Free PMC article.
-
Visual search and childhood vision impairment: A GAMLSS-oriented multiverse analysis approach.Atten Percept Psychophys. 2023 May;85(4):968-977. doi: 10.3758/s13414-023-02670-z. Epub 2023 Feb 23. Atten Percept Psychophys. 2023. PMID: 36823260 Free PMC article.
-
Visual function and biofeedback training of patients with central vision loss: a review.Int J Ophthalmol. 2023 May 18;16(5):824-831. doi: 10.18240/ijo.2023.05.21. eCollection 2023. Int J Ophthalmol. 2023. PMID: 37206180 Free PMC article. Review.
-
Oculomotor challenges in macular degeneration impact motion extrapolation.J Vis. 2025 Jan 2;25(1):17. doi: 10.1167/jov.25.1.17. J Vis. 2025. PMID: 39878697 Free PMC article.
References
-
- Arditi A (1988) Volume visual field: a basis for clinical perimetry. Clinical Vision Sci. 3, 173–183.
-
- Calabrèse A, Bernard J-B, Faure G, Hoffart L, Castet E. (2014). Eye movements and reading speed in macular disease: the shrinking per- ceptual span hypothesis requires and is supported by a mediation analysis. Invest Ophthalmol Vis Sci 55:3638–3645. - PubMed
Publication types
MeSH terms
Grants and funding
LinkOut - more resources
Full Text Sources
Medical

