. 2022 Sep 1;185(18):3290-3306.e25.
doi: 10.1016/j.cell.2022.07.028. Epub 2022 Aug 1.

Post-gastrulation synthetic embryos generated ex utero from mouse naive ESCs

Affiliations

Post-gastrulation synthetic embryos generated ex utero from mouse naive ESCs

Shadi Tarazi et al. Cell. .

Abstract

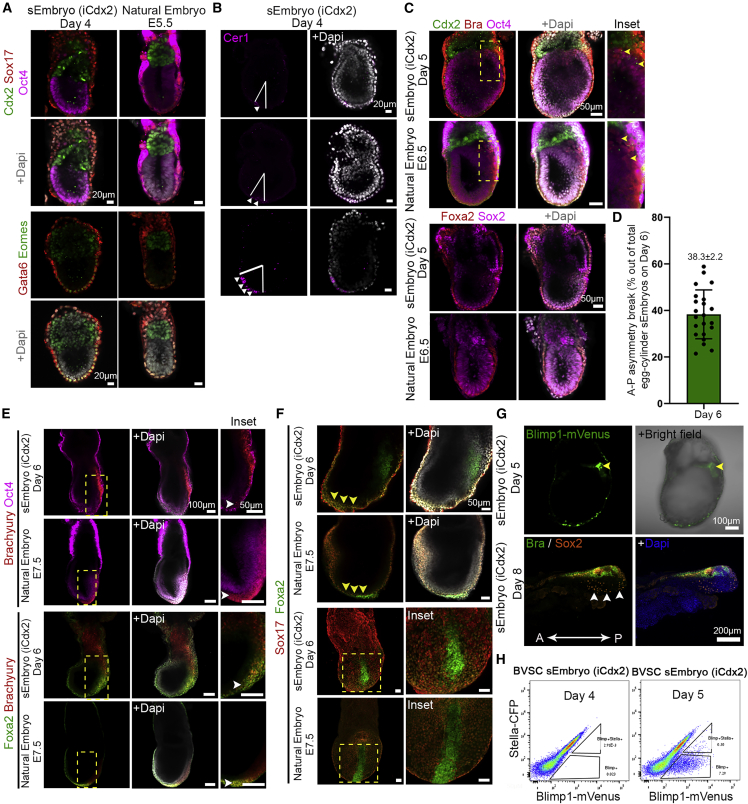
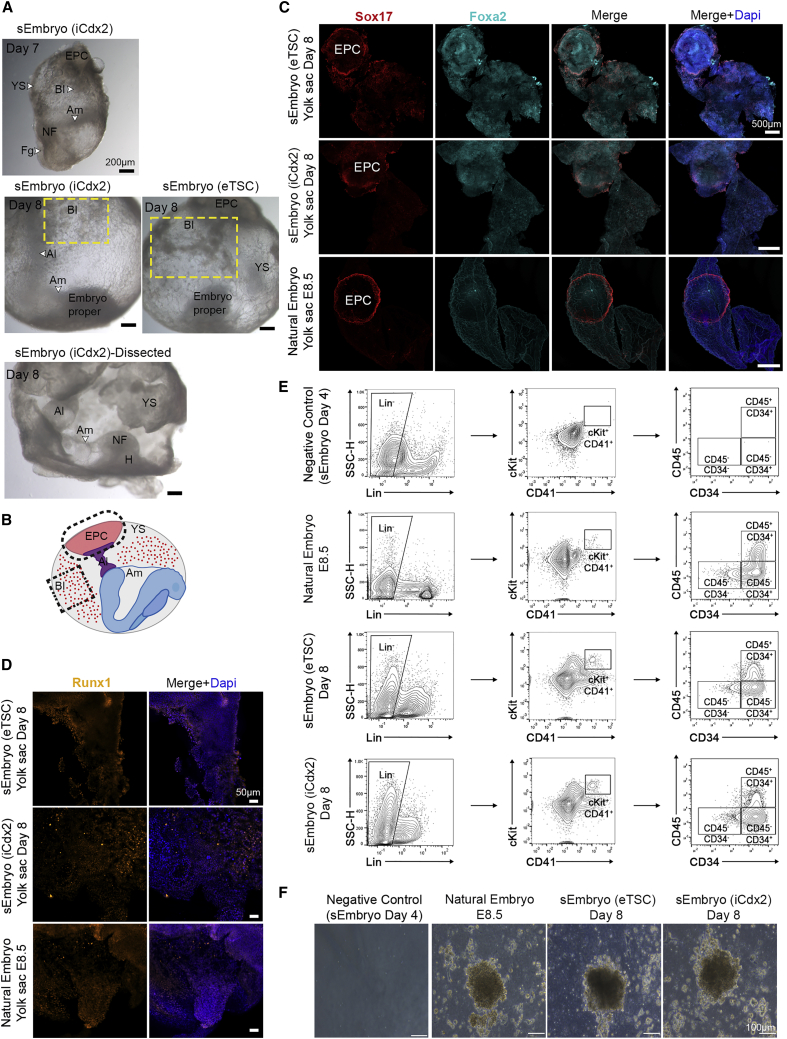
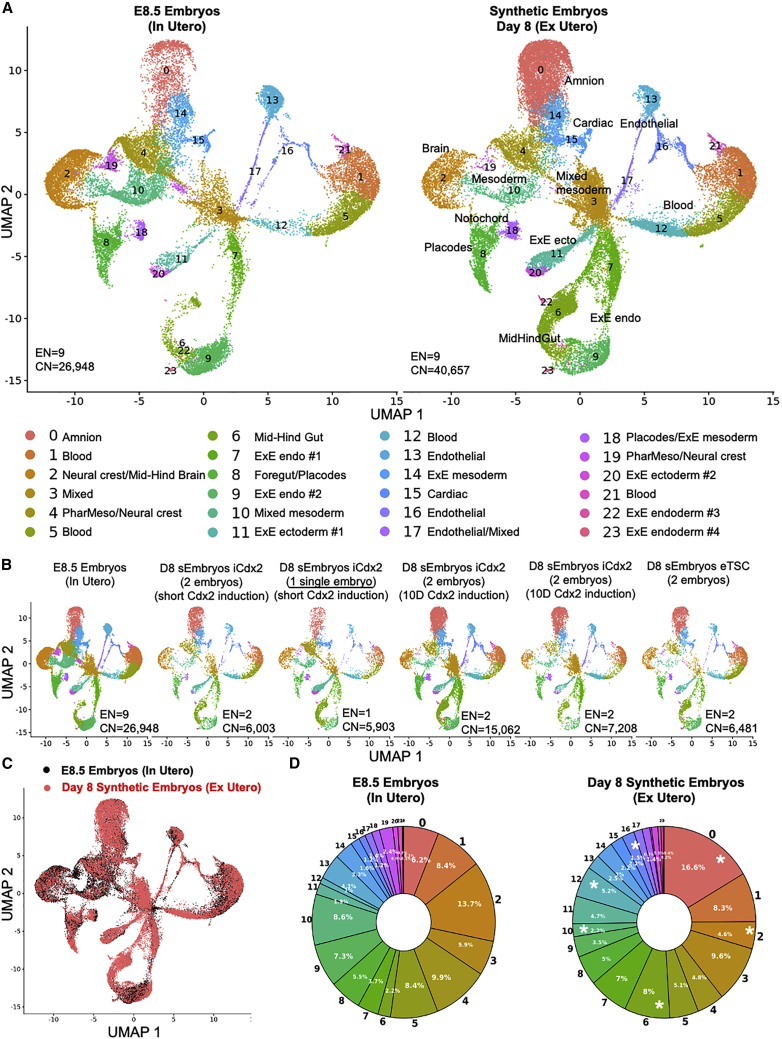
In vitro cultured stem cells with distinct developmental capacities can contribute to embryonic or extraembryonic tissues after microinjection into pre-implantation mammalian embryos. However, whether cultured stem cells can independently give rise to entire gastrulating embryo-like structures with embryonic and extraembryonic compartments remains unknown. Here, we adapt a recently established platform for prolonged ex utero growth of natural embryos to generate mouse post-gastrulation synthetic whole embryo models (sEmbryos), with both embryonic and extraembryonic compartments, starting solely from naive ESCs. This was achieved by co-aggregating non-transduced ESCs, with naive ESCs transiently expressing Cdx2 or Gata4 to promote their priming toward trophectoderm and primitive endoderm lineages, respectively. sEmbryos adequately accomplish gastrulation, advance through key developmental milestones, and develop organ progenitors within complex extraembryonic compartments similar to E8.5 stage mouse embryos. Our findings highlight the plastic potential of naive pluripotent cells to self-organize and functionally reconstitute and model the entire mammalian embryo beyond gastrulation.

Keywords: ESCs; PGCs; embryogenesis; embryoids; ex utero; extra-embryonic Tissues; iPSCs; naive pluripotency; synthetic embryos.


Conflict of interest statement

Declaration of interests J.H.H. has submitted patent applications relevant to the findings reported herein and is a chief scientific advisor of Renewal Bio Inc., which has licensed technologies described herein.

Figures

None
Graphical abstract
Figure 1
Figure 1
Proper self-allocation of naive ESC-derived cells in sEmbryos following transient ectopic expression of Cdx2 and Gata4 (A) Scheme demonstrating screening strategy for efficient TSC induction using iCdx2 Elf5-YFP reporter ESC line. (B) Fraction of Elf5 expressing cells measured by flow cytometry after different times of DOX mediated Cdx2 induction in TSC medium (TSCm) with or without 1μM LPA. (C) Spearman correlation matrix between expression profiles of mouse embryonic fibroblasts (MEFs), naive ESCs, XEN cells, embryo-derived TSC lines (eTSC) and DOX-induced Cdx2 ESCs under TSCm culture conditions at different time points (with or without LPA). (D) Shematic of fluorescent labeling strategy of different naive ESC line followed by co-aggregation and self-assembly of egg-cylinder-shaped synthetic embryos (sEmbryos). iGata4 and iCdx2 ESCs were exposed to DOX from 24 h before until 48 h after co-aggregation. (E) Microscope fluorescent imaging and flow cytometry of BFP-, GFP-, and mCherry-labeled ESCs. (F) Live confocal imaging of egg-cylinder-shaped sEmbryos after 3 to 5 days of aggregation. A random field is shown in the upper panel, and an image of a single sEmbryo with proper segregation is shown in the lower panel. (G) Percentage of egg-cylinder-shaped sEmbryos presenting proper segregation of lineages. Dots represent efficiency percentage in random fields of view; data are mean ± SEM. (H) Middle-section immunostainings of day 4 sEmbryos stained for Epi (Oct4), ExE (Tfap2c), and VE (Sox17) markers.
Figure S1
Figure S1
Optimization of iCdx2 and iGata4 induction conditions, related to Figure 1 (A) Bright field images of TSC derived from ectopic expression of Cdx2 in naive ESCs over different indicated time points (upper panel), and immunostaining for TSCs markers Ap2 gamma, Cdx2, Elf5 and Tbr2/Eomes along with pluripotency markers Nanog and Oct4 in iCdx2 ESC (clone #3) induced with DOX in TSC media (TSCm) for short-term 72 h or long-term passage 7 TSC line (lower panel). Scale bar, 50μM. (B) RT-PCR analysis for TSC markers Hand1, Fgfr2, Elf5, Dppa1 and primitive endoderm markers Gata4, Gata6 and Pdgfra expression in iCdx2 clone #3 after DOX in TSC media supplemented with lysophosphatidic acid (LPA) 1μM. Analysis was done at different time points from 24h up to 120h. Values were normalized to Gapdh and compared to basal naive state expression level. (C) RT-PCR analysis for endogenous Cdx2 gene levels in iCdx2 clone 3 after treatment with DOX for different time points in TSC media supplemented with 1μM lysophosphatidic acid (LPA). Values were normalized to Gapdh and compared to basal naive state expression level. (D) Flow cytometry analysis presenting fraction of positive Elf5 population after treatment of iCdx2 with DOX in TSC media with 0.5 μM LPA for different time points up to 9 days, and fraction of positive Elf5 after short treatment with DOX for 3 days in TSC media with 0.5 μM LPA, then cultured the cell in TSC media with or without LPA for additional 3 days or 6 days. (E) Flow cytometry analysis presenting fraction of positive Elf5 population after treatment of DOX and culture in TSC media for 6 passages and 9 passages. (F) Fraction of positive Elf5 population after treatment of iCdx2 cells with DOX in TSCm for 3 days. Prior to DOX induction in TSCm, iCdx2 cells were cultured in primed Fgf/Activin, naive Serum/Lif or naive 2i/Lif condition for at least 3 passages. (G) RT-PCR analysis for trophectoderm markers Cdx2, Hand1, Dppa1, Fgfr2 and Elf5 expression in iCdx2 clone cultured in primed or naive conditions and induced with DOX for 72h in TSCm. (H) RT-PCR analysis for primitive endoderm markers Foxa2, Pdgfra, Gata6, Hnf4a and Sox17 expression and TSC markers Gata3 and Gata2 expression in representative Gata4 clone after treatment with DOX in 2i/Lif media. Analysis done at different time points from 24h up to 96h. (I) RT-PCR analysis for both endogenous and exogenous Gata4 expression in representative iGata4 clone after different time points of DOX treatment in 2i/Lif. (J) RT-PCR analysis for primitive endoderm markers Pdgfra, Gata4, Gata6 and Sox17 expression in iGata4 clone cultured in primed or naive conditions and induced with DOX for 24h in the same conditions. Values are normalized to Actin and/or Gapdh, compared to naive 2i/Lif ESCs. One-Way ANOVA; p Value <0.05; ∗∗p Value <0.005; ∗∗∗p Value <0.0005; ∗∗∗∗p Value <0.0001; ns, not significant.
Figure S2
Figure S2
Optimization of sEmbryos culture conditions, related to Figure 2 (A) The different fluorescently labeled donor naive ESC populations are indicated and used for co-aggregation as in Figure 1D. Representative examples of abnormally assembled sEmbryos at day 4 compared to properly patterned sEmbryos at this stage (Right side). (B) Normally developed whole sEmbryo at day 8 of the culture protocol (upper panel), further cultured to day 9 which currently leads to abnormally enlarged heart with massive pericardial effusion and no further adequate embryo proper development (lower panel). (C) Representative examples of cell number calibration and optimization experiments for generating sEmbryos. Representative bright field images of sEmbryos at day 6 of the culture protocol assembled from different ratios and number of WT ESC, iGata4 and iCdx2 cells. White arrowheads mark properly developed egg-cylinder shaped embryos based on morphology. (D) Representative examples of DOX induction timing calibration and optimization experiments for generating sEmbryos. Representative bright field images of sEmbryos at day 5 of culture assembled from different cell combinations and DOX pre-treatment regimens. (E) Schematic representation of different tested parameters and protocol regimens for establishing the optimized sEmbryo culture protocol (first line represents optimized protocol with optimal sEmbryo outcome as shown for day 5 and day 8). Atmospheric pressure, culture media compositions, as well as usage of static, shaker or rolling culture conditions at different time points were evaluated. Representative images of the outcome are shown (right panels). (HUS- Human umbilical cord serum, RAS- Rat Serum, IVC, in vitro culture media [with % FBS / KSR as indicated]). Scale bars are indicated on each image.
Figure 2
Figure 2
Naive ESC derived sEmbryos complete gastrulation and initiate neurulation and organogenesis stages within extraembryonic membranes (A) Schematic depiction of the sEmbryo generation and culture protocol. DOX pre-induction (−1 day for Gata4 in 2i/Lif or AM, and −14 up to −1 day for Cdx2 in TSCm +/− LPA) and aggregation of 3 types of naive ESC-derived populations followed by culture in AM (with DOX in first 2 days), EUCM2, and EUCM for 8 days generates self-organized sEmbryos (iCdx2) that grow up to early organogenesis. (B) Bright field images of sEmbryos at each day of the culture protocol compared to stage-matched natural embryos where indicated. (C) On day 5, putative sEmbryos were transferred into an electronically controlled roller bottle ex utero culture platform set-up that was used for sEmbryo propagation until day 8. (D) View of day 7 and day 8 sEmbryos cultured ex utero inside the roller culture bottles. (E) Bright field images of day 8 sEmbryos growing ex utero within whole extraembryonic membranes (YS and Am). (F) Day 8 sEmbryo (iCdx2) and E8.5 natural embryos after dissection and removal of extraembryonic membranes. Insets are enlargements of the dashed boxes. (G) Image of empty YS obtained after continuous culture in IVC media (with KSR) and static culture-based protocol. A, anterior; AC, amniotic cavity; Am, amnion; Al, allantois; AB, allantoic bud; BI, blood islands; EC, exocoelomic cavity; Epi, epiblast; EPC, ectoplacental cone; ExE, extraembryonic ectoderm; Fg, foregut pocket; H, heart; NFs, neural folds; NT, neural tube; OP, optic pit; P, posterior; PAC, pro-amniotic cavity; PS, primitive streak; S, somites; TB, tail bud; VE, visceral endoderm; YS, yolk sac.
Figure S3
Figure S3
Images representing technical steps during sEmbryo culture protocol, related to Figure 2 (A) Schematic depiction describing the sEmbryo culture protocol steps from day 0 to day 8 (upper panel). Representative images of 24-well Aggrewell plates used for sEmbryo static culture (day 0 – day 3) and sEmbryos in non-adherent 6 well plate placed on orbital shaker inside a regular tissue culture incubator at day 4. (B) Images of sEmbryos transferred to in house generated electronically controlled rolling culture platform and glass bottles on day 5. (C) Representative images of sEmbryos at day 6 in the electronically controlled ex utero roller culture system. (D) Day 5–8 representative images showing the growth of sEmbryo inside glass bottles in the ex utero roller culture system used herein, in EUCM conditions.
Figure S4
Figure S4
sEmbryos (iCdx2) adequately express post-implantation lineage markers, related to Figure 3 (A) Rows 1–2: Middle-section immunostaining images of day 3 sEmbryo (iCdx2) for the epiblast marker Oct4, extraembryonic ectoderm markers Cdx2 and Ap2γ, along with visceral endoderm markers Sox17 and Gata4. Rows 3–6: Immunostaining of day 4 sEmbryo (iCdx2) for Epi, VE and ExE markers along with E5.5 natural in utero controls. Rows 7–8: day 5 sEmbryos (iCdx2) immunostained for different lineage specific markers and E6.5 natural in utero controls. (B) Rows 1–2: day 5 sEmbryos (iCdx2) immunostained for different lineage specific markers and E6.5 natural in utero controls. Rows 3–8: Representative immunostainings for Epi, ExE and VE markers in day 5 sEmbryos (iCdx2) alongside corresponding E6.5 natural in utero control embryos. The primitive streak in day 5 sEmbryos (iCdx2) is marked by Brachyury (Red) immunostaining, while the migrating anterior visceral endoderm at the opposite side is marked by Cer1 (magenta) and Dkk1 (yellow), similar to in utero E6.5 control. Scale bars, 50 μM. (C) Embryonic length measurements (μm) of iCdx2 sEmbryos and matching natural embryos at the indicated timepoints. Length measurement for abnormally developed iCdx2 sEmbryos at day 8 is shown in the far-right column. Dots represent individual embryos; data are mean ± SEM; n = 17 embryos E5.5, 15 embryos E6.5, 9 embryos E8.5 (natural embryos); n = 17 sEmbryos day 4, 19 sEmbryos day 5, 18 sEmbryos day 8 (sEmbryos iCdx2); n = 15 sEmbryos day 8 (abnormal sEmbryos); ns, not significant; two-tailed Student’s t test. (D) Bright field images of abnormally developed iCdx2 sEmbryos at day 8 of culture protocol and adequately developed iCdx2 sEmbryos shown as reference controls (right side). Abnormalities and absent compartment are highlighted where indicated. Al, allantois; H, heart; NF, neural folds; NT, neural tube; TB, tail bud. Scale bar, 200 μM.
Figure S5
Figure S5
Analysis of organogenesis-stage sEmbryos at day 8 and sEmbryo formation efficiency, related to Figure 4 (A) Bright field images exemplifying the scope of morphological variation that can be seen among day 8 sEmbryos (after dissection from the yolk sac). sEmbryos shown are obtained by aggregating WT ESCs, iGata4 ESCs and either short-term (3 days DOX) induced iCdx2 ESCs, long-term (10 days DOX) induced iCdx2 ESCs, or embryonic-derived TSCs (eTSCs) as indicated. (B) Representative image of a random field of view exemplifying egg cylinder morphology of embryos that renders them being selected at day 5 (red arrows) for transfer into roller culture stage of the protocol. (C) Efficiency of properly developed sEmbryos (iCdx2 + eTSCs-derived) based on lineage labeling data from Figure 1G (day 3 and 4), and morphology-based assessment from bright field images from day 5–8. Values from day 3–5 are calculated relative to the number of properly developed embryos per sample taken for this analysis on the same day, and percentages from day 6–8 are calculated relative to the number of embryos transferred to roller culture bottles on day 5 (see Methods). Values are mean ± SEM; n = 7 on day 3, n = 15 on day 4, n = 26 on day 5, n = 61 on day 6, n = 26 on day 7, n = 26 on day 8. (D) Calculated efficiency of properly developed sEmbryos (iCdx2 + eTSCs-derived). Values from day 3–5 correspond to the same values shown in panel (C). The adjusted effective efficiency of properly developed sEmbryos is shown from day 6–8, presented as relative to the total number of starting aggregates in the experiment. Data represent mean ± SEM. (E) Comparison of efficiency percentage of normally developed sEmbryos obtained using iCdx2 ESCs or eTSCs at day 6, 7, and 8 of the culture protocol, after selection and transfer to the roller culture at day 5 based on morphological criteria. The total number of embryos transferred at day 5 represents a value of 100%. Dots represent percentage of normal embryos per bottle; data represent mean ± SEM; n = 20 on day 6, n = 6 on day 7, n = 6 on day 8 (eTSCs); n = 41 on day 6, n = 20 on day 7, n = 20 on day 8 (iCdx2); two-tailed Student’s t test for normally distributed data and non-parametric U Mann-Whitney test for non-normally distributed data. p values are indicated on each column. (F) Representative whole-mount immunostaining confocal images of lineage-specific markers expressed in day 8 sEmbryos (iCdx2), compared to natural in utero E8.5 embryos. (G) Individual sEmbryo (iCdx2) stained for Sox2 (orange), Brachyury (yellow), and MHC-II (magenta) and imaged from the dorsal, lateral, and ventral sides (upper panels). An eTSCs-derived sEmbryo stained for Sox9 (red) and Sox17 (turquoise) showing the foregut invagination and notochord at the ventral side of the embryo is shown (lower panels). (H) Two examples of representative H&E staining on sagittal histological sections displaying the morpho-histological and structural complexity similarity between day 8 sEmbryos (iCdx2) and natural in utero E8.5 embryos. Scale bars, 200 μM in A, B, E, and F, 100 in G. Al, allantois; FB, forebrain; FP, floor plate; Fg, foregut pocket; H, heart; MB, midbrain; Nc, notochord; NC, neural crest; NF, neural folds; NT, neural tube; TB, tail bud, S, somite, YS, yolk sac.
Figure 3
Figure 3
Expression patterns of lineage markers in egg-cylinder-shaped sEmbryos (iCdx2) resemble those of natural embryos (A) Middle section confocal images of day 4 egg-cylinder sEmbryos and natural E5.5 embryos immunostained for ExE, VE, and Epi markers. (B) Migration of the AVE from the distal to the future anterior part revealed by Cer1 staining (magenta) in day 4 sEmbryo. (C) Immunofluorescence images (middle section) of VE, trophoblast, epiblast, and gastrulation markers (Brachyury, yellow arrows) in day 5 sEmbryos compared to matched E6.5 natural embryos. (D) Quantification of antero-posterior asymmetry in sEmbryos at day 6 as measured by presence of the anterior neural plate. Dots represent percentage of embryos showing evident anterior neural plate per field of view; data are mean ± SEM of 4 different experiments; n = 22 fields of view evaluated. (E andF) Migration of the primitive streak and establishment of the definitive endoderm in sEmbryos at day 6 and control E7.5 natural embryos. (E) Immunofluorescence images showing migration of Brachyury+ cells and presence of Brachyury/Foxa2 double-positive cells. (F) Sox17/Foxa2 immunostaining exposing invaginating definitive endoderm cells; Foxa2+/Sox17− cells along the epiblast reveal the embryonic midline in sEmbryos. Insets are enlargements of the dashed boxes. (G) Middle section images of Blimp1-mVenus fluorescence at day 5 sEmbryos, detected by live imaging marking PGC specification (upper panel). Sox2+ PGCs show proper allocation to the anterior ventral side of the sEmbryos (iCdx2) at day 8 (lower panel). (H) Flow cytometry plots for Blimp1-mVenus/Stella-CFP in dissected posterior epiblast of sEmbryos (iCdx2) at day 4 and day 5, marking their emergence at day 5 (equivalent to E6.5).
Figure 4
Figure 4
Day 8 post-gastrulation sEmbryos (iCdx2) properly recapitulate spatial expression patterns of tissues derived from all three germ-layers (A) Whole-mount immunofluorescence images of day 8 sEmbryos (iCdx2) showing proper expression of ectodermal (Sox2, Otx2, Pax6), mesodermal (MHC-II, Brachyury) and endodermal (Gata4) lineage markers, compared to natural in utero E8.5 embryos. (B) Maximum intensity projection confocal images of Sox2 and Hoxb4 immunostainings highlighting the presence of somites (yellow arrows). (C) Schematic representation of the cutting planes for transversal sections of the A- and mid-NT shown in (D) and (E). (D) Immunostaining (mid-section, transversal plane) of the closed NT in day 8 sEmbryos (iCdx2) compared to natural in utero E8.5 embryos. (E) H&E staining of anterior and caudal transversal sections of day 8 sEmbryos and their natural counterparts at E8.5, displaying the embryonic NT, Fg, and H (MC and EC) at the A region and gut lumen, NT, and TNG at the posterior. (F) Immunohistochemistry images (mid-section, transversal plane) of H lineage markers in day 8 iCdx2 sEmbryos as compared to natural stage-matched embryos. A, anterior; D, dorsal; EC, endocardium; FB, forebrain; Fg, foregut pocket; H, heart; LV, left ventricle; MB, midbrain; MC, myocardium; Nc, notochord; NF, neural folds; NT, neural tube; P, posterior; RV, right ventricle; S, somite; TB, tail bud; TNG, tail neural groove; V, ventral.
Figure 5
Figure 5
eTSCs support development of advanced sEmbryos ex utero (A) Schematic of the sEmbryo (eTSC) generation and culture protocol. (B) Bright field images of sEmbryos (eTSC) developing ex utero from 0 to 8 days compared to equivalent natural in utero embryos. (C) Middle-section immunofluorescence images of day 5 sEmbryos (eTSC) showing the correct localization of the Epi marker Oct4 and the PS marker Brachyury compared to equivalent natural embryos. (D) PS migration and invagination of endoderm in day 6 sEmbryos (eTSC) revealed by Brachyury (red) and Foxa2 (green) immunostainings. (E) Live imaging of Blimp1-GFP sEmbryos exposing activation of the reporter in the PGCs at the P side of the embryo (upper panel) in day 5. Flow cytometry plots for Stella-mCherry single positive population in sEmbryos (eTSC) at day 4 and dissected posterior Epi of day 6 sEmbryo (lower panel). (F) Whole-mount immunostaining images of tissue-specific markers expressed in day 8 eTSC sEmbryos showing proper expression of ectodermal (Sox2, Otx2, Pax6), mesodermal (MHC-II, Brachyury), and endodermal (Gata4) lineage markers. A, anterior; AC, amniotic cavity; Am, amnion; Al, allantois; AB, allantoic bud; BI, blood islands; Epi, epiblast; EPC, ectoplacental cone; ExE, extraembryonic ectoderm; Fg, foregut pocket; H, heart; NF, neural folds; NT, neural tube; P, posterior; PAC, pro-amniotic cavity; PS, primitive streak; S, somites; VE, visceral endoderm; YS, yolk sac.
Figure 6
Figure 6
sEmbryos grow within extraembryonic membranes and develop allantois, blood islands, and ectoplacental cone (A) Images of day 7 and day 8 sEmbryos showing the presence of amnion, yolk sac, allantois, ectoplacental cone, neural fold, head, and blood islands. (B) Schematic illustration of the extraembryonic compartments present in day 8 sEmbryos/E8.5 embryos. (C) Whole-mount immunofluorescence images of markers present in yolk sacs isolated from sEmbryos at day 8 and E8.5 natural embryos. (D) Runx1 immunostaining marking blood progenitors in yolk sacs. (E) FACS contour plots for CD45 and CD34 expression among Lin cKit+ CD41+ progenitor cells. (F) Methylcellulose in vitro culture of colony-forming potential and morphology of erythroid progenitors derived from indicated samples.
Figure S6
Figure S6
scRNA-seq analysis of advanced mouse synthetic embryos, related to Figure 7 (A) Violin plots indicating the number of genes and unique molecular identifiers (UMIs) obtained per embryo type. Median of 5,680 UMIs and 2,273 genes were detected per cell. After filtering out low quality cells, median of 5,377 UMIs and 2,189 genes were detected per cell. (B) Lineage annotation of cell clusters. Dot plots illustrating the area under the curve (AUC) enrichment value of overlapping cells across clusters and tissue lineages. Dot size denotes the magnitude of enrichment. Colors indicate p values (Mann-Whitney test calculated from AUC score). (C) UMAP-based plots illustrating the normalized AUC assigned value of all individual cells for each lineage on natural and synthetic embryo samples. (D) Day 8 synthetic embryo cells (red), E8.5 natural embryo cells (black), E10.5 natural embryo cells (blue) and E6.5 natural embryo cells (green), projected on the same UMAP plot. Cell number in each graph is indicated. (E) scRNA-seq analysis of natural embryos, in utero and ex utero versus synthetic embryos (grown ex utero). UMAP plot displaying individual cells (n = 26,946 from 9 natural in utero grown E8.5 embryos; n = 7,014 from 4 natural ex-utero E8.5 embryos; n = 40,658 from 9 sEmbryo grown ex utero. Points are colored according to their assigned cell cluster. (F) Bar charts depicting the proportional abundance of each cell cluster in natural in-utero and ex-utero, and in synthetic embryos grown ex utero. Asterisks denote clusters with statistically significant differences between the two indicated groups. FDR corrected t test p < 0.1. Colors as in (E).
Figure 7
Figure 7
scRNA-seq analysis of post-gastrulation mouse synthetic embryos (A) UMAP plot displaying individual cells. Points are colored according to their assigned cell cluster. Cell lineage annotation of clusters based on marker genes of the major cell types identified in E8.5 mouse embryos. EN, total embryo number; CN, total cell number. (B) UMAP plot displaying individual cells of the different samples as indicated. Colors as in (A). (C) E8.5 natural embryo cells (black) and day 8 synthetic embryo cells (red) projected on the same UMAP plot. (D) Pie charts depicting the proportional abundance of each cell cluster in both natural embryos and sEmbryos. Asterisks denote clusters with statistically significant differences between the two groups. FDR corrected t test p < 0.1.
Figure S7
Figure S7
scRNA-seq analysis confirms high correlation in gene expression between organogenesis-stage mouse synthetic embryos and their natural counterparts, related to Figure 7 (A) Correlation of gene expression of 24,348 genes for each cluster between natural and synthetic embryos. Correlation coefficients are indicated. (B) Left: Dot plots illustrating the expression of selected markers of notochord, somitic mesoderm, neural tube and cardiac tissues across selected clusters, comparing natural to synthetic embryo cells. Dot size denotes the normalized expression. Colors indicate enrichment —log10(p values) (Fisher exact test). Right: Dot plots illustrating the expression of selected markers of the indicated extraembryonic tissue across selected clusters, comparing natural (in utero and ex utero) to synthetic embryo (ex utero) cells. Dot size denotes the normalized expression. Colors indicate enrichment —log10(p values) (Fisher exact test). (C) Normalized expression of selected placental and trophoblast markers, projected on UMAP of E8.5 natural in utero embryos, E8.5 natural ex utero embryos or day 8 ex utero iCdx2 sEmbryos.

Comment in

References

    1. Aguilera-Castrejon A., Oldak B., Shani T., Ghanem N., Itzkovich C., Slomovich S., Tarazi S., Bayerl J., Chugaeva V., Ayyash M., et al. Ex utero mouse embryogenesis from pre-gastrulation to late organogenesis. Nature. 2021;593:119–124. doi: 10.1038/s41586-021-03416-3. - DOI - PubMed
    1. Amadei G., Lau K.Y., de Jonghe J., Gantner C.W., Sozen B., Chan C., Zhu M., Kyprianou C., Hollfelder F., Zernicka-Goetz M. Inducible stem-cell-derived embryos capture mouse morphogenetic events in vitro. Dev. Cell. 2021;56:366–382.e9. doi: 10.1016/j.devcel.2020.12.004. - DOI - PMC - PubMed
    1. Anderson K.G. v, Hamilton W.B., Roske F. v, Azad A., Knudsen T.E., Canham M., Forrester L.M., Brickman J.M. Insulin fine-tunes self-renewal pathways governing naive pluripotency and extra-embryonic endoderm. Nat. Cell Biol. 2017;19:1164–1177. doi: 10.1038/ncb3617. - DOI - PubMed
    1. Bayerl J., Ayyash M., Shani T., Manor Y.S., Gafni O., Massarwa R., Kalma Y., Aguilera-Castrejon A., Zerbib M., Amir H., et al. Principles of signaling pathway modulation for enhancing human naive pluripotency induction. Cell Stem Cell. 2021;28:1549–1565.e12. doi: 10.1016/j.stem.2021.04.001. - DOI - PMC - PubMed
    1. Beccari L., Moris N., Girgin M., Turner D.A., Baillie-Johnson P., Cossy A.-C., Lutolf M.P., Duboule D., Arias A.M. Multi-axial self-organization properties of mouse embryonic stem cells into gastruloids. Nature. 2018;562:272–276. doi: 10.1038/s41586-018-0578-0. - DOI - PubMed

Publication types