. 2022 Nov;10(11):1061-1073.
doi: 10.1016/S2213-2600(22)00226-0. Epub 2022 Aug 18.

Onset and window of SARS-CoV-2 infectiousness and temporal correlation with symptom onset: a prospective, longitudinal, community cohort study

Collaborators, Affiliations

Onset and window of SARS-CoV-2 infectiousness and temporal correlation with symptom onset: a prospective, longitudinal, community cohort study

Seran Hakki et al. Lancet Respir Med. 2022 Nov.

Erratum in

Abstract

Background: Knowledge of the window of SARS-CoV-2 infectiousness is crucial in developing policies to curb transmission. Mathematical modelling based on scarce empirical evidence and key assumptions has driven isolation and testing policy, but real-world data are needed. We aimed to characterise infectiousness across the full course of infection in a real-world community setting.

Methods: The Assessment of Transmission and Contagiousness of COVID-19 in Contacts (ATACCC) study was a UK prospective, longitudinal, community cohort of contacts of newly diagnosed, PCR-confirmed SARS-CoV-2 index cases. Household and non-household exposed contacts aged 5 years or older were eligible for recruitment if they could provide informed consent and agree to self-swabbing of the upper respiratory tract. The primary objective was to define the window of SARS-CoV-2 infectiousness and its temporal correlation with symptom onset. We quantified viral RNA load by RT-PCR and infectious viral shedding by enumerating cultivable virus daily across the course of infection. Participants completed a daily diary to track the emergence of symptoms. Outcomes were assessed with empirical data and a phenomenological Bayesian hierarchical model.

Findings: Between Sept 13, 2020, and March 31, 2021, we enrolled 393 contacts from 327 households (the SARS-CoV-2 pre-alpha and alpha variant waves); and between May 24, 2021, and Oct 28, 2021, we enrolled 345 contacts from 215 households (the delta variant wave). 173 of these 738 contacts were PCR positive for more than one timepoint, 57 of which were at the start of infection and comprised the final study population. The onset and end of infectious viral shedding were captured in 42 cases and the median duration of infectiousness was 5 (IQR 3-7) days. Although 24 (63%) of 38 cases had PCR-detectable virus before symptom onset, only seven (20%) of 35 shed infectious virus presymptomatically. Symptom onset was a median of 3 days before both peak viral RNA and peak infectious viral load (viral RNA IQR 3-5 days, n=38; plaque-forming units IQR 3-6 days, n=35). Notably, 22 (65%) of 34 cases and eight (24%) of 34 cases continued to shed infectious virus 5 days and 7 days post-symptom onset, respectively (survival probabilities 67% and 35%). Correlation of lateral flow device (LFD) results with infectious viral shedding was poor during the viral growth phase (sensitivity 67% [95% CI 59-75]), but high during the decline phase (92% [86-96]). Infectious virus kinetic modelling suggested that the initial rate of viral replication determines the course of infection and infectiousness.

Interpretation: Less than a quarter of COVID-19 cases shed infectious virus before symptom onset; under a crude 5-day self-isolation period from symptom onset, two-thirds of cases released into the community would still be infectious, but with reduced infectious viral shedding. Our findings support a role for LFDs to safely accelerate deisolation but not for early diagnosis, unless used daily. These high-resolution, community-based data provide evidence to inform infection control guidance.

Funding: National Institute for Health and Care Research.


Conflict of interest statement

Declaration of interests NF reports grants from the UK Medical Research Council, UK National Institute of Health and Care Research (NIHR), UK Research and Innovation, Community Jameel, Janssen Pharmaceuticals, Bill & Melinda Gates Foundation, and Gavi, the Vaccine Alliance; consulting fees from the World Bank; payment or honoraria from the Wellcome Trust; travel expenses from WHO; advisory board participation for Takeda; and is a senior editor of the eLife journal. All other authors declare no competing interests.

Figures

Figure 1
Figure 1
Study profile Flowchart illustrating derivation of the recently infected contacts included in subsequent analyses, from which the growth phase was serially captured. Samples from a total of 57 cases were used. ATACCC=Assessment of Transmission and Contagiousness of COVID-19 in Contacts. *PCR-positive contacts are referred to as cases throughout. †Incident cases were PCR negative on the day of study enrolment and became PCR positive during the study. ‡Prevalent cases were PCR positive from the day of recruitment. §Stringent criteria were applied to the prevalent cases to select only contacts in whom the growth phase was fully captured. ¶13 cases pre-alpha variant, unvaccinated; 12 cases alpha variant, unvaccinated; 7 cases delta variant, unvaccinated; and 25 cases delta variant, fully vaccinated. In some analyses, not all 57 cases were included; see the appendix (p 3) for the full exclusion criteria.
Figure 2
Figure 2
Window and kinetics of SARS-CoV-2 infectiousness in recently infected contacts Graphical summary illustrating the window and kinetics of SARS-CoV-2 infectiousness in recently infected contacts in whom the growth phase was serially captured. The blue curve depicts the typical viral RNA kinetics detected by combined nose and throat swabs, and the purple curve depicts the typical infectious viral kinetics as measured by quantitative plaque assays. All point estimates are medians. The duration of infectiousness (as measured by plaque assay) was measured in 42 cases. Time from symptom onset to peak RNA viral load was measured in 38 cases, and symptom onset to peak infectious viral load in 35 cases. LFD sensitivity was measured against infectious viral shedding during pre-peak to peak viral shedding (n=270 tests) and post-peak viral shedding (n=337 tests). Peak shedding, duration of the growth phase, decline phase, and total shedding were estimated with Bayesian hierarchical modelling (n=57 cases for viral RNA shedding and n=47 cases for infectious viral shedding, as measured by plaque assays). This figure is a simplified summary of the empirical data in figure 3 and the Bayesian modelling data in the appendix p (9). ATACCC=Assessment of Transmission and Contagiousness of COVID-19 in Contacts. AUC=area under the curve. CrI=credible interval. LFD=lateral flow device. PFU=plaque-forming unit.
Figure 3
Figure 3
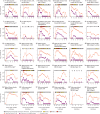
SARS-CoV-2 viral dynamics captured through daily sampling for cases infected with pre-alpha or alpha variants (unvaccinated), or the delta variant (vaccinated and unvaccinated) Samples from a total of 57 cases were used: 13 pre-alpha variant, unvaccinated; 12 alpha variant, unvaccinated; 7 delta variant, unvaccinated; and 25 delta variant, fully vaccinated. All vaccinated cases are denoted as such in the title (n=25) and number of days from receiving the second SARS-CoV-2 vaccine dose to the day of exposure is given in brackets. Age, sex, BMI (calculated for cases aged ≥16 years), and health conditions of the contact, where present, are denoted. Each graph shows the temporal trends for combined nose and throat swab RNA viral load as measured by RT-PCR (orange dots) and infectious virus as measured by plaque assays (purple dots). 34 of 57 cases had information available for the day of symptom onset. For these cases, a red dashed line indicates self-reported symptom onset for at least one of the canonical COVID-19 symptoms (persistent cough, productive cough, loss or change in smell or taste, or fever) or two of the following: sore throat, muscle aches, headache, or appetite loss. Absence of a dashed line indicates missing symptom-onset information. LFD results on each day are shown in boxes at the top of each graph; red boxes=strong positive, orange boxes=positive, and yellow boxes=weak positive (see appendix p 7 for a detailed visualisation of each grade). AS=asymptomatic. BMI=body-mass index. COPD=chronic obstructive pulmonary disease. LFD=lateral flow device. *Viral transport media from one unvaccinated alpha contact (plot 25) and one vaccinated delta-infected contact (plot 29) could not be cultured due to toxicity of the viral transport medium used for these contacts against Vero E6 cells.
Figure 3
Figure 3
SARS-CoV-2 viral dynamics captured through daily sampling for cases infected with pre-alpha or alpha variants (unvaccinated), or the delta variant (vaccinated and unvaccinated) Samples from a total of 57 cases were used: 13 pre-alpha variant, unvaccinated; 12 alpha variant, unvaccinated; 7 delta variant, unvaccinated; and 25 delta variant, fully vaccinated. All vaccinated cases are denoted as such in the title (n=25) and number of days from receiving the second SARS-CoV-2 vaccine dose to the day of exposure is given in brackets. Age, sex, BMI (calculated for cases aged ≥16 years), and health conditions of the contact, where present, are denoted. Each graph shows the temporal trends for combined nose and throat swab RNA viral load as measured by RT-PCR (orange dots) and infectious virus as measured by plaque assays (purple dots). 34 of 57 cases had information available for the day of symptom onset. For these cases, a red dashed line indicates self-reported symptom onset for at least one of the canonical COVID-19 symptoms (persistent cough, productive cough, loss or change in smell or taste, or fever) or two of the following: sore throat, muscle aches, headache, or appetite loss. Absence of a dashed line indicates missing symptom-onset information. LFD results on each day are shown in boxes at the top of each graph; red boxes=strong positive, orange boxes=positive, and yellow boxes=weak positive (see appendix p 7 for a detailed visualisation of each grade). AS=asymptomatic. BMI=body-mass index. COPD=chronic obstructive pulmonary disease. LFD=lateral flow device. *Viral transport media from one unvaccinated alpha contact (plot 25) and one vaccinated delta-infected contact (plot 29) could not be cultured due to toxicity of the viral transport medium used for these contacts against Vero E6 cells.
Figure 4
Figure 4
Survival probability of infectious virus presence, as determined by plaque assays Curves of the survival probability of infectious virus presence, as determined by plaque assays of cases, are plotted according to Kaplan-Meier methods. (A) Survival probability from the day of the first positive PCR result (n=34; 16 vaccinated and 18 unvaccinated). (B) Survival probability from the day of first symptom onset (n=34; 19 vaccinated and 15 unvaccinated). Curves were compared with a log-rank test. Blue lines show the cumulative count of the number of potentially infectious cases from 5 days since the first positive PCR result or first symptom onset. Red lines show the cumulative count of the number of potentially infectious cases from 7 days since first positive PCR or first symptom onset. For panel A, 23 cases were excluded entirely from the analysis for the following reasons: toxicity of the viral transport medium against Vero E6 cells (figure 3, plots 25 and 29); not shedding virus capable of forming PFUs (figure 3, plots 14, 18, 23, and 57); being early prevalent cases (figure 3, plots 12, 15, 17, 20, 21, 24, 26, 27, 33, 36, 38, 41, 45, 50, 52, and 54); and having only one PFU positive timepoint (figure 3, plot 16). For panel B, 23 cases were excluded entirely from the analysis for the following reasons: being asymptomatic (figure 3, plots 21, 23, and 52); not having a symptom onset date (figure 3, plots 1, 5, 6, 7, 8, 12, 16, 20, 22, 25, 30, 32, 45, 47, 56, and 57); toxicity of the viral transport medium against Vero E6 cells (figure 3, plot 29); not shedding virus capable of forming PFUs (figure 3, plots 14 and 18); and having inadequate PFU data (figure 3, plot 33). PFU=plaque-forming unit.
Figure 5
Figure 5
LFD reactivity in relation to the start and end of infectious viral shedding, as determined by plaque assays (A) Percentage of positive LFD tests in relation to the concentration of PFUs. Fractions indicate the sensitivity estimates for each bin. The two bins on the right were merged as only one case had a PFU concentration eligible for the last bin. Error bars represent 95% CIs. (B) Number of days taken for the LFD test to first turn positive in the presence of infectious viral shedding. (C) Number of days taken for the LFD test to first turn negative at the end of infectious viral shedding. LFD=lateral flow device. PFU=plaque-forming unit.

Comment in

References

    1. Quilty BJ, Clifford S, Hellewell J, et al. Quarantine and testing strategies in contact tracing for SARS-CoV-2: a modelling study. Lancet Public Health. 2021;6:e175–e183. - PMC - PubMed
    1. Ferguson J, Dunn S, Best A, et al. Validation testing to determine the sensitivity of lateral flow testing for asymptomatic SARS-CoV-2 detection in low prevalence settings: testing frequency and public health messaging is key. PLoS Biol. 2021;19 - PMC - PubMed
    1. Deeks JJ, Singanayagam A, Houston H, et al. SARS-CoV-2 antigen lateral flow tests for detecting infectious people: linked data analysis. BMJ. 2022;376 - PMC - PubMed
    1. Ke R, Martinez PP, Smith RL, et al. Daily sampling of early SARS-CoV-2 infection reveals substantial heterogeneity in infectiousness. medRxiv. 2021 doi: 10.1101/2021.07.12.21260208. published online July 12. (preprint). - DOI - PMC - PubMed
    1. Killingley B, Mann AJ, Kalinova M, et al. Safety, tolerability and viral kinetics during SARS-CoV-2 human challenge in young adults. Nat Med. 2022;28:1031–1041. - PubMed

Publication types

Supplementary concepts