

Pregnancy imparts distinct systemic adaptive immune function
- PMID: 35989229
- PMCID: PMC9648024
- DOI: 10.1111/aji.13606
Pregnancy imparts distinct systemic adaptive immune function
Abstract
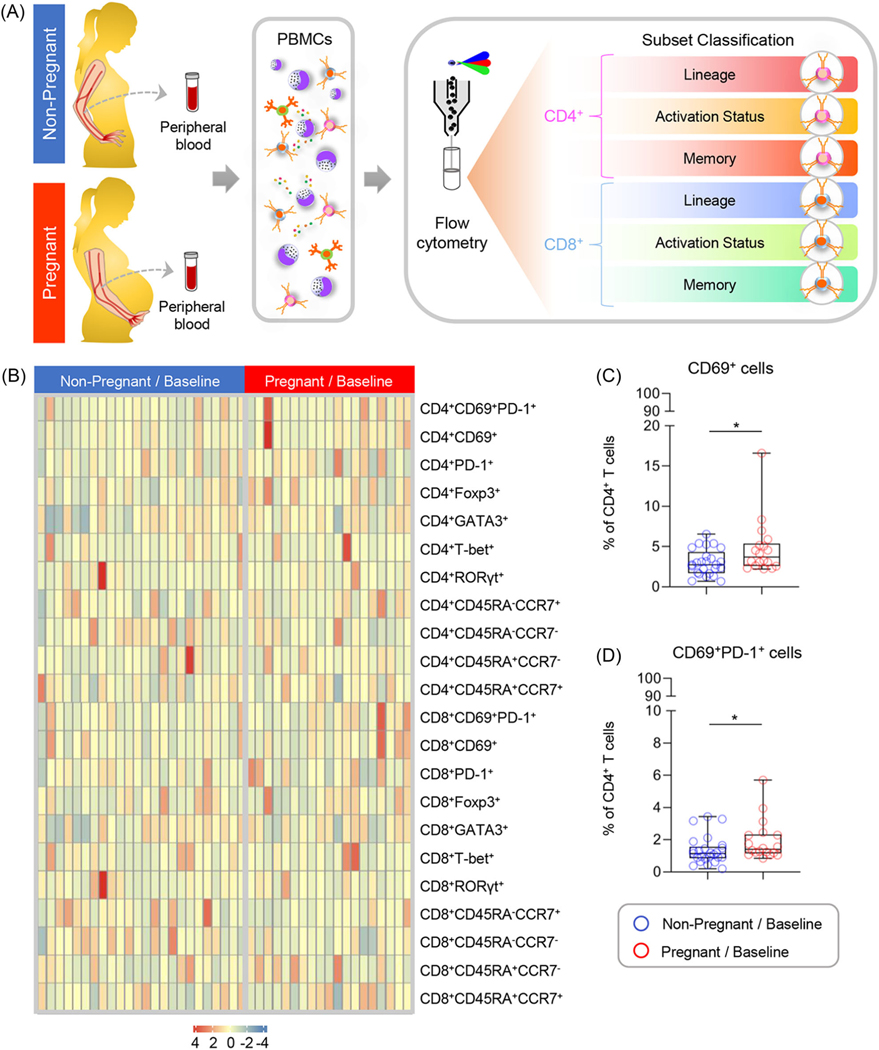
Problem: Pregnancy represents a state of systemic immune activation that is primarily driven by alterations in circulating innate immune cells. Recent studies have suggested that cellular adaptive immune components, T cells and B cells, also undergo changes throughout gestation. However, the phenotypes and functions of such adaptive immune cells are poorly understood. Herein, we utilized high-dimensional flow cytometry and functional assays to characterize T-cell and B-cell responses in pregnant and non-pregnant women.
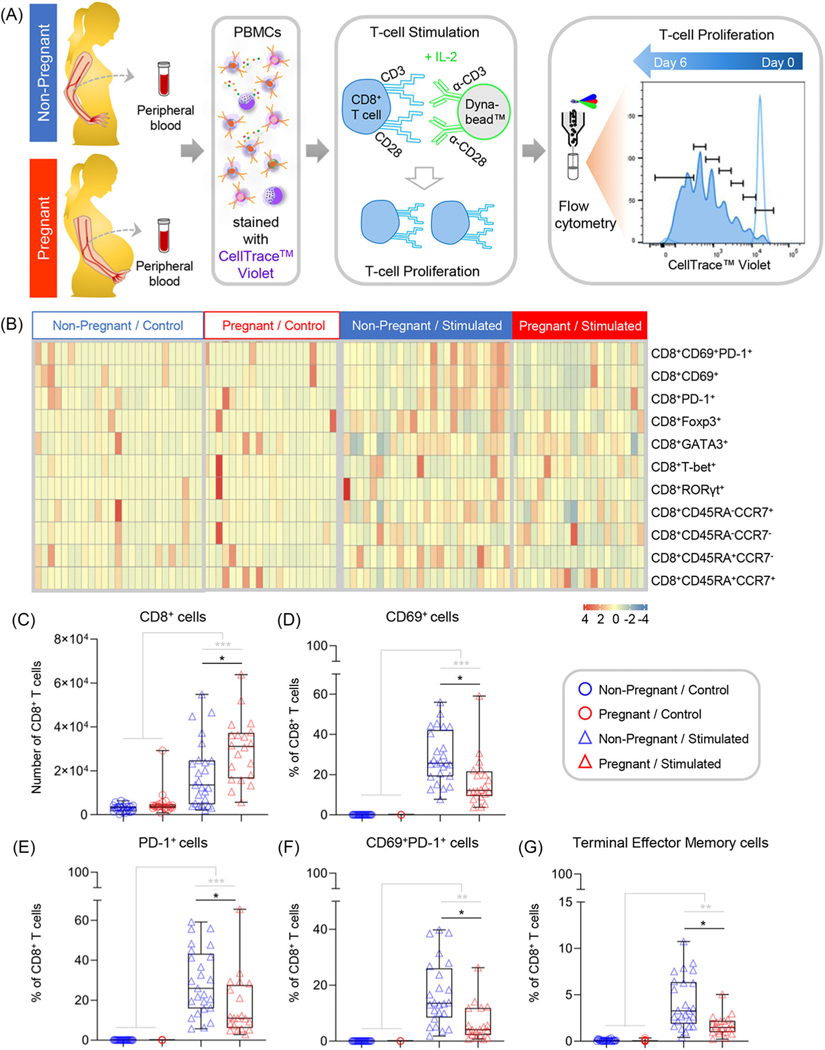
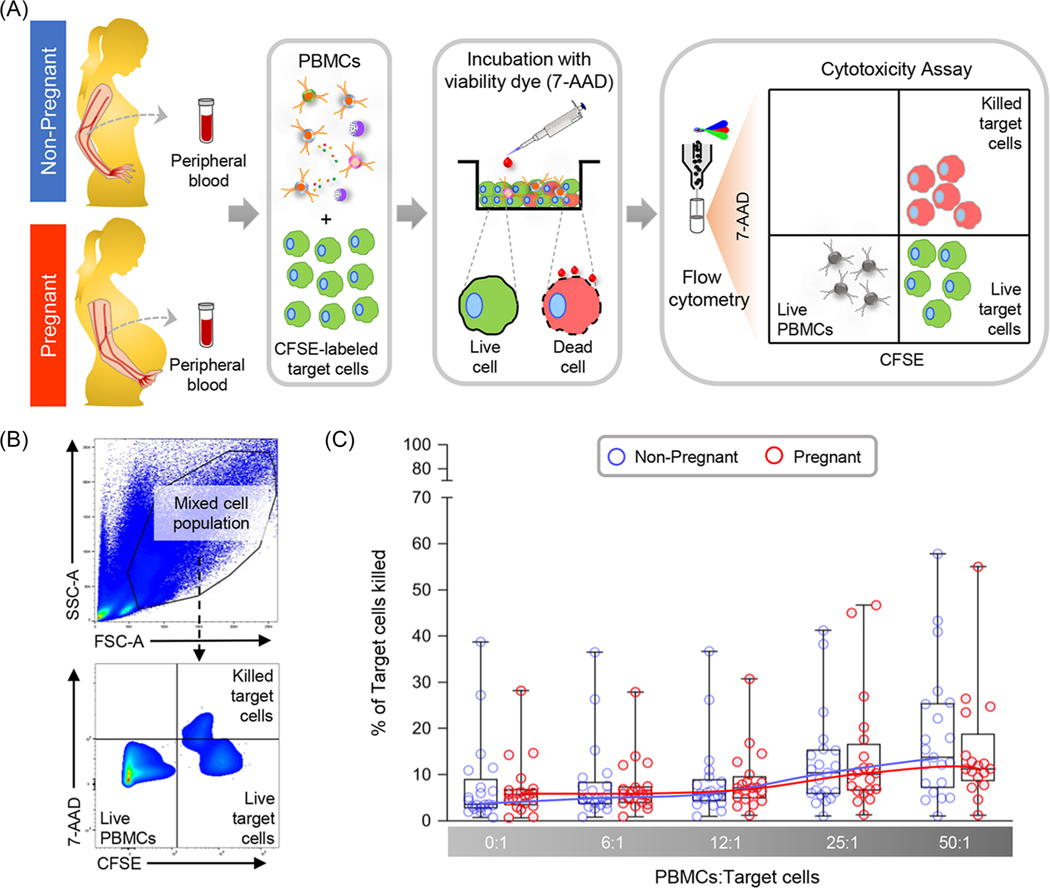
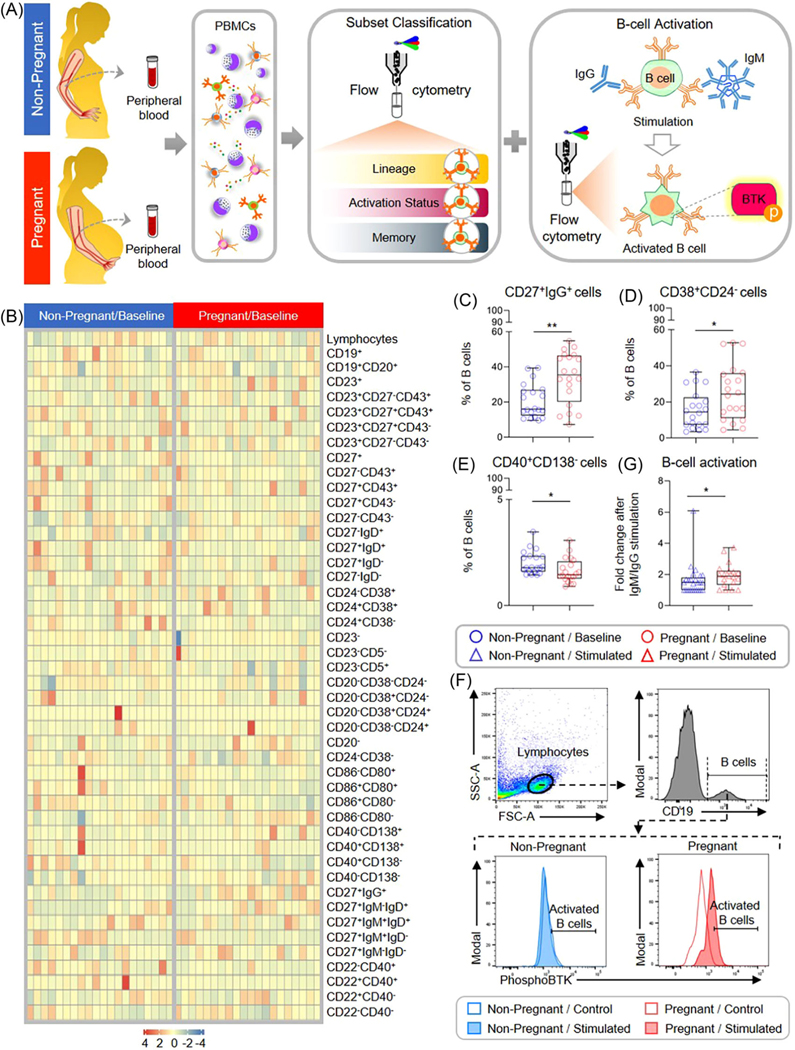
Methods: Peripheral blood mononuclear cells from pregnant (n = 20) and non-pregnant (n = 25) women were used for phenotyping of T-cell and B-cell subsets. T-cell proliferation and B-cell activation were assessed by flow cytometry after in vitro stimulation, and lymphocyte cytotoxicity was evaluated by using a cell-based assay. Statistical comparisons were performed with linear mixed-effects models.
Results: Pregnancy was associated with modestly enhanced basal activation of peripheral CD4+ T cells. Both CD4+ and CD8+ T cells from pregnant women showed increased activation-induced proliferation; yet, a reduced proportion of these cells expressed activation markers compared to non-pregnant women. There were no differences in peripheral lymphocyte cytotoxicity between study groups. A greater proportion of B cells from pregnant women displayed memory-like and activated phenotypes, and such cells exhibited higher activation following stimulation.
Conclusion: Maternal circulating T cells and B cells display distinct responses during pregnancy. The former may reflect the unique capacity of T cells to respond to potential threats without undergoing aberrant activation, thereby preventing systemic inflammatory responses that can lead to adverse perinatal consequences.
Keywords: B cell; T cell; adaptive immunity; cytotoxicity; flow cytometry; maternal circulation.
© 2022 John Wiley & Sons A/S. Published by John Wiley & Sons Ltd.
Conflict of interest statement
CONFLICT OF INTEREST
The authors declare no potential conflicts of interest.
Figures

Similar articles
-
Single-cell profiling of the peripheral blood immune landscape during mid- and late-stage pregnancy.Physiol Genomics. 2024 Dec 1;56(12):855-868. doi: 10.1152/physiolgenomics.00041.2024. Physiol Genomics. 2024. PMID: 39555960
-
Pregnancy-associated changes in peripheral blood lymphocyte subpopulations in normal Kuwaiti women.Gynecol Obstet Invest. 2001;52(4):232-6. doi: 10.1159/000052981. Gynecol Obstet Invest. 2001. PMID: 11729335
-
Pregnancy Gestation Impacts on HIV-1-Specific Granzyme B Response and Central Memory CD4 T Cells.Front Immunol. 2020 Feb 11;11:153. doi: 10.3389/fimmu.2020.00153. eCollection 2020. Front Immunol. 2020. PMID: 32117291 Free PMC article.
-
The importance of the PD-1/PD-L1 pathway at the maternal-fetal interface.BMC Pregnancy Childbirth. 2019 Feb 19;19(1):74. doi: 10.1186/s12884-019-2218-6. BMC Pregnancy Childbirth. 2019. PMID: 30782114 Free PMC article.
-
Immune cell profiling of preeclamptic pregnant and postpartum women by single-cell RNA sequencing.Int Rev Immunol. 2024;43(1):1-12. doi: 10.1080/08830185.2022.2144291. Epub 2022 Nov 11. Int Rev Immunol. 2024. PMID: 36369864
Cited by
-
Pregnancy-specific responses to COVID-19 are revealed by high-throughput proteomics of human plasma.Res Sq [Preprint]. 2022 Aug 22:rs.3.rs-1906806. doi: 10.21203/rs.3.rs-1906806/v1. Res Sq. 2022. Update in: Commun Med (Lond). 2023 Apr 4;3(1):48. doi: 10.1038/s43856-023-00268-y. PMID: 36032966 Free PMC article. Updated. Preprint.
-
Immunophenotyping and Activation Status of Maternal Lymphocytes to Predict Spontaneous Preterm Birth in Women With Threatened Preterm Labor: A Prospective Observational Study.Am J Reprod Immunol. 2024 Dec;92(6):e70015. doi: 10.1111/aji.70015. Am J Reprod Immunol. 2024. PMID: 39625044 Free PMC article.
-
Preexisting vaccine-primed heterosubtypic T cell immunity protects the maternal-fetal unit from adverse influenza outcomes in mice.J Clin Invest. 2025 Jan 2;135(1):e179230. doi: 10.1172/JCI179230. J Clin Invest. 2025. PMID: 39744951 Free PMC article.
-
Pregnancy-specific responses to COVID-19 revealed by high-throughput proteomics of human plasma.Commun Med (Lond). 2023 Apr 4;3(1):48. doi: 10.1038/s43856-023-00268-y. Commun Med (Lond). 2023. PMID: 37016066 Free PMC article.
References
-
- Sacks G, Sargent I, Redman C. Innate immunity in pregnancy. Immunol Today. 2000;21(4):200–201. - PubMed
-
- Efrati P, Presentey B, Margalith M, Rozenszajn L. Leukocytes Of Normal Pregnant Women. Obstet Gynecol. 1964;23:429–432. - PubMed
-
- Sacks GP, Studena K, Sargent K, Redman CW. Normal pregnancy and preeclampsia both produce inflammatory changes in peripheral blood leukocytes akin to those of sepsis. Am J Obstet Gynecol. 1998;179(1):80–86. - PubMed
Publication types
MeSH terms
Grants and funding
LinkOut - more resources
Full Text Sources
Research Materials
