. 2023 Jan;290(2):442-464.
doi: 10.1111/febs.16598. Epub 2022 Sep 2.

Regulation of the pyrimidine biosynthetic pathway by lysine acetylation of E. coli OPRTase

Affiliations

Regulation of the pyrimidine biosynthetic pathway by lysine acetylation of E. coli OPRTase

Gema Lozano-Terol et al. FEBS J. 2023 Jan.

Abstract

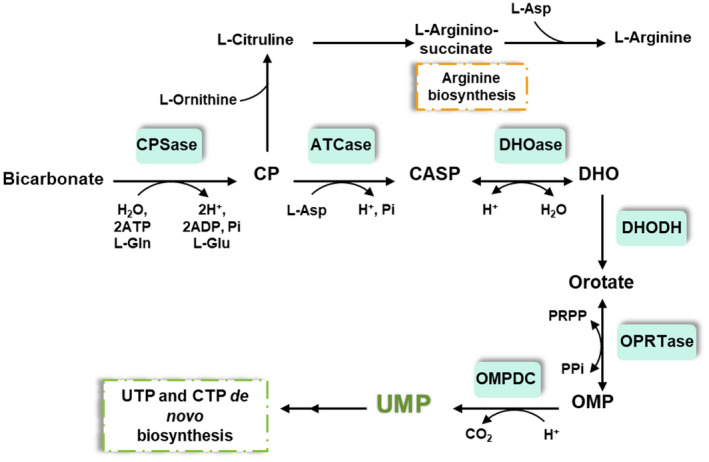
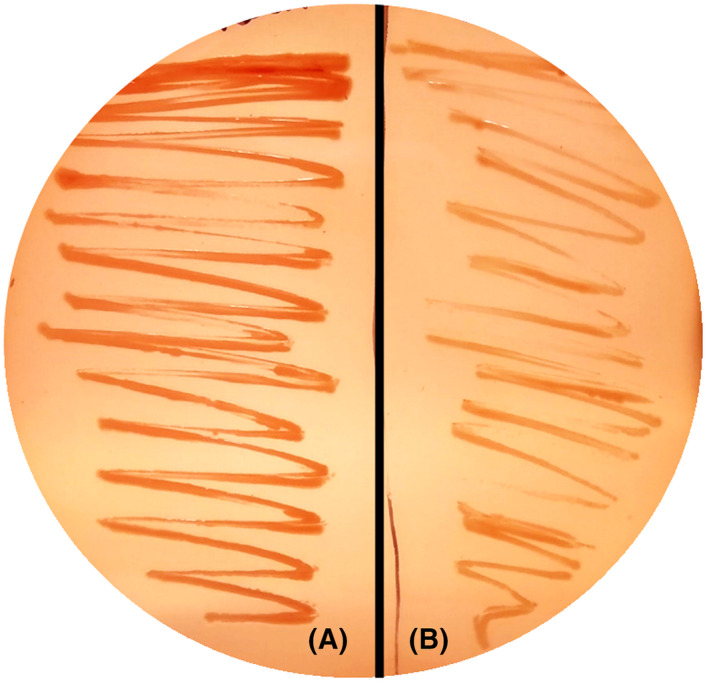
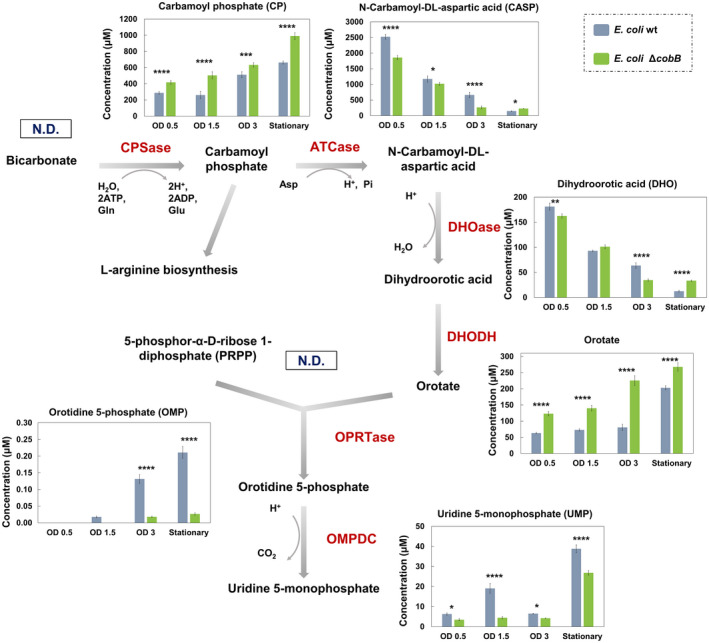
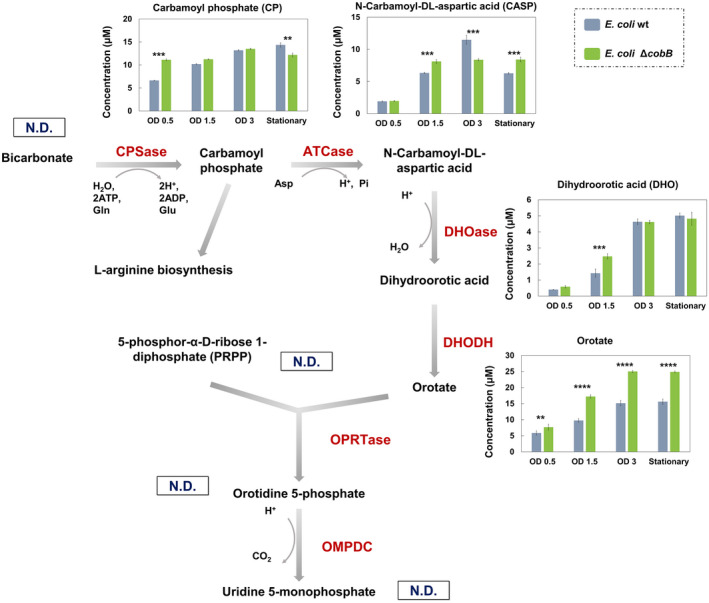
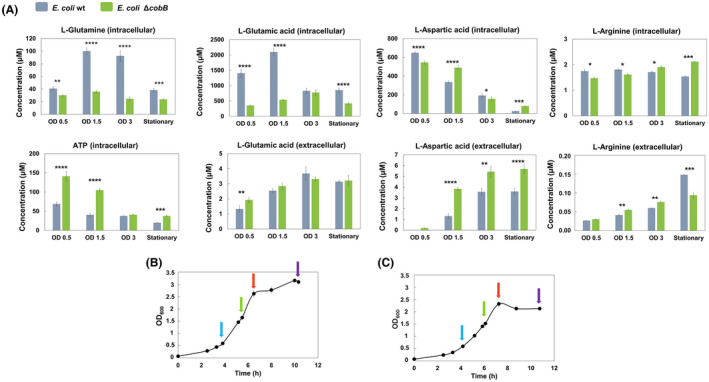
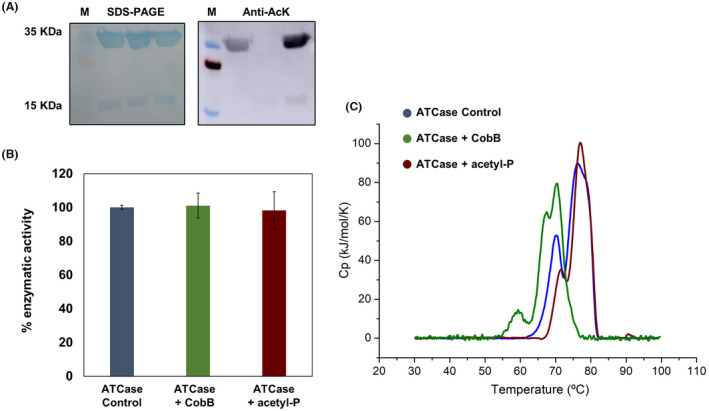
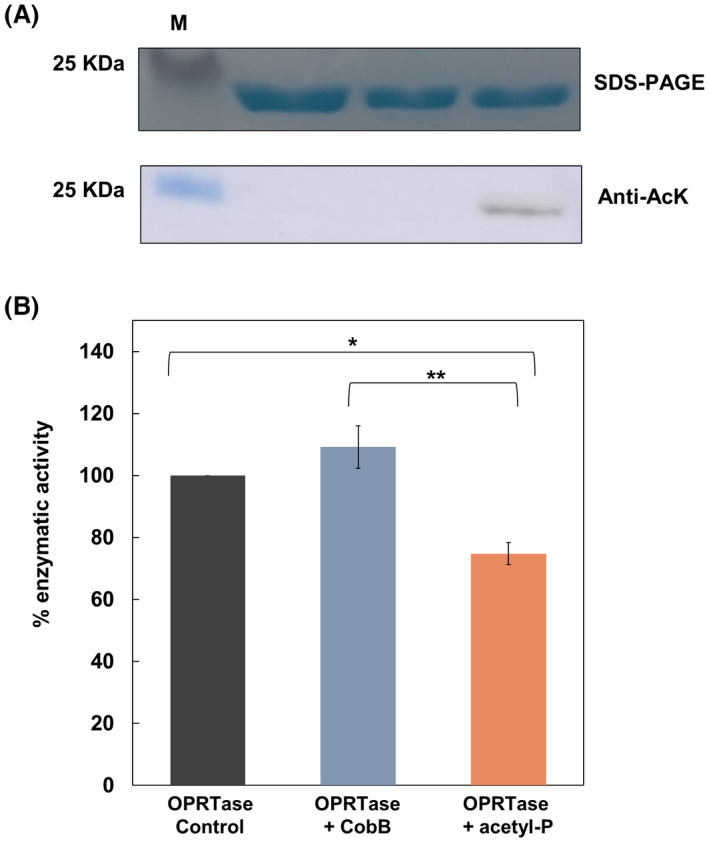
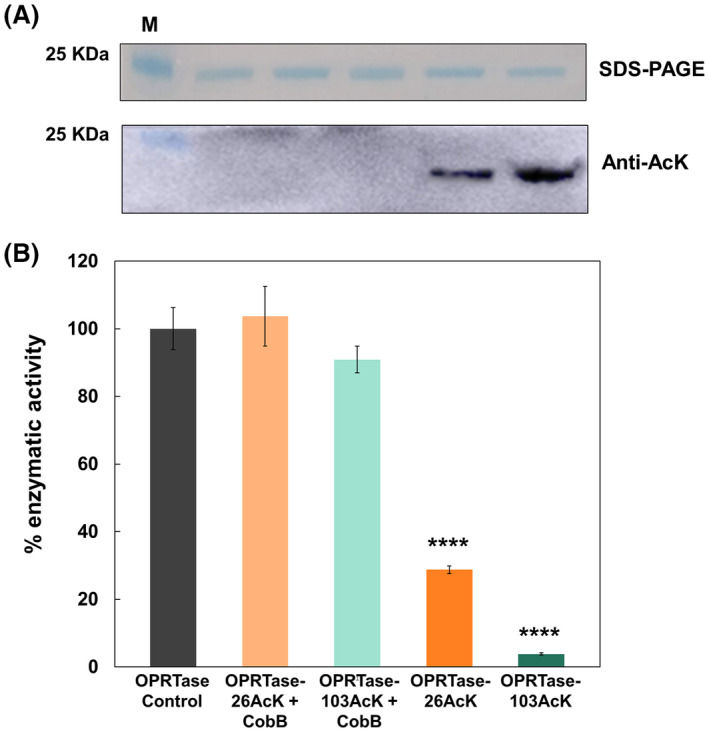
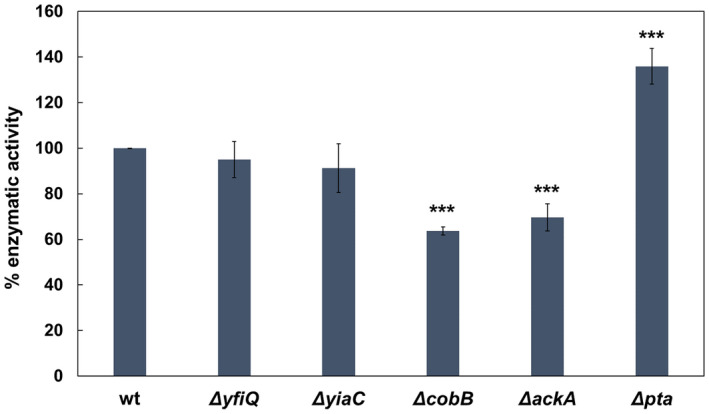
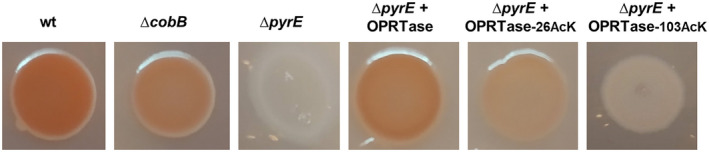
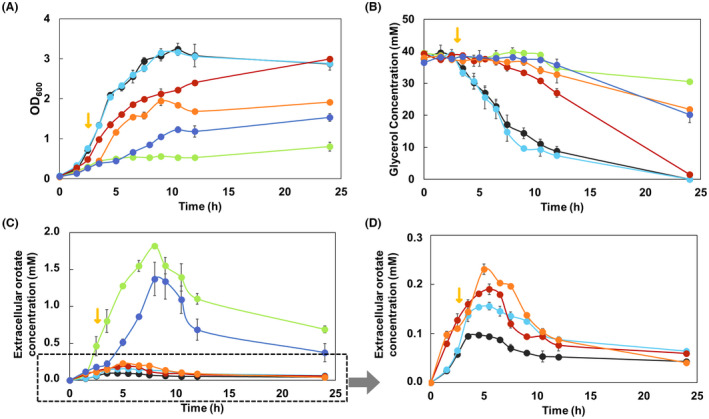
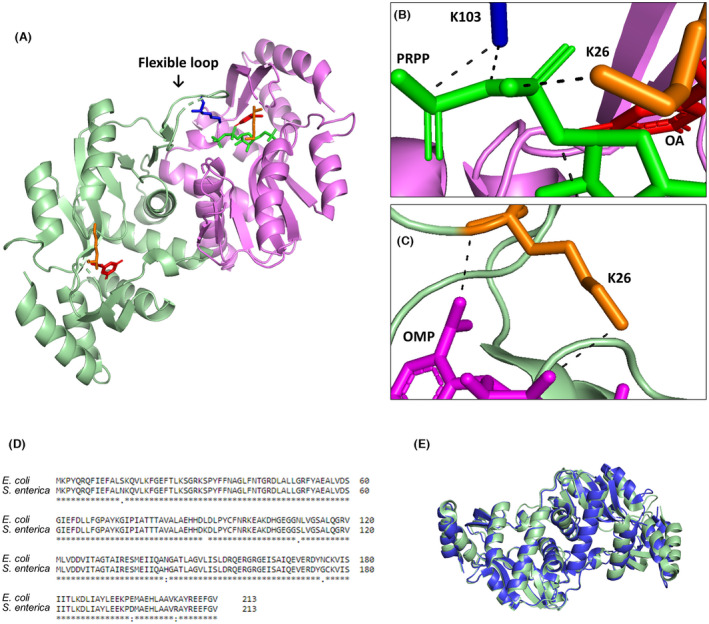
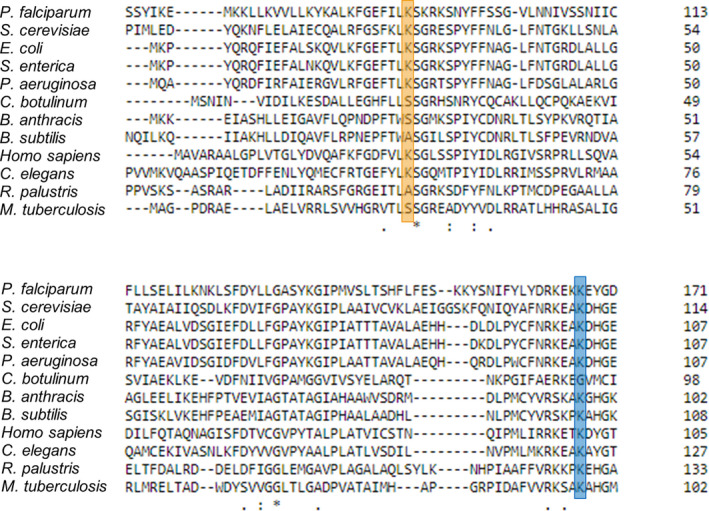
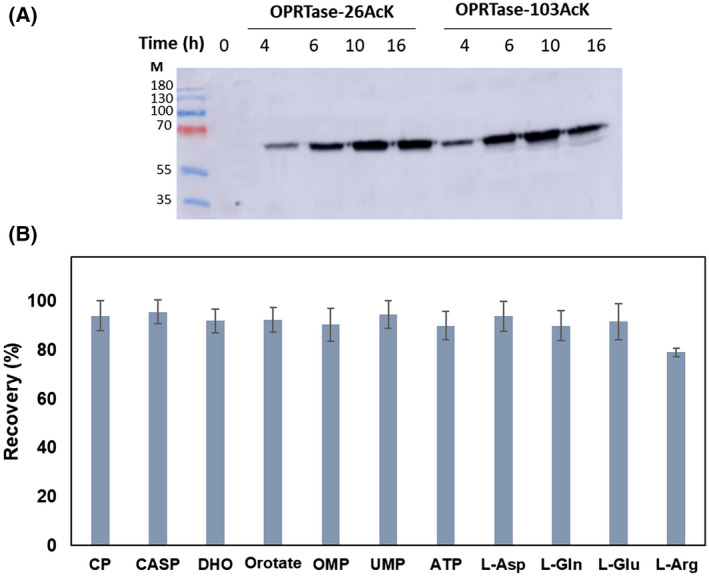
The de novo pyrimidine biosynthesis pathway is an important route due to the relevance of its products, its implications in health and its conservation among organisms. Here, we investigated the regulation by lysine acetylation of this pathway. To this aim, intracellular and extracellular metabolites of the route were quantified, revealing a possible blockage of the pathway by acetylation of the OPRTase enzyme (orotate phosphoribosyltransferase). Chemical acetylation of OPRTase by acetyl-P involved a decrease in enzymatic activity. To test the effect of acetylation in this enzyme, K26 and K103 residues were selected to generate site-specific acetylated proteins. Several differences were observed in kinetic parameters, emphasizing that the kcat of these mutants showed a strong decrease of 300 and 150-fold for OPRTase-103AcK and 19 and 6.3-fold for OPRTase-26AcK, for forward and reverse reactions. In vivo studies suggested acetylation of this enzyme by a nonenzymatic acetyl-P-dependent mechanism and a reversion of this process by the CobB deacetylase. A complementation assay of a deficient strain in the pyrE gene with OPRTase-26AcK and OPRTase-103AcK was performed, and curli formation, stoichiometric parameters and orotate excretion were measured. Complementation with acetylated enzymes entailed a profile very similar to that of the ∆pyrE strain, especially in the case of complementation with OPRTase-103AcK. These results suggest regulation of the de novo pyrimidine biosynthesis pathway by lysine acetylation of OPRTase in Escherichia coli. This finding is of great relevance due to the essential role of this route and the OPRTase enzyme as a target for antimicrobial, antiviral and cancer treatments.

Keywords: E. coli; OPRTase; lysine acetylation; pyrimidine biosynthesis pathway; regulation.


Conflict of interest statement

The authors declare no conflict of interest.

Figures

Fig. 1
Fig. 1
Escherichia coli de novo pyrimidine biosynthesis pathway. CPSase, carbamoyl phosphate synthetase enzyme; CP, carbamoyl phosphate; CASP, N‐carbamoyl‐l‐aspartate; ATCase, aspartate carbamoyltransferase; DHOase, dihydroorotase; DHO, dihydroorotate; DHODH, dihydroorotate dehydrogenase; OPRTase, orotate phosphoribosyltransferase; OMP, orotidine 5′‐monophosphate; OMPDC, orotidine 5′‐phosphate decarboxylase; UMP, uridine 5′‐monophosphate.
Fig. 2
Fig. 2
Congo red binding assay of Escherichia coli wt (A) and ΔcobB (B) strains. Both strains were spotted in CR medium and grown at 30 °C for 20 h, and dye binding was detected after incubation at 4 °C for 48 h. Image was analysed by open‐source software imagej (National Institutes of Health, Bethesda, MA, USA), and nine regularly spaced points were selected in each part of the plate, A and B, with Multi‐Point Tool. Average intensity of each multi‐point set was 897.7 ± 44 for A and 345.1 ± 43 for B, resulting in a 38.5% reduction in intensity for cobB mutant compared with wt.
Fig. 3
Fig. 3
Intracellular concentration of the metabolites of the pyrimidine biosynthesis pathway. Escherichia coli K12 wt (Grey bars) and ΔcobB (green bars) strains were grown in minimal M9 medium supplemented with glucose 20 mm. N.D., not detected. OD refers to OD600. De novo pyrimidine biosynthesis pathway with the charts of the intracellular concentration of CP, CASP, DHO, orotate, OMP and UMP in both strains at different times of growth. A two‐way ANOVA test was carried out with graphpad prism 7.0 to identify differences in concentrations between both strains [P‐value < 0.0001 (****), < 0.001 (***), < 0.01 (**) and < 0.05 (*)]. Error bars are standard errors calculated from two repeats.
Fig. 4
Fig. 4
Extracellular concentration of the metabolites of the pyrimidine biosynthesis pathway. Escherichia coli K12 wt (Grey bars) and ΔcobB (green bars) strains were grown in minimal M9 medium supplemented with glucose 20 mm. N.D, not detected. OD refers to OD600. De novo pyrimidine biosynthesis pathway with the charts of the extracellular concentration of CP, CASP, DHO and orotate in both strains at different times of growth. A two‐way ANOVA test was carried out with graphpad prism 7.0 to identify differences in concentrations between both strains [P‐value < 0.0001 (****), < 0.001 (***), < 0.01 (**) and < 0.05 (*)]. Error bars are standard errors calculated from two repeats.
Fig. 5
Fig. 5
Intracellular and extracellular concentration of other metabolites involved in the reactions of the pyrimidine biosynthesis pathway. Escherichia coli K12 wt (Grey bars) and ΔcobB (green bars) strains were grown in minimal M9 medium supplemented with glucose 20 mm. N.D, not detected. OD refers to OD600. (A) Charts with the intracellular and extracellular concentration of other metabolites that are involved in the route (Glu, Gln, Asp, Ar and ATP) in both strains and at different times of growth. A two‐way ANOVA test was carried out with graphpad prism 7.0 to identify differences in concentrations between both strains [P‐value < 0.0001 (****), < 0.001 (***), < 0.01 (**) and < 0.05 (*)]. E. coli K12 wt (B) and E. coli K12 ΔcobB (C) strains grown at OD600 with arrows indicating the culture time at which the samples were taken for the quantification of intracellular and extracellular metabolites: Before exponential growth phase (OD600 0.5) (blue), in mid‐exponential growth phase (OD600 1.5) (green), in long‐exponential growth phase (OD600 3) (red) and in stationary growth phase (stationary) (purple). Error bars are standard errors calculated from two repeats.
Fig. 6
Fig. 6
Analysis of acetylation, enzymatic activity and thermostability of ATCase control, ATCase subjected to a deacetylation reaction (ATCase + CobB) by adding CobB and ATCase subjected to an acetylation reaction with acetyl‐P 10 mm (ATCase + acetyl‐P). (A) SDS/PAGE and anti‐acetyl‐lysine (anti‐AcK) western blot of ATCase control (lane 1), ATCase + CobB (lane 2) and ATCase + acetyl‐P (lane 3) samples. The molecular mass marker (M) is included in the right side. (B) Measurement of the enzyme activity of ATCase control, ATCase + CobB and ATCase + acetyl‐P taking as 100% the value of ATCase control. (C) DSC analysis of ATCase control, ATCase + CobB and ATCase + acetyl‐P samples. Error bars are standard errors calculated from three repeats. For these assays, proteins were purified from cultures of Escherichia coli BL21 (DE3) transformed with pRSET‐pyrBI vector and grown in LB medium.
Fig. 7
Fig. 7
Western blot and enzymatic activity of OPRTase purified and subjected to control reaction (OPRTase control), OPRTase subjected to a deacetylation reaction (OPRTase + CobB) by adding CobB and OPRTase subjected to an acetylation reaction with acetyl‐P 10 mm (OPRTase + acetyl‐P). (A) SDS/PAGE and western blot anti‐AcK analysis of OPRTase control (lane 1), OPRTase + CobB (lane 2) and OPRTase + acetyl‐P (lane 3) samples. The molecular mass marker (M) is included in the left side. (B) Relative enzymatic activity of OPRTase control, OPRTase + CobB and OPRTase + acetyl‐P. The activity of OPRTase control sample was set to 100%. A one‐way ANOVA test was carried out to identify significant differences between relative enzymatic activities [P‐value < 0.01 (**) and < 0.05 (*)]. Error bars are standard errors calculated from three repeats. For these assays, proteins were purified from cultures of Escherichia coli BL21 (DE3) transformed with pRSET‐pyrE vector and grown in LB medium.
Fig. 8
Fig. 8
Western blot and enzymatic activity of OPRTase (control), OPRTase‐26AcK subjected to a deacetylation process (OPRTase‐26AcK + CobB), OPRTase‐103AcK subjected to a deacetylation process (OPRTase‐103AcK + CobB), OPRTase‐26AcK and OPRTase‐103AcK. (A) SDS/PAGE and western blot anti‐AcK analysis of OPRTase control (lane 1), OPRTase‐26AcK + CobB (lane 2), OPRTase‐103AcK + CobB (lane 3), OPRTase‐26AcK (lane 4) and OPRTase‐103AcK (lane 5) samples. The molecular mass marker (M) is included in the left side. (B) Relative enzymatic activities of OPRTase and its variants. OPRTase control, OPRTase‐26AcK + CobB, OPRTase‐103AcK + CobB, OPRTase‐26AcK and OPRTase‐103AcK. The activity of OPRTase control sample was set to 100%. A one‐way ANOVA test was carried out to identify significant differences between relative enzymatic activities of the samples with respect to the control sample [P‐value < 0.0001 (****)]. Error bars are standard errors calculated from three repeats. For these assays proteins were purified from cultures of Escherichia coli BL21 (DE3) transformed with correspondent vector and grown in LB medium.
Fig. 9
Fig. 9
Relative enzymatic activities of OPRTase purified from Escherichia coli BL21 wt, ΔyfiQ, ΔyiaC, ΔcobB, ΔackA and Δpta. The activity of OPRTase from wt was set to 100%. A one‐way ANOVA test was carried out to identify significant differences between relative enzymatic activities of the samples with respect to the OPRTase from the wt sample [P‐value < 0.001 (***)]. Error bars are standard errors calculated from three repeats. For these assays, proteins were purified from cultures of E. coli BL21 (DE3) wt, ΔyfiQ, ΔyiaC, ΔcobB, ΔackA and Δpta strains transformed with pRSET‐pyrE vector and grown in TB7 medium supplemented with 20 mm glucose.
Fig. 10
Fig. 10
Congo red binding assay of Escherichia coli K12 wt, ΔcobB, ΔpyrE, ΔpyrE + OPRTase, ΔpyrE + OPRTase‐26AcK and ΔpyrE + OPRTase‐103AcK. Strains were spotted in CR medium and grown at 30 °C for 20 h. Plate was incubated at 4 °C for 48 h.
Fig. 11
Fig. 11
Cell growth at OD600 (A), extracellular glycerol (B) and orotate (C, D; 11D presents 11C data that are marked in the box with an altered Y‐axis to better look at specific strains) concentration. Escherichia coli K12 wt (black circle), ΔcobB (light blue circle), ΔpyrE (green circle), ΔpyrE + OPRTase (red circle), ΔpyrE + OPRTase‐26AcK (orange circle) and ΔpyrE + OPRTase‐103AcK (blue circle) growing in TB7 supplemented with glycerol. The yellow arrow indicates the induction time. Error bars are standard errors calculated from three repeats.
Fig. 12
Fig. 12
Crystallographic structure of Salmonella enterica OPRTase. (A–C) Two subunits were coloured green and purple separately. K103 is marked in blue and K26 is marked in orange. (A, B) OPRTase with PRPP (green) and orotate (red) (PDB ID: 1LH0). (C) OPRTase with OMP (purple) (PDB ID: 1STO). Hydrogen bonds found between lysines NH3+ groups, K26 or K103, and the substrates PRPP and OMP are shown in dashed lines. (D) Protein sequence alignment of OPRTases from Escherichia coli (Uniprot ID: P0A7E3) and S. enterica (Uniprot ID: P08870). (E) Alignment of crystallographic structures of E. coli (green) (PDB ID: 6TAK) and S. enterica (blue) (PDB ID: 1LH0) OPRTases. The reported structures have been generated using pymol Software (DeLano Scientific LLC, San Francisco, CA, USA), and the alignment has been made employing clustal omega from the EMBL‐EBI (Cambridge, UK).
Fig. 13
Fig. 13
Protein sequence alignment of OPRTases from different eukaryotes and prokaryotes organisms. Escherichia coli (Uniprot ID: P0A7E3), Plasmodium falciparum (Uniprot ID: Q8I3Y0), Saccharomyces cerevisiae (Uniprot ID: P13298), Salmonella enterica (Uniprot ID: P08870), Pseudomonas aeruginosa (Uniprot ID: P50587), Clostridium botulinum (Uniprot ID: A5I6W5), Bacillus anthracis (Uniprot ID: A0A640L9R9), Bacillus subtilis (Uniprot ID: P25972), Homo sapiens (Uniprot ID: P11172), Caenorhabditis elegans (Uniprot ID: O61790), Rhodopseudomonas palustris (Uniprot ID: Q07H43) and Mycobacterium tuberculosis (Uniprot ID: P9WHK9). Orange box indicates residue K26, and blue box indicates residue K103 of E. coli OPRTase. The alignment has been made employing clustal omega from the EMBL‐EBI.
Fig. 14
Fig. 14
Overexpression western blot and intracellular metabolite recovery. (A) Western blot using anti‐(His)6 tag antibody of OPRTase‐26AcK and OPRTase‐103AcK overexpression cultures at different growth time after induction (time 0). For these assays, samples were taken from cultures of Escherichia coli BL21 (DE3) transformed with pRSF‐pMB1′‐BAD‐mbp‐pyrE 26AcK and pRSF‐pMB1′‐BAD‐mbp‐pyrE 103AcK vectors and growing in LB medium supplemented with 10 mm Nε‐acetyl‐l‐lysine and 20 mm nicotinamide 30 min before induction. (B) Intracellular metabolite recovery after the extraction protocol, as described in material and methods section. Error bars are standard errors calculated from three repeats.

Similar articles

Cited by

References

    1. O'Donovan GA, Neuhard J. Pyrimidine metabolism in microorganisms. Bacteriol Rev. 1970;34:278–343. - PMC - PubMed
    1. Turnbough CL, Switzer RL. Regulation of pyrimidine biosynthetic gene expression in bacteria: repression without repressors. Microbiol Mol Biol Rev. 2008;72:266–300. - PMC - PubMed
    1. Zrenner R, Stitt M, Sonnewald U, Boldt R. Pyrimidine and purine biosynthesis and degradation in plants. Annu Rev Plant Biol. 2006;57:805–36. - PubMed
    1. Jones ME. Pyrimidine nucleotide biosynthesis in animals: genes, enzymes and regulation of UMP biosynthesis. Annu Rev Biochem. 1980;49:253–79. - PubMed
    1. Guillou F, Rubino SD, Markovitz RS, Kinney DM, Lusty CJ. Escherichia coli carbamoyl phosphate‐synthetase: domains of glutaminase and synthetase‐subunit interaction. Proc Natl Acad Sci USA. 1989;86:8304–8. - PMC - PubMed

Publication types

LinkOut - more resources