. 2022 Oct 10;377(1861):20210240.
doi: 10.1098/rstb.2021.0240. Epub 2022 Aug 22.

EnteroBase: hierarchical clustering of 100 000s of bacterial genomes into species/subspecies and populations

Affiliations

EnteroBase: hierarchical clustering of 100 000s of bacterial genomes into species/subspecies and populations

Mark Achtman et al. Philos Trans R Soc Lond B Biol Sci. .

Abstract

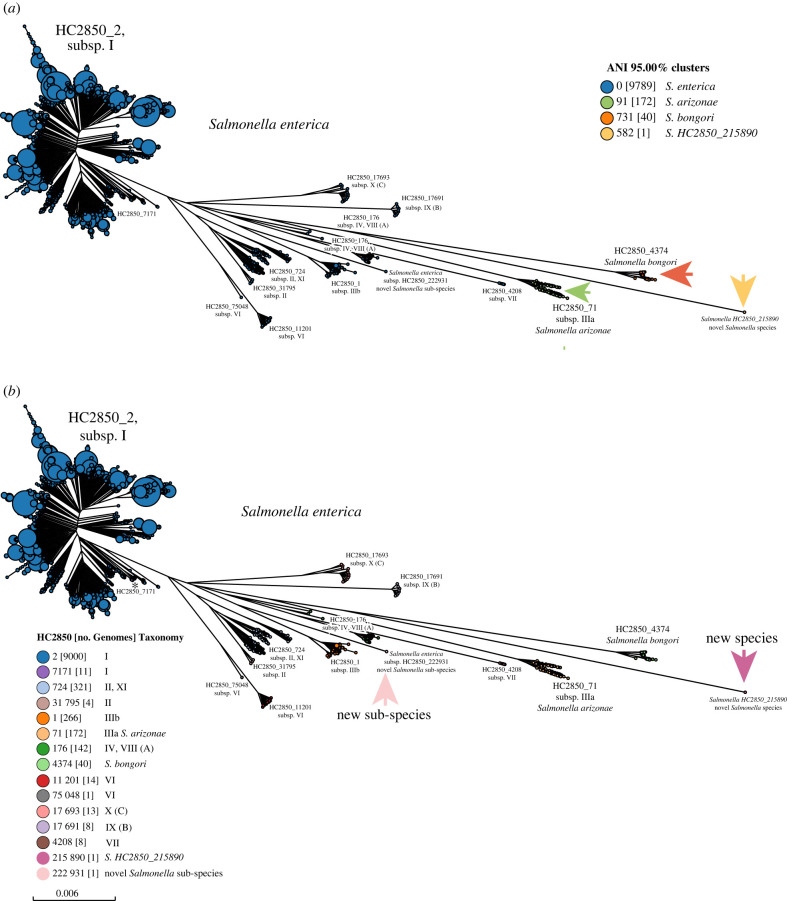
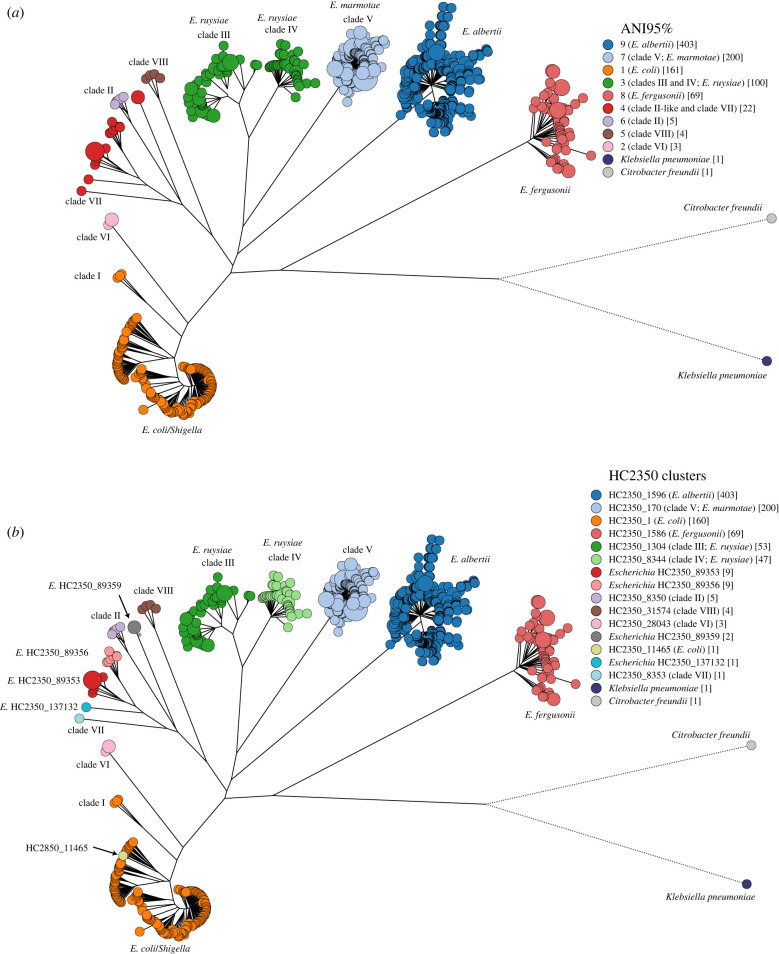
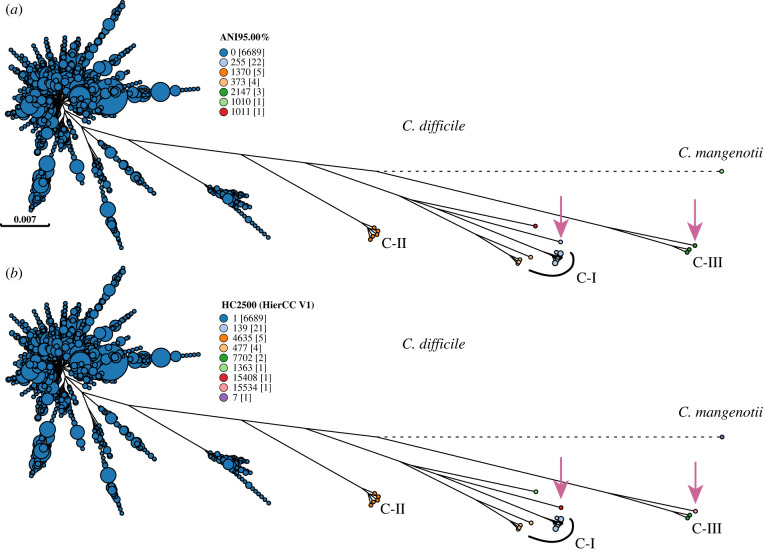
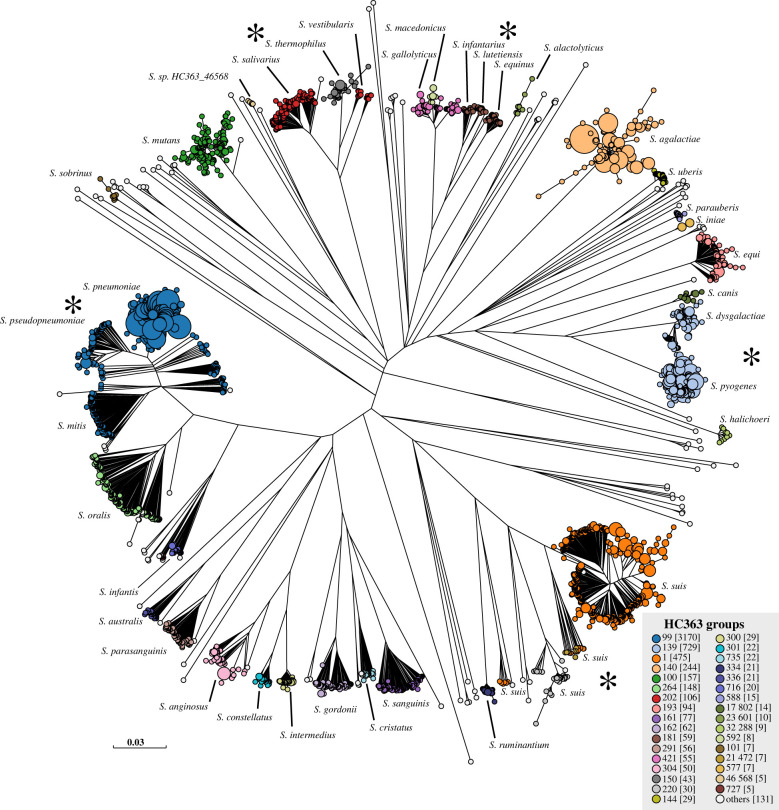
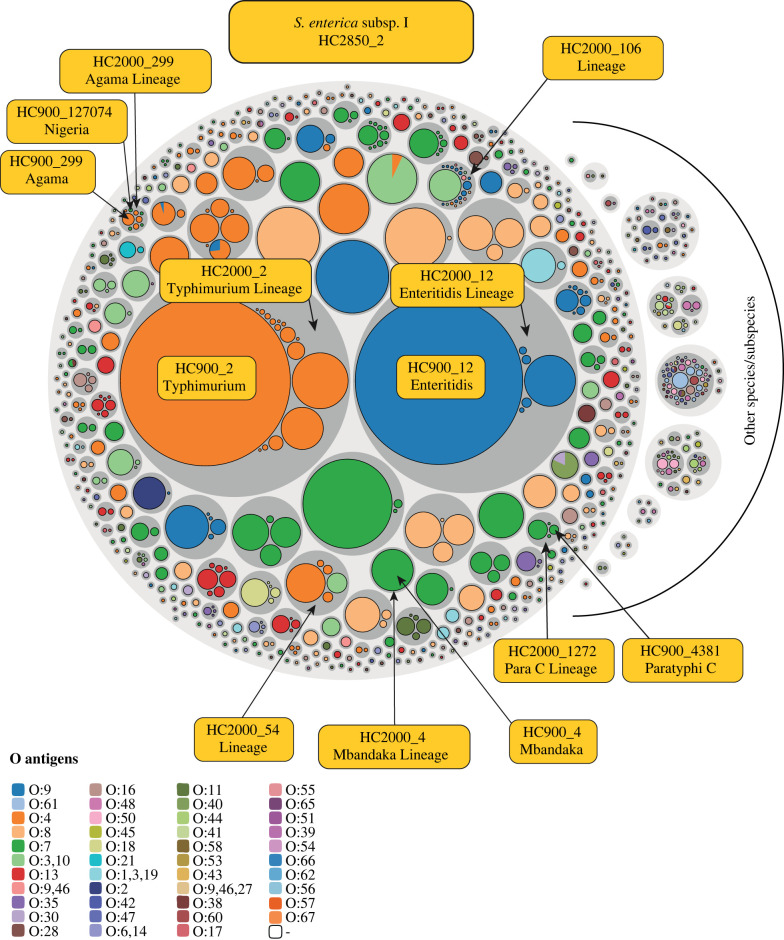
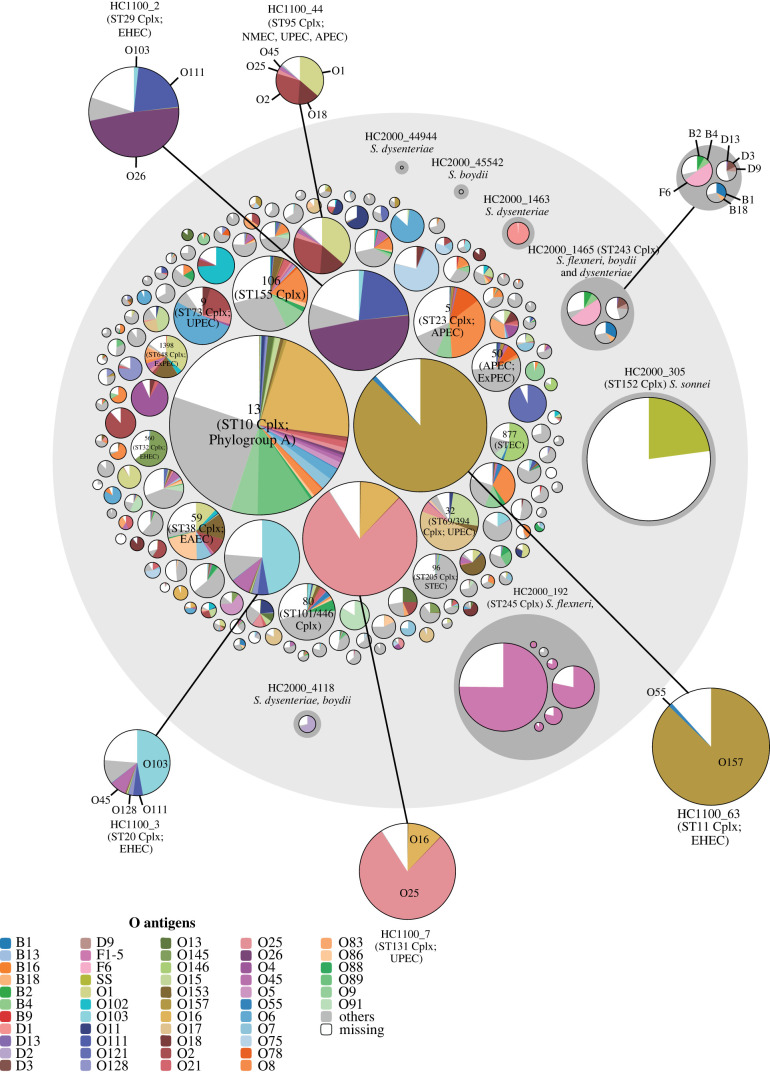
The definition of bacterial species is traditionally a taxonomic issue while bacterial populations are identified by population genetics. These assignments are species specific, and depend on the practitioner. Legacy multilocus sequence typing is commonly used to identify sequence types (STs) and clusters (ST Complexes). However, these approaches are not adequate for the millions of genomic sequences from bacterial pathogens that have been generated since 2012. EnteroBase (http://enterobase.warwick.ac.uk) automatically clusters core genome MLST allelic profiles into hierarchical clusters (HierCC) after assembling annotated draft genomes from short-read sequences. HierCC clusters span core sequence diversity from the species level down to individual transmission chains. Here we evaluate HierCC's ability to correctly assign 100 000s of genomes to the species/subspecies and population levels for Salmonella, Escherichia, Clostridoides, Yersinia, Vibrio and Streptococcus. HierCC assignments were more consistent with maximum-likelihood super-trees of core SNPs or presence/absence of accessory genes than classical taxonomic assignments or 95% ANI. However, neither HierCC nor ANI were uniformly consistent with classical taxonomy of Streptococcus. HierCC was also consistent with legacy eBGs/ST Complexes in Salmonella or Escherichia and with O serogroups in Salmonella. Thus, EnteroBase HierCC supports the automated identification of and assignment to species/subspecies and populations for multiple genera. This article is part of a discussion meeting issue 'Genomic population structures of microbial pathogens'.

Keywords: EnteroBase; accessory genome; big data; cgMLST; genomic databases; hierarchical clustering.


Figures

Figure 1.
Figure 1.
A comparison of species and subspecies assignments within Salmonella with HierCC and ANI. The figure shows an ML super-tree of 1 410 331 SNPs among 3002 core genes from 10 002 representative genomes of Salmonella (table 3). Former subspecies IIIa is designated S. arizonae in accordance with Pearce et al. 2021 [55]. (a) Partitions differentiated by ANI 95% clusters (legend) correspond to species S. enterica, S. bongori, S. arizonae and a new species, S. HC2850_215890 (five strains from the UK, 2018–2020), as indicated by arrows, and subspecies are not differentiated. (b) Partitions coloured by HC2850 clusters (legend). Arrows indicate HC2850_215890, and a new subspecies, HC2850_222931 (one strain from France, 2018). All other HC2850 clusters correspond to species (S. bongori and S. arizonae) or subspecies, except for HC2850_7171 (starred), which is subsp. enterica (I) according to the ML tree. An interactive version of this GrapeTree rendition can be found at https://enterobase.warwick.ac.uk/ms_tree?tree_id=53257. The corresponding presence/absence tree can be found at https://enterobase.warwick.ac.uk/ms_tree?tree_id=53258.
Figure 2.
Figure 2.
Maximum-likelihood core SNP tree of 967 Escherichia genomes consisting of one genome from each of 161 HC1100 clusters containing E. coli or Shigella as well as all 806 other Escherichia genomes in EnteroBase as of November 2020. The tree is coloured by (a) pairwise FastANI values clustered at the 95% level and (b) HC2350 cluster designations. The key legends indicate taxonomic designations in the literature which best match the cluster groupings. In (b), HC2350 cluster designations were used to mark novel taxonomic groupings in HC2350 clusters 89353, 89356, 89359 and 137132. An interactive version of this GrapeTree rendition can be found at https://enterobase.warwick.ac.uk/ms_tree?tree_id=52101. The corresponding presence/absence tree can be found at https://enterobase.warwick.ac.uk/ms_tree?tree_id=71125.
Figure 3.
Figure 3.
Species and subspecies assignments within Clostridioides according to 95% ANI (a) and HierCC (b). ML super-tree of 725 240 SNPs among 2556 core genes from 6724 representative genomes of Clostridioides difficile and one genome of Clostridioides mangenotii (table 3). (a) ANI 95% clusters differentiate C. mangenotii (cluster 1010) and five other clusters (clusters 255, 1370, 373, 2147, 1011) from C. difficile (cluster 0). Four of the 95% ANI clusters correspond to cryptic clades C-I (clusters 255, 373), C-II (cluster 1370) and C-III (cluster 2147) in the designations by Knight et al. [71]. Arrows indicate two additional clusters that were distinguished by HierCC in (b). (b) Partitions coloured by HierCC assign the same genomes to HC2500 clusters as ANI, except that HierCC assigns HC2500_15334 and HC2500_15408 designations to one genome each. An interactive version of this GrapeTree rendition can be found at https://enterobase.warwick.ac.uk/ms_tree?tree_id=53253 and a presence/absence tree can be found at https://enterobase.warwick.ac.uk/ms_tree?tree_id=53254.
Figure 4.
Figure 4.
Comparison of HC363 clusters with taxonomic designations in Streptococcus. ML super-tree of 263 080 SNPs among 372 core genes from 5937 representative Streptococcus genomes (table 3). Species names are indicated next to the phylogenetic clusters according to the locations of genomes from type strains and public metadata. Nodes were coloured by HC363 clusters, and exceptional assignments are indicated by asterisks next to S. pneumoniae and S. pseudopneumoniae, which were both HC363_99; multiple phylogenetic and HierCC clusters within S. suis; S. salivarius and S. vestibularis, which were both HC353_202; S. lutetiensis and S. equinus, which were both HC363_181; and S. dysgalactiae and S. pyogenes, which were both HC363_139. An interactive version of the GrapeTree rendition of the SNP tree can be found at https://enterobase.warwick.ac.uk/ms_tree?tree_id=53261 and the presence/absence tree at https://enterobase.warwick.ac.uk/ms_tree?tree_id=53262.
Figure 5.
Figure 5.
Hierarchical population structure of O serogroups in Salmonella. Hierarchical bubble plot of 310 901 Salmonella genomes in 790 HC900 clusters for which a consensus O serogroup could be deduced by metadata, or bioinformatic analyses with SeqSero V2 [89] or SISTR 1.1.1 [90]. Taxonomic level (HC level; colours): species/subspecies (HC2850; light grey circles), Lineages (HC2000; dark grey circles) and eBurst groups (HC900; O:group specific colours). Additional information is indicated by yellow text for selected HC2000 and HC900 circles which are specifically mentioned in the text. The diameters of HC900 circles are proportional to the numbers of genomes. An interactive version of this figure can be found at https://observablehq.com/@laurabaxter/salmonella-serovar-piechart from which the representation, raw data and d3 Java code [95] for generating the plot can be downloaded.
Figure 6.
Figure 6.
Hierarchical population structure of O serogroups in Escherichia coli/Shigella. Hierarchical bubble plot for 167 312 genomes of Escherichia coli or Shigella in HC2350_1 (large light grey circle) that were available in EnteroBase in April, 2021. Seven HC2000 Lineages encompassing 15 HC1100/ST Complexes of Shigella are shown at the right. HC2350_1 also includes 15 other E. coli HC2000 Lineages that each contains at least 50 E. coli genomes and encompass 144 other HC1100 clusters. The remainder of the figure shows those HC1100 clusters and not the corresponding HC2000 clusters. Numbers of genomes assigned to individual O serogroups (legend) are indicated by pie chart wedges within the HC1100 circles. Selected HC1100 clusters are also depicted with indications of phenotype and nomenclature at a larger scale outside the main circle, connected to the original circles by lines. An interactive version of this figure can be found at https://observablehq.com/@laurabaxter/escherichia-serovar-piechart, from which the representation, raw data and d3 Java code [95] for generating the plot can be downloaded.

References

    1. Achtman M, Zhou Z. 2014. Distinct genealogies for plasmids and chromosome. PLoS Genet. 10, e1004874. ( 10.1371/journal.pgen.1004874) - DOI - PMC - PubMed
    1. Kauffmann F. 1961. Die Bakteriologie der Salmonella-Species. Copenhagen, Denmark: Munksgaard.
    1. Morelli G, et al. 2010. Yersinia pestis genome sequencing identifies patterns of global phylogenetic diversity. Nature Genet. 42, 1140-1143. ( 10.1038/ng.705) - DOI - PMC - PubMed
    1. Achtman M, Zurth K, Morelli G, Torrea G, Guiyoule A, Carniel E. 1999. Yersinia pestis, the cause of plague, is a recently emerged clone of Yersinia pseudotuberculosis. Proc. Natl Acad. Sci. USA 96, 14 043-14 048. ( 10.1073/pnas.96.24.14043) - DOI - PMC - PubMed
    1. Pulford CV, et al. 2021. Stepwise evolution of Salmonella Typhimurium ST313 causing bloodstream infection in Africa. Nat. Microbiol. 6, 327-338. ( 10.1038/s41564-020-00836-1) - DOI - PMC - PubMed

Publication types

LinkOut - more resources