

Consensus clustering of gene expression profiles in peripheral blood of acute ischemic stroke patients
- PMID: 35989931
- PMCID: PMC9388856
- DOI: 10.3389/fneur.2022.937501
Consensus clustering of gene expression profiles in peripheral blood of acute ischemic stroke patients
Abstract
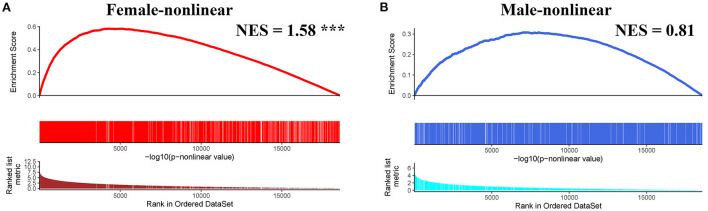
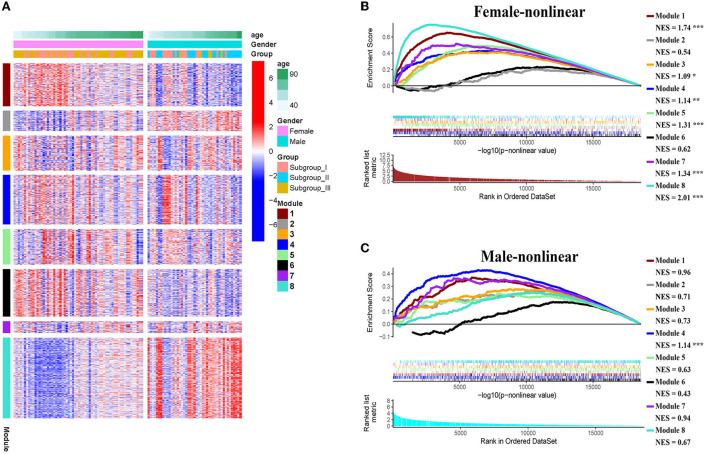
Acute ischemic stroke (AIS) is a primary cause of mortality and morbidity worldwide. Currently, no clinically approved immune intervention is available for AIS treatment, partly due to the lack of relevant patient classification based on the peripheral immunity status of patients with AIS. In this study, we adopted the consensus clustering approach to classify patients with AIS into molecular subgroups based on the transcriptomic profiles of peripheral blood, and we identified three distinct AIS molecular subgroups and 8 modules in each subgroup by the weighted gene co-expression network analysis. Remarkably, the pre-ranked gene set enrichment analysis revealed that the co-expression modules with subgroup I-specific signature genes significantly overlapped with the differentially expressed genes in AIS patients with hemorrhagic transformation (HT). With respect to subgroup II, exclusively male patients with decreased proteasome activity were identified. Intriguingly, the majority of subgroup III was composed of female patients who showed a comparatively lower level of AIS-induced immunosuppression (AIIS). In addition, we discovered a non-linear relationship between female age and subgroup-specific gene expression, suggesting a gender- and age-dependent alteration of peripheral immunity. Taken together, our novel AIS classification approach could facilitate immunomodulatory therapies, including the administration of gender-specific therapeutics, and attenuation of the risk of HT and AIIS after ischemic stroke.
Keywords: acute ischemic stroke; consensus clustering; immunosuppression; molecular subgroups; peripheral immunity; restricted cubic spline functions.
Copyright © 2022 Yang, Wang, Luo, Tsang and Huang.
Conflict of interest statement
The authors declare that the research was conducted in the absence of any commercial or financial relationships that could be construed as a potential conflict of interest.
Figures


Similar articles
-
Integrated Analysis of Competitive Endogenous RNA Networks in Acute Ischemic Stroke.Front Genet. 2022 Mar 25;13:833545. doi: 10.3389/fgene.2022.833545. eCollection 2022. Front Genet. 2022. PMID: 35401659 Free PMC article.
-
Gene expression in human peripheral blood mononuclear cells upon acute ischemic stroke.J Neurol. 2008 May;255(5):723-31. doi: 10.1007/s00415-008-0784-z. Epub 2008 May 15. J Neurol. 2008. PMID: 18465111
-
Increased Platelet-to-Lymphocyte Ratio is an Independent Predictor of Hemorrhagic Transformation and In-Hospital Mortality Among Acute Ischemic Stroke with Large-Artery Atherosclerosis Patients.Int J Gen Med. 2021 Nov 1;14:7545-7555. doi: 10.2147/IJGM.S329398. eCollection 2021. Int J Gen Med. 2021. PMID: 34754227 Free PMC article.
-
Prognostic value of the neutrophil-to-lymphocyte ratio in acute ischemic stroke patients treated with intravenous thrombolysis: a systematic review and meta-analysis.BMC Neurol. 2021 May 11;21(1):191. doi: 10.1186/s12883-021-02222-8. BMC Neurol. 2021. PMID: 33975565 Free PMC article.
-
Platelet glycoprotein IIb/IIIa inhibitors in acute ischemic stroke.Neurol India. 2008 Oct-Dec;56(4):399-404. doi: 10.4103/0028-3886.44571. Neurol India. 2008. PMID: 19127033 Review.
Cited by
-
Identification and validation of platelet-related diagnostic markers and potential drug screening in ischemic stroke by integrating comprehensive bioinformatics analysis and machine learning.Front Immunol. 2024 Jan 10;14:1320475. doi: 10.3389/fimmu.2023.1320475. eCollection 2023. Front Immunol. 2024. PMID: 38268925 Free PMC article.
-
Transcriptomic profiling of burn patients reveals key lactylation-related genes and their molecular mechanisms.Front Med (Lausanne). 2025 Jun 27;12:1554791. doi: 10.3389/fmed.2025.1554791. eCollection 2025. Front Med (Lausanne). 2025. PMID: 40655111 Free PMC article.
-
Role of RNA polymerase III transcription and regulation in ischaemic stroke.RNA Biol. 2024 Jan;21(1):1-10. doi: 10.1080/15476286.2024.2409554. Epub 2024 Oct 3. RNA Biol. 2024. PMID: 39363536 Free PMC article. Review.
-
Machine learning consensus clustering for inflammatory subtype analysis in stroke and its impact on mortality risk: a study based on NHANES (1999-2018).Front Neurol. 2025 Apr 10;16:1562247. doi: 10.3389/fneur.2025.1562247. eCollection 2025. Front Neurol. 2025. PMID: 40276469 Free PMC article.
References
-
- Benjamin EJ, Blaha MJ, Chiuve SE, Cushman M, Das SR, Deo R, et al. . American Heart Association statistics, and s. stroke statistics, heart disease and stroke statistics-2017 update: a report from the American Heart Association. Circulation. (2017) 135:e146–603. 10.1161/CIR.0000000000000491 - DOI - PMC - PubMed
LinkOut - more resources
Full Text Sources