

Artificial intelligence-aided diagnosis model for acute respiratory distress syndrome combining clinical data and chest radiographs
- PMID: 35990108
- PMCID: PMC9386858
- DOI: 10.1177/20552076221120317
Artificial intelligence-aided diagnosis model for acute respiratory distress syndrome combining clinical data and chest radiographs
Abstract
Objective: The aim of this study was to develop an artificial intelligence-based model to detect the presence of acute respiratory distress syndrome (ARDS) using clinical data and chest X-ray (CXR) data.
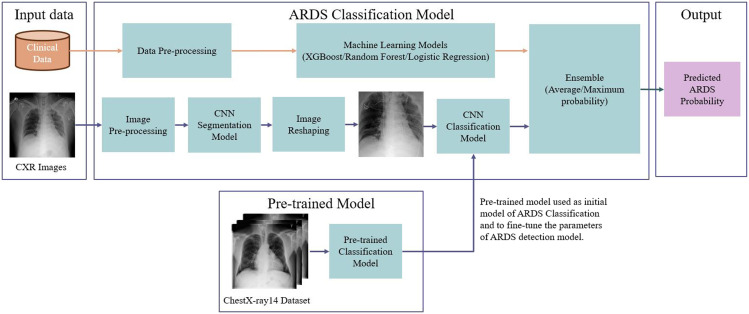
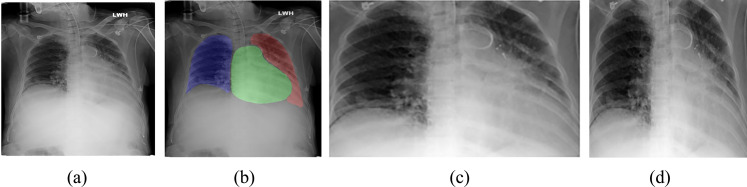
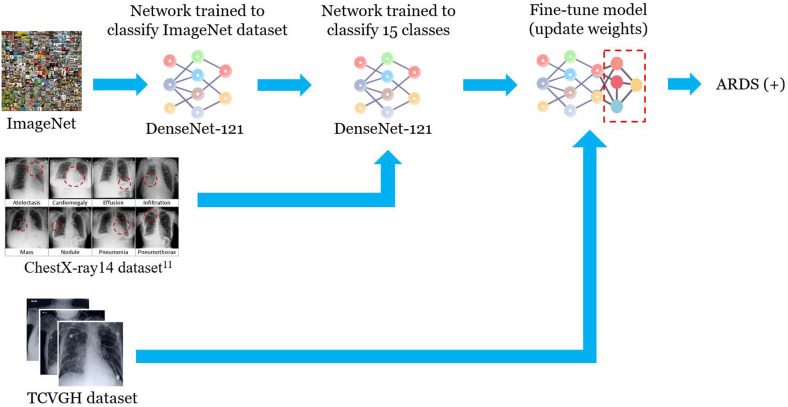
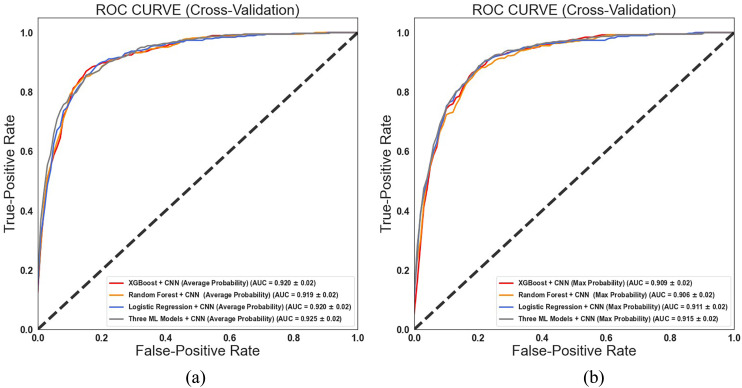
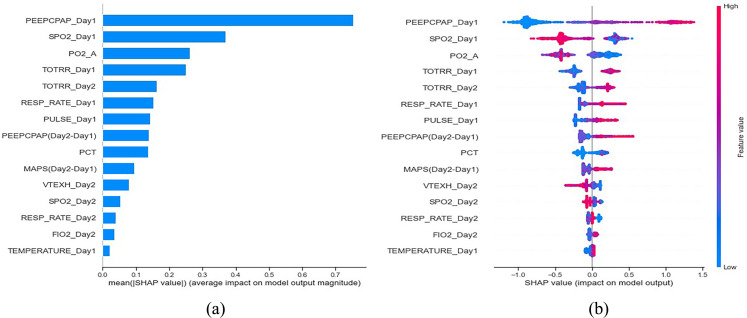
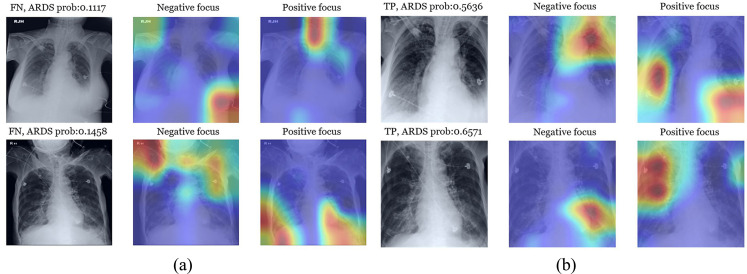
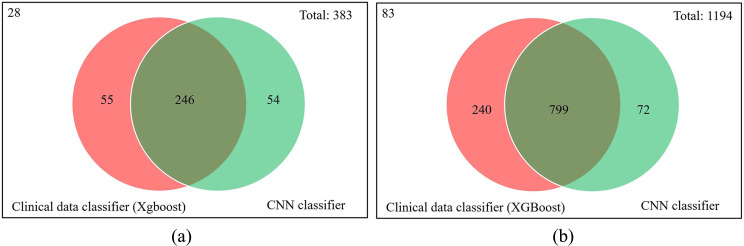
Method: The transfer learning method was used to train a convolutional neural network (CNN) model with an external image dataset to extract the image features. Then, the last layer of the model was fine-tuned to determine the probability of ARDS. The clinical data were trained using three machine learning algorithms-eXtreme Gradient Boosting (XGB), random forest (RF), and logistic regression (LR)-to estimate the probability of ARDS. Finally, ensemble-weighted methods were proposed that combined the image model and the clinical data model to estimate the probability of ARDS. An analysis of the importance of clinical features was performed to explore the most important features in detecting ARDS. A gradient-weighted class activation mapping (Grad-CAM) model was used to explain what our CNN sees and understands when making a decision.
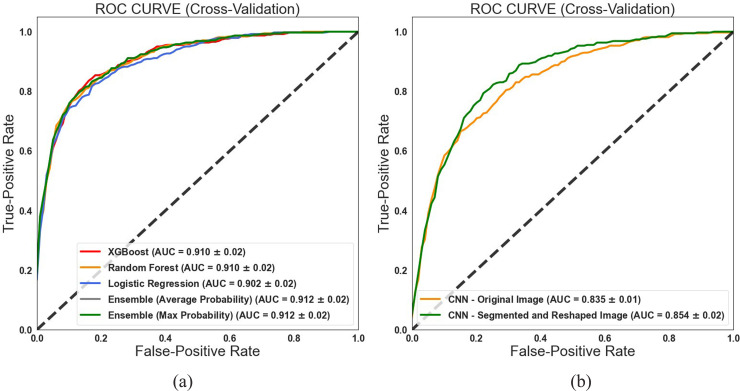
Results: The proposed ensemble-weighted methods improved the performances of the ARDS classifiers (XGB + CNN, area under the curve [AUC] = 0.916; RF + CNN, AUC = 0.920; LR + CNN, AUC = 0.920; XGB + RF + LR + CNN, AUC = 0.925). In addition, the ML model using clinical data to present the top 15 important features to identify the risk factors of ARDS.
Conclusion: This study developed combined machine learning models with clinical data and CXR images to detect ARDS. According to the results of the Shapley Additive exPlanations values and the Grad-CAM techniques, an explicable ARDS diagnosis model is suitable for a real-life scenario.
Keywords: Acute respiratory distress syndrome; artificial intelligence; chest X-ray; clinical data; ensemble-weighted model; machine learning.
© The Author(s) 2022.
Figures
Similar articles
-
To Establish an Early Prediction Model for Acute Respiratory Distress Syndrome in Severe Acute Pancreatitis Using Machine Learning Algorithm.J Clin Med. 2023 Feb 21;12(5):1718. doi: 10.3390/jcm12051718. J Clin Med. 2023. PMID: 36902504 Free PMC article.
-
Deep learning to detect acute respiratory distress syndrome on chest radiographs: a retrospective study with external validation.Lancet Digit Health. 2021 Jun;3(6):e340-e348. doi: 10.1016/S2589-7500(21)00056-X. Epub 2021 Apr 20. Lancet Digit Health. 2021. PMID: 33893070 Free PMC article.
-
Prediction of Acute Respiratory Distress Syndrome in Traumatic Brain Injury Patients Based on Machine Learning Algorithms.Medicina (Kaunas). 2023 Jan 15;59(1):171. doi: 10.3390/medicina59010171. Medicina (Kaunas). 2023. PMID: 36676795 Free PMC article.
-
Analytics with artificial intelligence to advance the treatment of acute respiratory distress syndrome.J Evid Based Med. 2020 Nov;13(4):301-312. doi: 10.1111/jebm.12418. Epub 2020 Nov 13. J Evid Based Med. 2020. PMID: 33185950 Review.
-
A systematic review of machine learning models for management, prediction and classification of ARDS.Respir Res. 2024 Jun 4;25(1):232. doi: 10.1186/s12931-024-02834-x. Respir Res. 2024. PMID: 38834976 Free PMC article. Review.
Cited by
-
Assessing Yemeni university students' public perceptions toward the use of artificial intelligence in healthcare.Sci Rep. 2024 Nov 16;14(1):28299. doi: 10.1038/s41598-024-80203-w. Sci Rep. 2024. PMID: 39550433 Free PMC article.
-
Assessing severity of pediatric pneumonia using multimodal transformers with multi-task learning.Digit Health. 2024 Dec 20;10:20552076241305168. doi: 10.1177/20552076241305168. eCollection 2024 Jan-Dec. Digit Health. 2024. PMID: 39711742 Free PMC article.
-
Imaging the Lung in ARDS: A Primer.Respir Care. 2024 Jul 24;69(8):1011-1024. doi: 10.4187/respcare.12061. Respir Care. 2024. PMID: 39048146 Free PMC article. Review.
-
Integrating Machine Learning into Statistical Methods in Disease Risk Prediction Modeling: A Systematic Review.Health Data Sci. 2024 Jul 23;4:0165. doi: 10.34133/hds.0165. eCollection 2024. Health Data Sci. 2024. PMID: 39050273 Free PMC article. Review.
-
Ten misconceptions regarding decision-making in critical care.World J Crit Care Med. 2024 Jun 9;13(2):89644. doi: 10.5492/wjccm.v13.i2.89644. eCollection 2024 Jun 9. World J Crit Care Med. 2024. PMID: 38855268 Free PMC article. Review.
References
-
- Bellani G, Laffey JG, Pham T, et al.. Epidemiology, patterns of care, and mortality for patients with acute respiratory distress syndrome in intensive care units in 50 countries. JAMA 2016; 315: 788–800. - PubMed
-
- Rubenfeld GD, Caldwell E, Peabody E, et al.. Incidence and outcomes of acute lung injury. N Engl J Med 2005; 353: 1685–1693. - PubMed
-
- Ware LB, Matthay MA. The acute respiratory distress syndrome. N Engl J Med 2000; 342: 1334–1349. - PubMed
-
- Thompson BT, Chambers RC, Liu KD. Acute respiratory distress syndrome. N Engl J Med 2017; 377: 562–572. - PubMed
-
- ARDS Definition Task Force, Ranieri VM, Rubenfeld GD, et al.. Acute respiratory distress syndrome: the Berlin definition. JAMA 2012; 307: 2526–2533. - PubMed
LinkOut - more resources
Full Text Sources
Other Literature Sources
