Review
. 2022 Aug 12;7(8):2490-2514.
doi: 10.1021/acsenergylett.2c01099. Epub 2022 Jul 9.

Advances in Perovskites for Photovoltaic Applications in Space

Affiliations
Review

Advances in Perovskites for Photovoltaic Applications in Space

Valentino Romano et al. ACS Energy Lett. .

Abstract

Perovskites have emerged as promising light harvesters in photovoltaics. The resulting solar cells (i) are thin and lightweight, (ii) can be produced through solution processes, (iii) mainly use low-cost raw materials, and (iv) can be flexible. These features make perovskite solar cells intriguing as space technologies; however, the extra-terrestrial environment can easily cause the premature failure of devices. In particular, the presence of high-energy radiation is the most dangerous factor that can damage space technologies. This Review discusses the status and perspectives of perovskite photovoltaics in space applications. The main factors used to describe the space environment are introduced, and the results concerning the radiation hardness of perovskites toward protons, electrons, neutrons, and γ-rays are presented. Emphasis is given to the physicochemical processes underlying radiation damage in such materials. Finally, the potential use of perovskite solar cells in extra-terrestrial conditions is discussed by considering the effects of the space environment on the choice of the architecture and components of the devices.


Conflict of interest statement

The authors declare no competing financial interest.

Figures

Figure 1
Figure 1
Schematic illustration of the perovskite crystal structure where A and B are cations and X is an anion.
Figure 2
Figure 2
Comparison between several commercially available SCs used for space application and some representative devices of promising alternatives under investigation.
Figure 3
Figure 3
(a) Representation of the main components of earth’s atmosphere. The green and pink pseudotoroids indicate the inner and outer Van Allen radiation belts, respectively. (b) Flux of electron and proton radiation as a function of altitude (expressed in Earth radii). Reprinted with permission from ref (47). Copyright 2020 NASA.
Figure 4
Figure 4
(a) Normalized JSC (red dots), VOC (blue rhombuses), FF (black triangles), and PCE (purple dots, termed η) for MAPI-based SCs reported as functions of the accumulated proton doses. For comparison, the JSC of a Si photodiode is also shown (blue line). The red rhombus refers to the PCE obtained when the correction, due to the glass/ITO substrate losses, is taken into account. (b) Transmittance of the glass/ITO substrate at nonirradiated conditions (black line) and at proton doses of 7.78 × 10¹¹ particles cm–2 (blue dashed line) and 7.75 × 10¹² particles cm–2 (red dotted line). The proton-induced variations, with respect to nonirradiated case, are shown as ΔT with the same color legend. The difference in internal quantum efficiency (ΔIQE) is also reported (aqua green line). (c) Comparison of the normalized photovoltaic parameters for reference and irradiated devices, measured after the irradiation experiments. Reprinted with permission from ref (71). Copyright 2016 Wiley.
Figure 5
Figure 5
(a) Relative proton induced quantum efficiency (PEQE/PEQE(Φ = 0)) for SiC (top) and Cs0.05MA0.17FA0.83Pb(Br0.17I0.83)3 irradiated with protons with energies of 20 and 68 MeV. (b) Relative variation (with respect to measurements conducted under no bombardment) of the photovoltaic parameters JSC, VOC, FF, and PCE (η in the figure) for Cs0.05MA0.17FA0.83Pb(Br0.17I0.83)3-based PSCs under irradiation with protons with energies of 20 MeV (blue line) and 68 MeV (red line) and variable flux. (c) Comparisons of the photovoltaic parameters measured before and after irradiation of the devices with protons with energies of 20 (blue line) and 68 (red line) MeV. (d) Linear and semilogarithmic JV curves measured in dark conditions for nonirradiated devices (solid lines) and irradiated with protons having energies of 20 MeV (blue line) and 68 MeV (red line). (e) Comparisons of the differential resistance for reference and bombarded devices. (f) Normalized PL decays of reference (full red circles) and irradiated [with protons having energies of 20 MeV (empty blue squares) and 68 MeV (empty red circles)] Cs0.05MA0.17FA0.83Pb(Br0.17I0.83)3 samples (deposited onto quartz). The inset reports values of τ2 calculated at different laser fluences. (g) Comparison of the PL spectra for reference and irradiated Cs0.05MA0.17FA0.83Pb(Br0.17I0.83)3 samples (deposited onto quartz) (the same legend of panel f applies to this case). (h) Measured VOC decay for reference (solid line) and irradiated (dashed line) devices. (i) Comparisons of simulated and measured PL decays of Cs0.05MA0.17FA0.83Pb(Br0.17I0.83)3 thin films (deposited onto quartz) before and after irradiation with protons having 68 MeV energy. Reprinted with permission from ref (7). Copyright 2019 Royal Society of Chemistry.
Figure 6
Figure 6
(a) Comparison of the JV curves for reference (red lines) and bombarded with electrons having 1 MeV energy at a fluence of 1.3 × 10¹³ particles cm–2 (blue lines) and 1 × 10¹⁵ particles cm–2 (green lines). (b–d) Comparison of the EDX spectra measured for reference PSCs (red line) and PSCs bombarded with electrons having 1 MeV energy at a fluence of 1.3 × 10¹³ particles cm–2 (blue lines) and 1 × 10¹⁵ particles cm–2 (green lines). (h–j) Laser beam-induced current measurements for reference (h) and bombarded PSCs with electrons having 1 MeV energy at a fluence 1.3 × 10¹³ particles cm–2 (i) and 1 × 10¹⁵ particles cm–2 (j). Reprinted with permission from ref (84). Copyright 2019 American Chemical Society.
Figure 7
Figure 7
(a) Comparisons of the JV curves for PSCs irradiated with electrons having 1 MeV energy at doses of 1014 particles cm–2 (pink line), 1015 particles cm–2 (cyan line), and 1016 particles cm–2 (green line). (b) Evolution of the PCE for PSCs before (empty symbols) and after (full symbols) irradiation at the aforementioned doses. Photoconductivity, as measured through time-resolved microwave conductivity experiments, of MAPbI3 thin films deposited on quartz. Reprinted with permission from ref (86). Copyright 2020 Wiley.
Figure 8
Figure 8
(a and b) Comparisons of the JV curves for perovskite/CIGS (a) and perovskite/Si (b) tandem devices (solid lines for reference devices, dashed lines for irradiated solar cells). The maximum power point is indicated by the full circles, while the insets report the power output, at the maximum power point, as a function of time. (c and e) Comparisons of the quasi-Fermi level splitting and VOC of perovskite/CIGS (c) and perovskite/Si (e) devices before and after the irradiation tests. (d and f) Quasi-Fermi level splitting as a function of the logarithm of the excitation intensity which allows the extrapolation of the ideality factors. Reprinted with permission from ref (41). Copyright 2020 Elsevier.
Figure 9
Figure 9
(a) Evolution of the PL emission of Cs0.15MA0.10FA0.75Pb(Br0.17I0.83)3 perovskite films at γ-ray doses up to 5000 Gy. (b) Comparison of PL spectra of Cs0.15MA0.10FA0.75Pb(Br0.17I0.83)3 perovskite films at γ-ray doses up to 5000 Gy, measured 2 weeks after the spectra reported in panel a. (c) PL spectra of Cs0.15MA0.10FA0.75Pb(Br0.17I0.83)3 perovskite films measured under green laser light (532 nm) illumination at different exposure time. (d) Time evolution of the PL emission of the samples, illuminated under the conditions reported in panel c and kept in the dark for times up to 20 h. Reprinted with permission from ref (95). Copyright 2019 American Chemical Society.
Figure 10
Figure 10
(a) Comparison of the JV curves measured on Cs0.05MA0.14FA0.81PbBr0.45I2.55-based solar cells, before and after irradiation tests. (b) Variation of the transmittance spectrum of the glass/ITO substrate used for the fabrication of PSCs. The ΔT line indicates the transmittance loss associated with radiation-induced degradation. (c) Proposed self-healing mechanism of γ-ray-induced degradation in perovskites. Reprinted with permission from ref (98). Copyright 2018 Wiley.
Figure 11
Figure 11
(a and b) Comparison of the EQE measurements on reference (black line) and irradiated (at 1000 kRad = 10000 Gy, red lines) MAPbI3 (a) and Cs0.10MA0.15FA0.75PbI3 (b). The solid red line refers to experimentally obtained data, while the dashed lines indicate simulated data, obtained by removing the effects due to γ-ray degradation induced on the glass/ITO substrate. (c and d) Evolution of the PCE of MAPbI3 (c) and Cs0.10MA0.15FA0.75PbI3 (b) devices as a function of the accumulated γ-ray dose. (e) Proposed mechanism for the self-healing of MAPbI3 perovskites. Details are reported in the text. Reprinted with permission from ref (107). Copyright 2020 American Chemical Society.
Figure 12
Figure 12
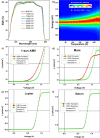
(a) Time evolution of the IV curves for illuminated nonirradiated and (b) for neutron-irradiated illuminated MAPbI3–xClx-based p-i-n PSCs (measurements taken every 15 min). (c) Evolution of the PV parameters, I0, RS, and RSH for illuminated nonirradiated and (d) for neutron-irradiated illuminated devices. (e) IV characteristics taken before (blue line) and after (red line) the set of measurements reported in panel a for illuminated nonirradiated devices. (f) IV characteristics taken before (blue line) and after (red line) the set of measurements reported in panel b for illuminated neutron-irradiated devices. Reprinted with permission from ref (110). Copyright 2019 Royal Society of Chemistry.
Figure 13
Figure 13
(a) Comparison of the PCE retention under UV illumination for PSCs using spiro/Au or CuSCN/C ad hole-transporting materials and electrodes. Reprinted with permission from ref (134). Copyright 2019 Wiley. (b) Temperature evolution of charge carrier diffusion length of MAPbI3 thin films, as obtained by using data from time-resolved PL and optical-pump THz-probe experiments. Reprinted with permission from ref (142). Copyright 2015 Wiley.
Figure 14
Figure 14
(a and b) Temperature evolution of the EQE (a) and PL (b) of (FA0.79MA0.16Cs0.05)0.97Pb(I0.84Br0.16)2.97-based solar cells. (c–f) JV curves measured at temperature and intensity conditions typical of low-Earth orbit (c), Mars (d), Jupiter (e), and Saturn (f). Reprinted with permission from ref (157). Copyright2018 American Chemical Society.

Similar articles

Cited by

References

    1. Jones H.The recent large reduction in space launch cost. In 48th International Conference on Environmental Systems, 2018.
    1. Aerospace Security . Available at https://aerospace.csis.org/data/space-launch-to-low-earth-orbit-how-much... (accessed 2022-05-29).
    1. Hepp A. F.; et al. Ultra-lightweight space power from hybrid thin-film solar cells. IEEE Aerosp. Electron. Syst. Mag. 2008, 23, 31–41. 10.1109/MAES.2008.4635069. - DOI
    1. International Space Station. Available at https://www.nasa.gov/mission_pages/station/structure/elements/solar_arra... (accessed 2022-05-29).
    1. Yang J.; Bao Q.; Shen L.; Ding L. Potential applications for perovskite solar cells in space. Nano Energy 2020, 76, 105019.10.1016/j.nanoen.2020.105019. - DOI