. 2022 May;1(5):462-475.
doi: 10.1038/s44161-022-00063-3. Epub 2022 May 12.

Single cell transcriptomics and TCR reconstruction reveal CD4 T cell response to MHC-II-restricted APOB epitope in human cardiovascular disease

Affiliations

Single cell transcriptomics and TCR reconstruction reveal CD4 T cell response to MHC-II-restricted APOB epitope in human cardiovascular disease

Ryosuke Saigusa et al. Nat Cardiovasc Res. 2022 May.

Abstract

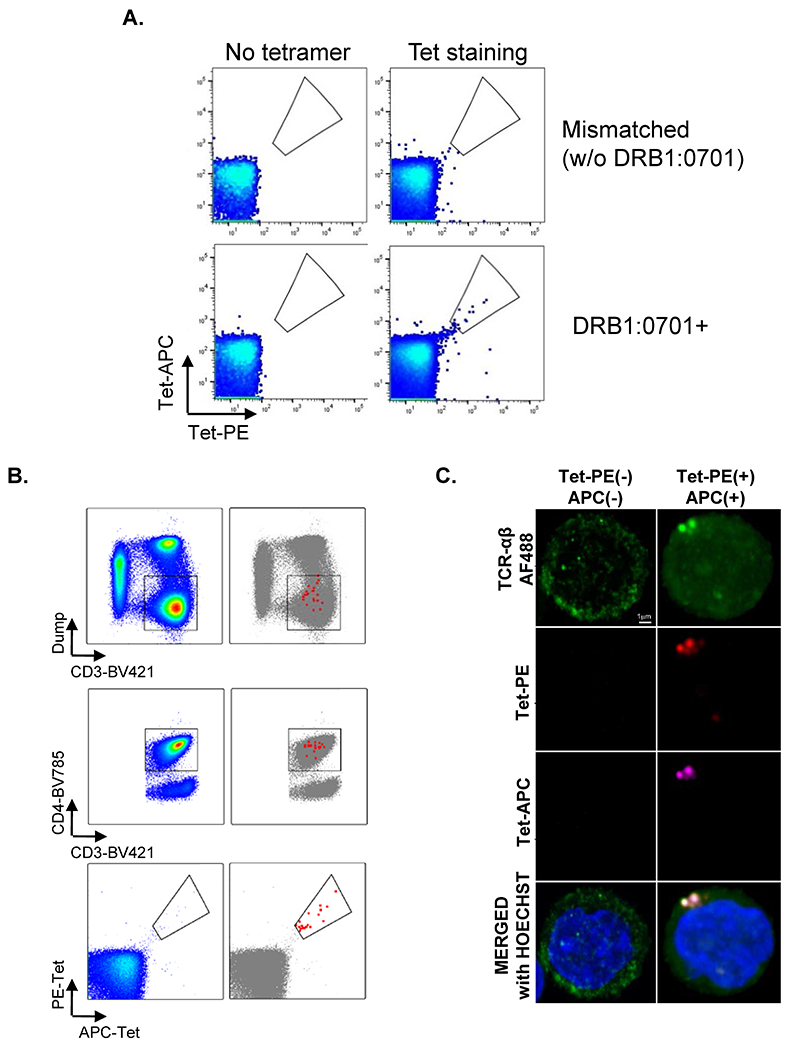
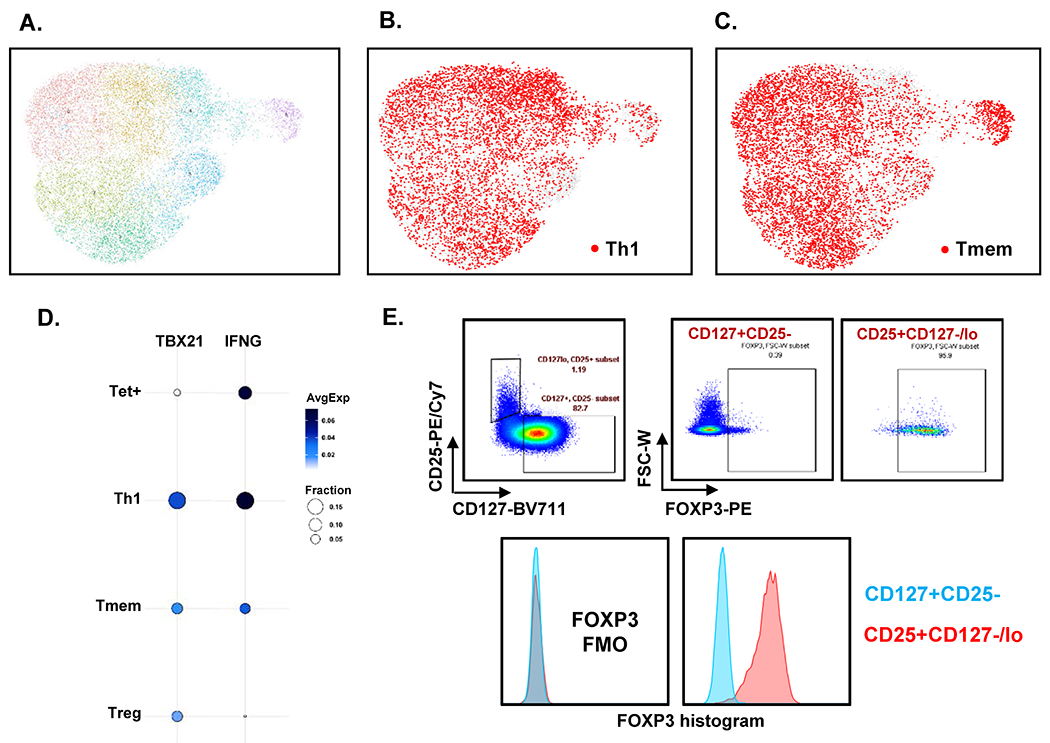
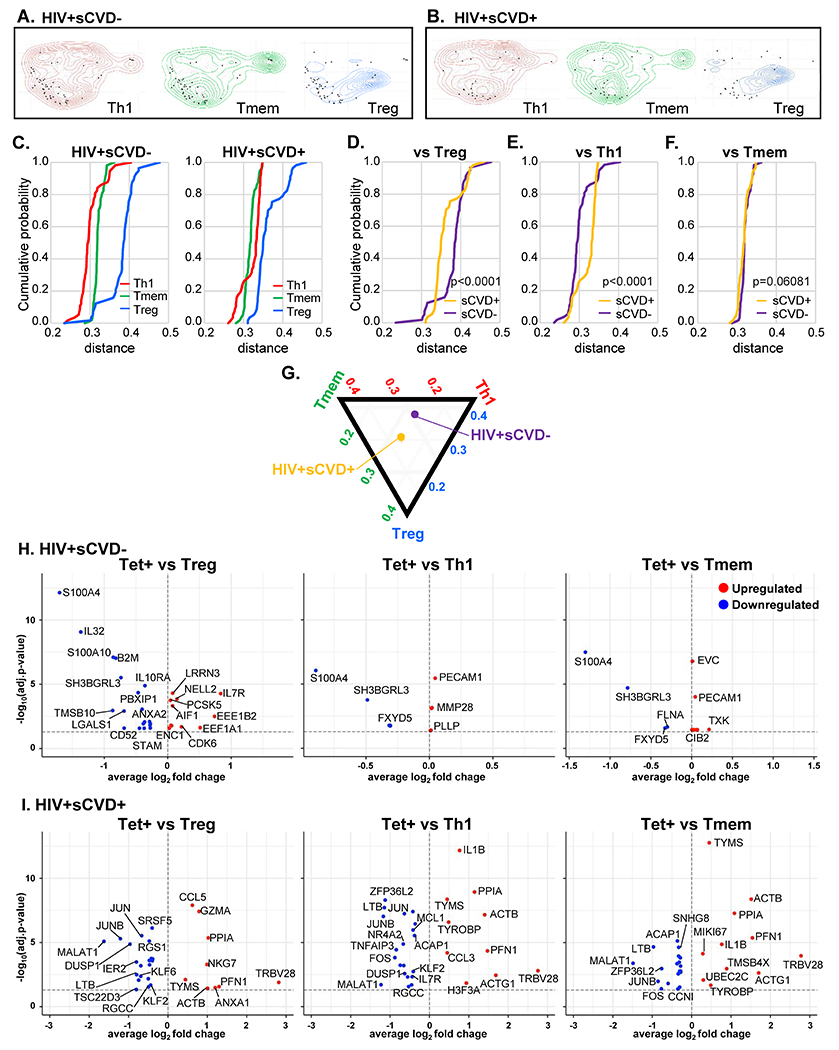
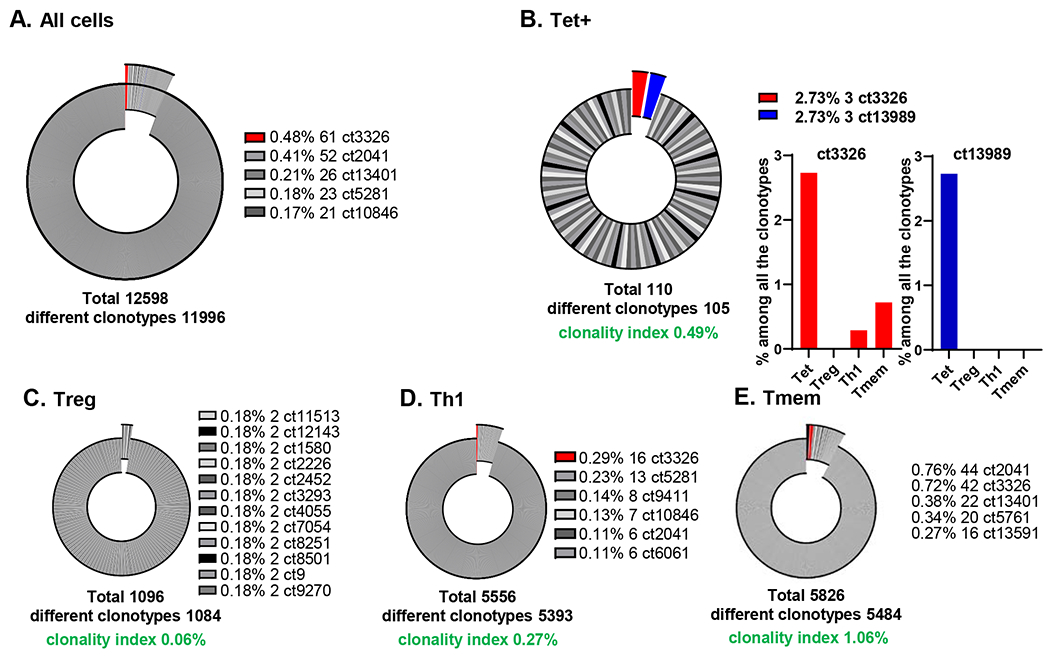
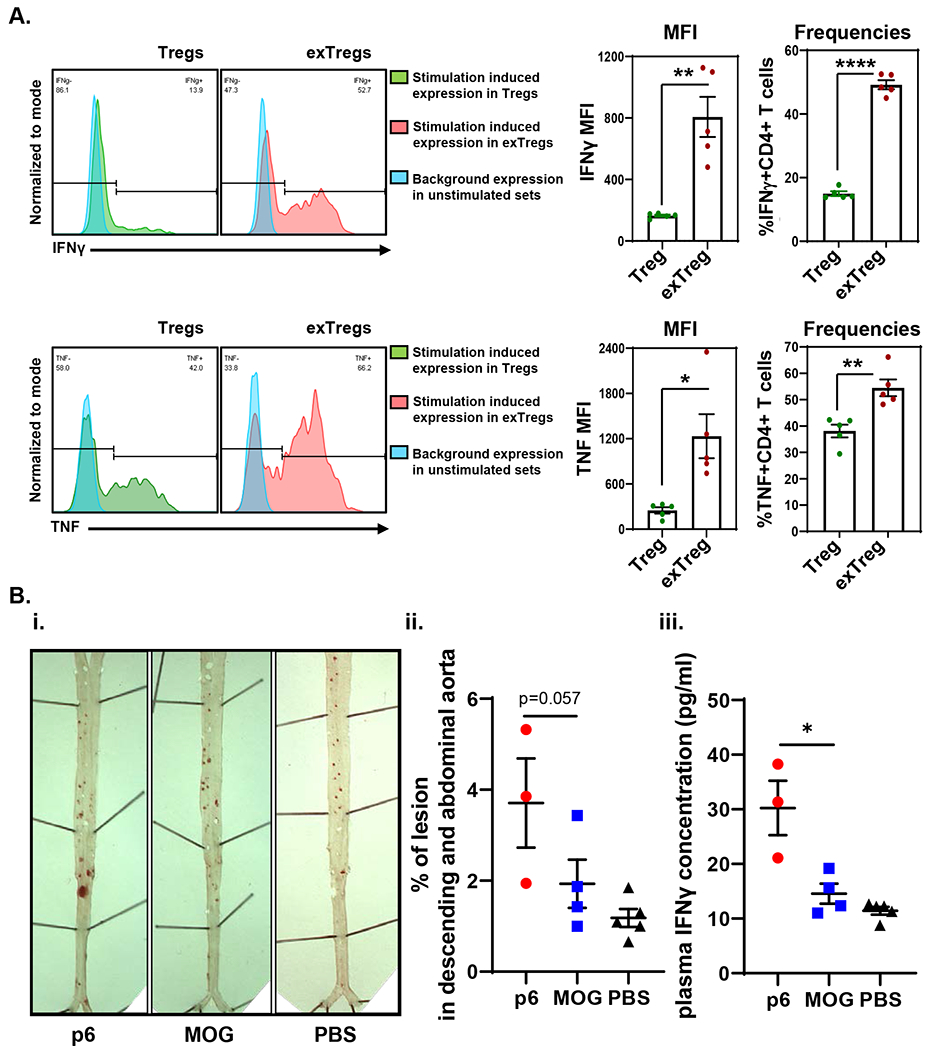
Atherosclerosis is accompanied by a CD4 T cell response to apolipoprotein B (APOB). Major Histocompatibility Complex (MHC)-II tetramers can be used to isolate antigen-specific CD4 T cells by flow sorting. Here, we produce, validate and use an MHC-II tetramer, DRB1*07:01 APOB-p18, to sort APOB-p18-specific cells from peripheral blood mononuclear cell samples from 8 DRB1*07:01+ women with and without subclinical cardiovascular disease (sCVD). Single cell RNA sequencing showed that transcriptomes of tetramer+ cells were between regulatory and memory T cells in healthy women and moved closer to memory T cells in women with sCVD. TCR sequencing of tetramer+ cells showed clonal expansion and V and J segment usage similar to those found in regulatory T cells. These findings suggest that APOB-specific regulatory T cells may switch to a more memory-like phenotype in women with atherosclerosis. Mouse studies showed that such switched cells promote atherosclerosis.


Conflict of interest statement

DISCLOSURES There are no conflicts of interest.

Figures

Extended Data Fig. 1.
Extended Data Fig. 1.. MHC-II tetramer DRB1*07:01 APOB-p18 validation.
Peripheral blood mononuclear cells from healthy donors with DRB1:701 and with other DRB1 rather than DRB1:0701 were gated on CD3+CD4+TCRαβ+ CD4+. A, From the gated cells, we detected tetramer-PE and tet-APC double positive cells in the donor with DRB1:0701+ (right bottom), while no Tet+ cells were detected in no tetramer staining (left column) and mismatched controls (without DRB1*0701, right top). B, Backgating showed that tet-PE and tet-APC positive cells were in CD3+CD4+Dump−. To estimate the false positive rate of tetramer binding, we calculated the combinational specificity of tetramer binding. Let the fraction of APC-single positive cells in CD4 T cells be p(APC), the fraction of PE-single positive cells be p(PE), and the fraction of double positive cells be p(DP), then specificity can be calculated. Non-specific binding would randomly produce APC+PE− or APC-PE+ (single positive) cells. If all tetramer binding were non-specific, the fraction of DP would be expected to be equal to the product of p(APC) times p(PE). The fraction of true specific binding of tetramer APC and PE double positive cells in CD4 T cells can be calculated by p(DP)-p(APC)*p(PE). [p(DP)-p(APC)*p(PE)]/p(DP) was above 99.99% in all experiments (99.99782452%, 99.9998338%, 99.99946356% and 99.99800718%). Thus, there is negligible false positive staining. C, Confocal microscopy of human CD4+ T cells from donors with DRB1:701 after incubation with PE− and APC-labeled apoB: MHC-II tetramer DRB1*07:01 APOB-p18 and anti-TCR-β-FITC. The result was repeated once.
Extended Data Fig. 2.
Extended Data Fig. 2.. Schematic summary of sorting and hashtag oligo (HTO) staining.
Tet+ cells, Th1 cells, Treg, and CXCR3-memory T cells (Tmem) were sorted into 4 different tubes, and were stained with antibodies with hash tag oligo (HTO1-4). Treg, Th1, and Tmem were pre-gated for CD45RA−. After staining of HTO antibody, tet+ cells weren’t washed, not to lose any cells, because one wash would lose almost half of the cells. Other cells (Th1, Treg and Tmem) were washed three times following to the manufacturer’s instruction. The volume of each HTO antibody had previously been titrated. The cell number of these three cell types (Th1, Treg and Tmem) was appropriately adjusted, and they are merged into the tet+ cell tube. At the same time, bulk CD4 T cells from a healthy donor were merged into the tube for the following batch correction. After that, the sample proceeded to barcording, cDNA amplication, library preparation, and sequencing.
Extended Data Fig. 3.
Extended Data Fig. 3.. The analysis of the usage of TCRα and β, separately.
Separate TCR clonotypes of the TCRα and β sequences and VDJ usage. A-E, Pie chart for all the TCRβ clonotypes from all the cells (A) and each 4 cell type (B, Tet+; C, Treg; D, Th1; E, Tmem), with clonality index. F-J, Pie chart for all the TCRα clonotypes from all the cells (F) and each 4 cell type (G, Tet+; H, Treg; I, Th1; J, Tmem), with clonality index. Clonotypes with more than 1 clone exploded in the graph. Top 5 clonotypes with more than 1 clone are as shown. ct, clonotype. Clonotype3326, which was expanded in Tet+ cells, are shared with other cell types, and highlighted in red.
Extended Data Fig. 4.
Extended Data Fig. 4.. UMAPs of Th1 and Tmem, and signature genes and molecule expressions.
A, UMAP with Louvain clustering of all 16,644 cells. B, C, UMAP of Th1 (B) and Tmem (C) highlighted in red. Other cells light grey. D, Expression levels of Th1 signature genes on 4 cell types. TBX21 and IFNG expressions are shown. Dot plot: fraction of cells in cluster expressing each gene shown by size of circle and level of expression shown from white (=0) to dark blue (=max, log2 scale). E, We checked FoxP3 expression in CD3+CD4+CD127−CD25+ cells and the percentage was 91.3±4.06% (Mean±SD), The representative image of plots and the histogram of FoxP3 expression was shown.
Extended Data Fig. 5.
Extended Data Fig. 5.. UMAPs of tet+ cells from sCVD− and sCVD+ participants without HIV
A, B, APOB-p18 DRB1*07:01 tetramer positive cells (tet+ cells, solid circles) are plotted in UMAP of cell from HIV−sCVD− participants (A), from HIV−sCVD+ participants (B). Treg, Th1 and Tmem distribution are shown as contour plots of density.
Extended Data Fig. 6
Extended Data Fig. 6. The analysis of the similarity of tet+ cells to other cell types in HIV+.
APOB-p18 DRB1*07:01 tetramer positive cells (Tet+ cells, solid circles) are plotted in UMAP of cell from HIV+sCVD− participants (A), from HIV+sCVD+ participants (B). Treg, Th1 and Tmem distribution are shown as contour plots of density. C, Cumulative histogram of the distances of each Tet+ cells against Tmem, Treg and Th1 in HIV-. D-F, Cumulative histograms of the distances of each of the Tet+ cells against Treg (D), Th1 (E), and Tmem (F) cells, separately for sCVD+ (yellow) and sCVD− (purple) and HIV+ in the first 6 PCA components. Significance by Kolmogorov-Smirnov test. G, A Ternary plot of relative median positions of Tet+ cells relative to pseudobulk mean of Tregs, Th1 and Tmem in the first 6 PCA components in HIV+. H, I, Volcano plots comparing gene expression in single cells of tet+ cells compared to Treg, Th1, and Tmem in HIV+sCVD− (H), and HIV+sCVD+ (I). Differential expression analysis was performed using Seurat’s non-parametric Wilcoxon rank-sum test to extract marker genes. Significant markers were selected based on Bonferroni-adjusted P-Values <0.05. Colored dots (upregulated genes in red, and downregulated genes in blue) indicate significantly differentiated expressed genes (adjusted p-value <0.05). Dashed line indicates adjusted p-value of 0.05. Full data set shown in Supplemental Excel File 5.
Extended Data Fig. 7.
Extended Data Fig. 7.. exTreg gating strategy and frequency of exTreg among CD4T cells in blood.
A, exTreg gating strategy of exTreg adoptive transfer experiment. Cells from lymph nodes and spleens from pooled p6- or MOG-immunized lineage tracker mice were extracted and enriched for CD4 T cells. exTreg were sorted gating on lymphocyte morphology, single cells and live cells (DAPI−)CD4+TCRb+GFP-RFP+. B, C, Gating strategy of CD4T cell (B) and exTreg among them (C) in restimulation assay. D, Engraftment of exTreg gating strategy. Single, DAPI−CD4+TCRb+GFP-RFP+ were checked. E, Frequency of exTreg among CD4T cells in blood. 5 weeks after adoptive transfer. p6, the recipient mice of exTreg from p6-immunized mice (n=3); PBS, PBS injected mice (n=5). Kruskal-Wallis and Dunns’s multiple comparisons test was performed (p=0.0073, two-sided). **, p<0.01. Bars represent mean values with standard error of mean (SEM).
Extended Data Fig. 8.
Extended Data Fig. 8.. Hashtag oligo (HTO) expressions for cell type identification.
A-E, HTO expressions (HTO1-5) on UMAP from HTO expressions (A, HTO1; B, HTO2; C, HTO3; D, HTO4; E, HTO5). F, Cell calling based on HTO expressions. Doublets were removed.
Figure 1.
Figure 1.. Re-stimulation assay and gating strategy.
A, PBMCs from an HLA-typed DRB1*0701 donor were expanded with a pool of 20 MHC-II restricted APOB-derived peptides, including p18. On Day 14, the response to p18 was monitored in human IFNγ ELISpot assays (p18 Stim). Re-stimulation with the pool (APOB20) and untreated cells (Unstim) served as positive and negative controls, respectively. Representative data from IFNγ ELISpot. B, All PBMCs were gated for dump (CD8, CD14, CD16, CD19, CD56) negative live (live/dead aqua negative). C, CD3+ TCRαβ+. D, CD4+ T cells. E, APC and PE APOB-p18 DRB1*07:01 tetramer positive cells were sorted as Tet+ cells. Treg, Th1 and Tmem cells were sorted from tetramer negative cells (panel D) for CD4+CD45RA− (not naïve, F). Tregs were identified as CD25hi CD127− (G). From the remaining cells, CXCR3+ cells were considered Th1 and CXCR3− cell other memory T cell (Tmem) (H). I, Sorted cells were multiplexed by hashtags, processed and loaded to 10x Genomics Chromium Controller.
Figure 2.
Figure 2.. TCR clonotypes of the combination of TCRα and β sequences and VDJ usage.
A, Pie chart for all the TCR clonotypes from all the cells. B-E, Pie charts for each of the 4 cell types (B, Tet+; C, Treg; D, Th1; E, Tmem), with clonality index. Clonotypes with more than 1 clone exploded in the graph. Top 5 clonotypes with more than 1 clone are as shown. ct, clonotype. Clonotype3326, which was expanded in Tet+ cells, was shared with other cell types, and highlighted in red.
Figure 3.
Figure 3.. TCRβ sequences and VDJ usage.
A, Venn diagram of TCRβ clonotypes (Vβ and Jβ combination) in each cell type. B-F, Heat maps of TCRβ combinations in Th1 cells (B), Tmem (C), Treg cells (D), and Tet+ cells (E). Scale bars show the percentages of specific TCRβ clonotypes in all the clonotypes. F, Cumulative histogram of the frequency of TCRβ which was observed more than once in Tet+ cells.
Figure 4.
Figure 4.. UMAP with Louvain clustering.
A, Treg cells from all 8 donors are highlighted in blue in UMAP, other cell types light grey. B, C, APOB-p18 DRB1*07:01 tetramer positive cells (Tet+ cells, solid circles) are plotted on the combined UMAP of cells from all 8 donors. Treg distribution (B), and Th1 and Tmem distribution (C) are shown as contour plots of density.
Figure 5.
Figure 5.. Comparison of Tet+ transcriptome to other cell types in HIV−.
A, Cumulative histogram of the distances of each Tet+ cells against Tmem (green), Treg (blue) and Th1 (red) in HIV−. B, C, Cumulative histograms of the distances of each of the Tet+ cells from Treg and Tmem cells, separately for sCVD+ (yellow) and sCVD− (purple) and HIV− in the first 6 PCA components. Significance by Kolmogorov-Smirnov test (two-sided). D, A ternary plot of relative median positions of p18-DRB1*07:01 tetramer positive cells relative to pseudobulk mean of Tregs, Th1 and Tmem in the first 6 PCA components in HIV− women. E, F, Volcano plots comparing gene expression in single cells of Tet+ cells compared to Treg, Th1, and Tmem in HIV−sCVD− (E), and HIV−sCVD+ (F). We performed differential expression analysis using Seurat’s non-parametric Wilcoxon rank-sum test to extract marker genes. Significant markers were selected based on Bonferroni-adjusted P-Values <0.05. Colored dots (upregulated genes in red, and downregulated genes in blue) indicate significantly differentially expressed genes (adjusted p-value <0.05). Dashed line indicates adjusted p-value of 0.05. Full data set shown in Supplementary Data 4. The statistical tests were two-sided.
Figure 6.
Figure 6.. Antigen-specific response in mice immunized with ApoB-p6.
A, Schematic of exTreg adoptive transfer experiment. Lineage tracker mice were injected with an emulsion composed of p6 or MOG peptides (2 mg/ml) with an equal volume of CFA (prime). A total of 0.1 ml of the emulsion was given i.m (0.05 ml per quadriceps femoris muscle). 2 weeks later, a boost of p6 or MOG peptide emulsified in IFA was injected i.m.. Lymph nodes and spleens were harvested 2 weeks later. Cells from lymph nodes and spleens from pooled p6- or MOG-immunized lineage tracker mice were enriched for CD4 T cells. 2*105 exTregs were injected retro-orbitally in 100uL of PBS 1X in 8-10 weeks old 6Gy irradiated female Apoe−/− mice that had been on western diet (WD) for 3 weeks and antibiotics for 3 days before and 14 days after adoptive transfer. Control mice were injected with 100uL of PBS as vehicle control. Recipient mice continued on WD for 5 more weeks. B, Splenocytes from p6 and MOG immunized mice were stimulated for 6h and cytokine production was analyzed using intracellular staining and flow cytometry. Representative FACS plot (i) and the corresponding quantification (ii) of %TNF+CD44+ CD4 T cells in MOG or p6 peptide stimulated sets and unstimulated (“no stim”) controls. Pairwise statistical comparisons between unstimulated and individual peptide stimulated sets were performed using paired student’s t-test (p=0.0085 and 0.0005, respectively). (iii) Representative FACS plots (left) and quantification (right) of p6-induced %TNF+CD44+ and (iv) %IFNγ+CD44+ CD4 T cells in stimulated CD4 T cells from p6 and MOG immunized mice (n=5 and 3, respectively). Bars represent mean values with standard error of mean (SEM). Comparison of mean responses between two different sets of immunized mice was done using unpaired student’s t-test with Welch’s correction (p=0.0087 for iii, and p=0.019 for iv). *p<0.05, **p<0.01, ***p<0.001. The statistical tests were two-sided.
Figure 7.
Figure 7.. Analysis of exTregs from ApoB-p6 immunized mice in intracellular staining and adoptive transfer study.
A, Representative histogram plots showing IFNγ (upper left panel) and TNF (bottom left panel) production in CD4+ Tregs (green) and exTregs (red) stimulated with PMA and ionomycin. Blue peaks denote background expression of the cytokines in both cell types in unstimulated control sets. Quantification of median fluorescence intensities (MFI) of cytokine expression in each subset and frequencies of cytokine+ Tregs and exTregs are shown (IFNγ, upper right; TNF, lower right) (n=5). Bars represent mean values with standard error of mean (SEM). Statistical comparisons between mean expressions and frequencies of cytokine responses in the two subsets were performed using unpaired student’s t-test with Welch’s correction (two-sided). p=0.0078 for MFI, and p<0.0001 for frequencies for IFNγ. p=0.027 for MFI, and p=0.004 for frequencies for TNF. *p<0.05, **p<0.01, ****p<0.0001. Bi, ii, Atherosclerotic lesions in the aorta were visualized by Sudan-IV (i) and quantified as area (% of lesion in descending and abdominal aorta) (ii). Biii, Plasma IFNγ concentration (pg/ml) of the recipient mice. p6: exTreg transferred from p6-immunized mice (n=3), MOG: exTregs from MOG-immunized mice (n=4), PBS: vehicle control (n=5). One-tailed Mann-Whitney test was performed (p=0.028). *p<0.05. Bars represent mean values ± SEM.
Figure 8.
Figure 8.. Differentially expressed genes between Tet+ cells and the other cell types sharing the same TCRβ clonotypes as shown in Figure 3A.
Volcano plots comparing gene expression in single cells of Tet+ cells compared to Treg (A), Th1 (B), and Tmem (C), which shared the TCRβ clonotypes (Figure 3A, Tet+ 70 cells vs Treg 174 cells, Tet+ 89 cells vs Th1 1013 cells, and Tet+ 88 cells and Tmem 1098 cells, respectively). Differential expression analysis was performed using Seurat’s non-parametric Wilcoxon rank-sum test to extract marker genes. Significant markers were selected based on Bonferroni-adjusted P-Values <0.05. Colored dots (upregulated genes in red, and downregulated genes in blue) indicate significantly differentiated expressed genes (adjusted p-value <0.05). Dashed line indicates adjusted p-value of 0.05. Full data set shown in Supplementary Data 6.

Similar articles

Cited by

References

    1. Wolf D, Ley K. Immunity and Inflammation in Atherosclerosis. Circ Res. 2019;124:315–327. - PMC - PubMed
    1. Kimura T, Kobiyama K, Winkels H, Tse K, Miller J, Vassallo M, Wolf D, Ryden C, Orecchioni M, Dileepan T, Jenkins MK, James EA, Kwok WW, Hanna DB, Kaplan RC, Strickler HD, Durkin HG, Kassaye SG, Karim R, Tien PC, Landay AL, Gange SJ, Sidney J, Sette A, Ley K. Regulatory CD4+ T Cells Recognize Major Histocompatibility Complex Class II Molecule–Restricted Peptide Epitopes of Apolipoprotein B. Circulation. 2018;138:1130–1143. - PMC - PubMed
    1. Wolf D, Gerhardt T, Winkels H, Michel NA, Pramod AB, Ghosheh Y, Brunel S, Buscher K, Miller J, McArdle S, Baas L, Kobiyama K, Vassallo M, Ehinger E, Dileepan T, Ali A, Schell M, Mikulski Z, Sidler D, Kimura T, Sheng X, Horstmann H, Hansen S, Mitre LS, Stachon P, Hilgendorf I, Gaddis DE, Hedrick C, Benedict CA, Peters B, Zirlik A, Sette A, Ley K. Pathogenic Autoimmunity in Atherosclerosis Evolves From Initially Protective Apolipoprotein B100-Reactive CD4+ T-Regulatory Cells. Circulation. 2020;142:1279–1293. - PMC - PubMed
    1. Saigusa R, Winkels H, Ley K. T cell subsets and functions in atherosclerosis. Nat Rev Cardiol. 2020;17:387–401. - PMC - PubMed
    1. Kobiyama K, Ley K. Atherosclerosis: A Chronic Inflammatory Disease With an Autoimmune Component. Circ Res. 2018;123:1118–1120. - PMC - PubMed