. 2022 Aug 5:13:909979.
doi: 10.3389/fimmu.2022.909979. eCollection 2022.

CRISPR screening identifies T cell-intrinsic regulators of CD3-bispecific antibody responses

Affiliations

CRISPR screening identifies T cell-intrinsic regulators of CD3-bispecific antibody responses

Ryan D Molony et al. Front Immunol. .

Abstract

CD3-engaging bispecific antibodies (BsAbs) enable the formation of an immune synapse between T cells and tumor cells, resulting in robust target cell killing not dependent on a preexisting tumor specific T cell receptor. While recent studies have shed light on tumor cell-specific factors that modulate BsAb sensitivity, the T cell-intrinsic determinants of BsAb efficacy and response durability are poorly understood. To better clarify the genes that shape BsAb-induced T cell responses, we conducted targeted analyses and a large-scale unbiased in vitro CRISPR/Cas9-based screen to identify negative regulators of BsAb-induced T cell proliferation. These analyses revealed that CD8+ T cells are dependent on CD4+ T cell-derived signaling factors in order to achieve sustained killing in vitro. Moreover, the mammalian target of rapamycin (mTOR) pathway and several other candidate genes were identified as intrinsic regulators of BsAb-induced T cell proliferation and/or activation, highlighting promising approaches to enhancing the utility of these potent therapeutics.

Keywords: Bispecific antibodies; CRISPR screening; EP300; T cells; immunotherapy; mTOR.


Conflict of interest statement

Authors RM, TF, GT, EC, DR, MP, JL, HW, and HL are currently employed by the Novartis Institutes for Biomedical Research (NIBR). The following authors were previously employed by NIBR when they were involved with the work described herein: MV (currently employed by Arbor Biotechnologies), GE (currently employed by Foghorn Therapeutics), MM (currently employed by Bristol Myers Squibb), and SK (currently employed by 2seventy Bio).

Figures
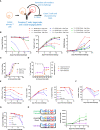
Figure 1
Figure 1
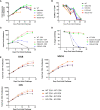
Sustained CD4+ T cell help is necessary for long-term CD3-engaging bispecific antibody-mediated CD8+ T cell proliferation and tumor cell killing in vitro. (A) Schematic overview of the long-term repeat challenge assay system. (B) A long-term repeat challenge assay was established using KMS11 target cells and a BCMAxCD3 or control CD3-engaging BsAb. Challenge was repeated every 3-4 days until killing and/or proliferation activity were absent. The efficiency of BsAb-mediated KMS11 target cell killing by T cells was quantified via flow cytometry to assess the dependence of these activities on BsAb dose and effector to target cell ratio (E:T). The ratio of CD8/CD4 cells was also evaluated over time (High BsAb dose = 3 nM, Low BsAb dose = 0.5 nM). (C) CD4+ and CD8+ T cells were negatively enriched from healthy human donor PBMCs. CD4+, CD8+, or a 1:1 mixture of CD4+ and CD8+ T cells were combined with KMS11 tumor cells containing a luciferase reporter construct (E:T – 1:1) and the indicated dose of a BCMAxCD3 BsAb for 3 days, followed by the analysis of target cell killing. (D) CFSE-labeled T cells and KMS11 target cells were combined for 3 days, after which CD4 and CD8 T cell proliferation and target cell killing were analyzed by flow cytometry. (E) CD4+ and CD8+ T cells were negatively enriched from healthy human donor PBMCs, and were then either maintained separately or combined at defined ratios (4:1, 1:1, 1:4) in a long-term repeat challenge assay with a BCMAxCD3 BsAb and KMS11 target cells. Cell killing was monitored over time. (F) CD62L+ CD8+ T cell frequencies were monitored over time. (G) Supernatant IFNγ levels were measured by ELISA in samples collected at each re-challenge time point. (H) CD4+ and CD8+ T cells were negatively enriched from two healthy donors and used in a Transwell repeat challenge assay as shown, with proliferation of cells in the upper chamber being quantified over time. Data in (B) are representative plots from a single donor. All experiments were repeated a minimum of three times, except for (H) which was repeated two times.
Figure 2
Figure 2
CBLB, CD5, and SOCS1 serve as negative regulators of CD4 and CD8 T cell responses to BsAb-mediated activation. A-B. A CRISPR/Cas9 approach was used to knock out the indicated genes in healthy donor T cells, after which a long term repeat challenge assay was performed as in Figure 1 for the indicated T cell populations. Cellular proliferation and CD62L-positivity were measured over time via flow cytometry. C-D. A CRISPR/Cas9 approach was used to knock out the indicated genes in purified CD8+ T cells, which were then used in a long term repeat challenge assay as above to monitor proliferation and target cell killing over time. All populations other than the gray dashed line in (C) correspond to CD8+ cells without access to CD4+ T cell help. E. The indicated genes were knocked out in both CD4+ and CD8+ T cells, which were then combined together to test cell-intrinsic and cell-extrinsic benefits of the knockout of these three genes to the proliferation of CD8+ T cells, revealing that SOCS1 exclusively provided cell-intrinsic benefits, whereas CBLB and CD5 knockout provided cell-intrinsic and -extrinsic benefits. Experiments were repeated in duplicate using T cells from two donors.
Figure 3
Figure 3
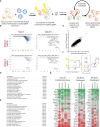
Pooled CRISPR screening enables the identification of genes regulating CD4 and CD8 T cell responses to BsAb-mediated activation. (A) Overview of the assay process. Briefly, T cells from two healthy donors were transduced with a lentiviral library encoding sgRNAs for approximately 1/3rd of the human genome (10 sgRNAs/gene). Two days later, cells were electroporated with Cas9 complexed with a non-coding sgRNA. Cells were then repeatedly challenged with KMS11 target tumor cells every 3-4 days, with DNA being collected from T cells at each repeat challenge timepoint to assess sgRNA enrichment or depletion. (B) Representative plots of hit identification on days 4 and 14 of the challenge process in CD4+ T cells from each of the two screened donors. (C) Relative enrichment of different hits in CD4+ and CD8+ T cell samples, with each point corresponding to a single gene. The green line represents the y = x axis. D-E. Hallmark pathway analyses were used to assess pathway enrichment for the top 100 screen hits identified in (D) CD8+ T cells and (E) CD4+ T cells. (F) Screen validation strategy overview. (G) High-level validation result overview showing that the loss of different genes had differential impacts on long-term proliferation (after four challenges), killing after two challenges, and killing after four challenges. Genes were ranked from 1-24, with 1 indicating more killing or proliferation (as appropriate). Screening data were derived from two donors with two sets of CD4 and CD8 T cell samples per donor. Screening validation in (G) was performed in duplicate using T cells from a single donor.
Figure 4
Figure 4
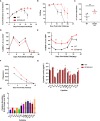
EP300 encodes a negative regulator of BsAb-mediated T cell activation and cytotoxicity. EP300-KO CD4+ T cells and WT CD4+ T cells were used in a long-term repeat challenge assay. (A) T cell proliferation over time was monitored by flow cytometry. (B) KMS11 target cell killing by the indicated T cell populations was monitored over time by flow cytometry. (C) Target cell killing was measured based on luciferase activity during Challenge 2 after 24 h, revealing more complete target cell killing by EP300-KO CD4+ T cells at this time point. (D) The frequency of CD62L+ CD4+ T cells in the indicated groups was monitored over time by flow cytometry. (E) The frequency of CD69+ CD4+ T cells in the indicated groups was monitored over time by flow cytometry. (F) Supernatant IFNγ levels were measured over time by ELISA in the indicated treatment cells. (G) A LegendPlex cytokine assay was used to quantify the levels of the indicated cytokines in supernatants collected from WT or EP300-KO CD4+ T cells at the end of Challenge 1. (H) Cytokine levels in EP300-KO CD4+ T cell samples in (G) were normalized to levels in WT cell samples. All validation data in (A-E) and (G-H) were generated using T cells from four separate donors, and are representative of two experiments. Data in (F) are derived from a single donor and are representative of two experiments. *P<0.05, **P<0.01; Data were analyzed using two-way ANOVAs or Paired Student’s t-test with multiple testing correction as appropriate. Data are presented as the mean with standard error of the mean.
Figure 5
Figure 5
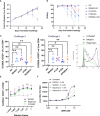
Knockout of mTOR-related genes favors memory-like cell expansion in response to BsAb-mediated challenge. (A) FLCN, RRAGC, PTEN, or RPS6KA1 were knocked out in healthy CD4+ T cells from four healthy human donors and used in a repeat challenge assay system. The proliferation of the indicated T cell populations was monitored over time by flow cytometry. (B) KMS11 target cell killing by the indicated T cell populations was monitored over time by flow cytometry. (C) The frequency of young-like CD62L+ CD27+ CD4+ T cells in the indicated treatment groups was assessed at the end of Challenge 4 and Challenge 5. (D) Levels of p-S6 following treatment with RAD001/Rapamycin at the tested dose range (0.8 nM RAD001, 0.4 nM Rapamycin) in CD4+ T cells following BsAb-mediated activation were measured as a readout for mTORC1 inhibition. (E) A single-round BsAb challenge assay was performed using CD4+ T cells treated with the indicated dose of RAD001 or Rapamycin, with the frequency of young-like CD62L+ CD27+ CD4+ T cells in the indicated treatment groups being assessed by flow cytometry. Statistics are shown for RAD001 vs. Untreated. (F) Cells were treated with the indicated RAD001 and Rapamycin doses, with a single round BsAb challenge assay being performed using the indicated doses of the J6M0 tool BsAb and with CD4+ T cell counts being measured by flow cytometry. All validation data in (A-C) were generated using T cells from four separate donors, and are representative of two experiments. Data in (D-F) are derived from two donors and are representative of at least two experiments. **P<0.01, ***P<0.001; Student’s t-test with FDR correction or one-way ANOVAs with Holm-Sidak multiple comparisons testing, as appropriate. Data are presented as the mean with standard error of the mean. NS, non-significant.

References

    1. Labrijn AF, Janmaat ML, Reichert JM, Parren PW. Bispecific antibodies: a mechanistic review of the pipeline. Nat Rev Drug Discov (2019) 18(8):585–608. doi: 10.1038/s41573-019-0028-1 - DOI - PubMed
    1. Krishnamurthy A, Jimeno A. Bispecific antibodies for cancer therapy: A review. Pharmacol Ther (2018) 185:122–34. doi: 10.1016/j.pharmthera.2017.12.002 - DOI - PubMed
    1. Weiner GJ, Kostelny SA, Hillstrom JR, Cole MS, Link BK, Wang SL, et al. . The role of T cell activation in anti-CD3 x antitumor bispecific antibody therapy. J Immunol (1994) 152(5):2385–92. - PubMed
    1. Staerz UD, Kanagawa O, Bevan MJ. Hybrid antibodies can target sites for attack by T cells. Nature (1985) 314(6012):628–31. doi: 10.1038/314628a0 - DOI - PubMed
    1. Topp MS, Gökbuget N, Zugmaier G, Klappers P, Stelljes M, Neumann S, et al. . Phase II trial of the anti-CD19 bispecific T cell–engager blinatumomab shows hematologic and molecular remissions in patients with relapsed or refractory b-precursor acute lymphoblastic leukemia. J Clin Oncol (2014) 32(36):4134–40. doi: 10.1200/JCO.2014.56.3247 - DOI - PubMed

Publication types

Substances