. 2022 Aug 15:10:e13867.
doi: 10.7717/peerj.13867. eCollection 2022.

The role of autophagy in high-fat diet-induced insulin resistance of adipose tissues in mice

Affiliations

The role of autophagy in high-fat diet-induced insulin resistance of adipose tissues in mice

Yovita Permata Budi et al. PeerJ. .

Abstract

Aims: Studies have observed changes in autophagic flux in the adipose tissue of type 2 diabetes patients with obesity. However, the role of autophagy in obesity-induced insulin resistance is unclear. We propose to confirm the effect of a high-fat diet (HFD) on autophagy and insulin signaling transduction from adipose tissue to clarify whether altered autophagy-mediated HFD induces insulin resistance, and to elucidate the possible mechanisms in autophagy-regulated adipose insulin sensitivity.

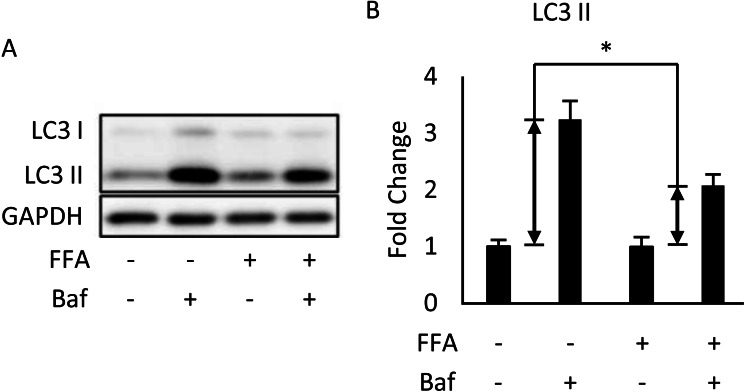
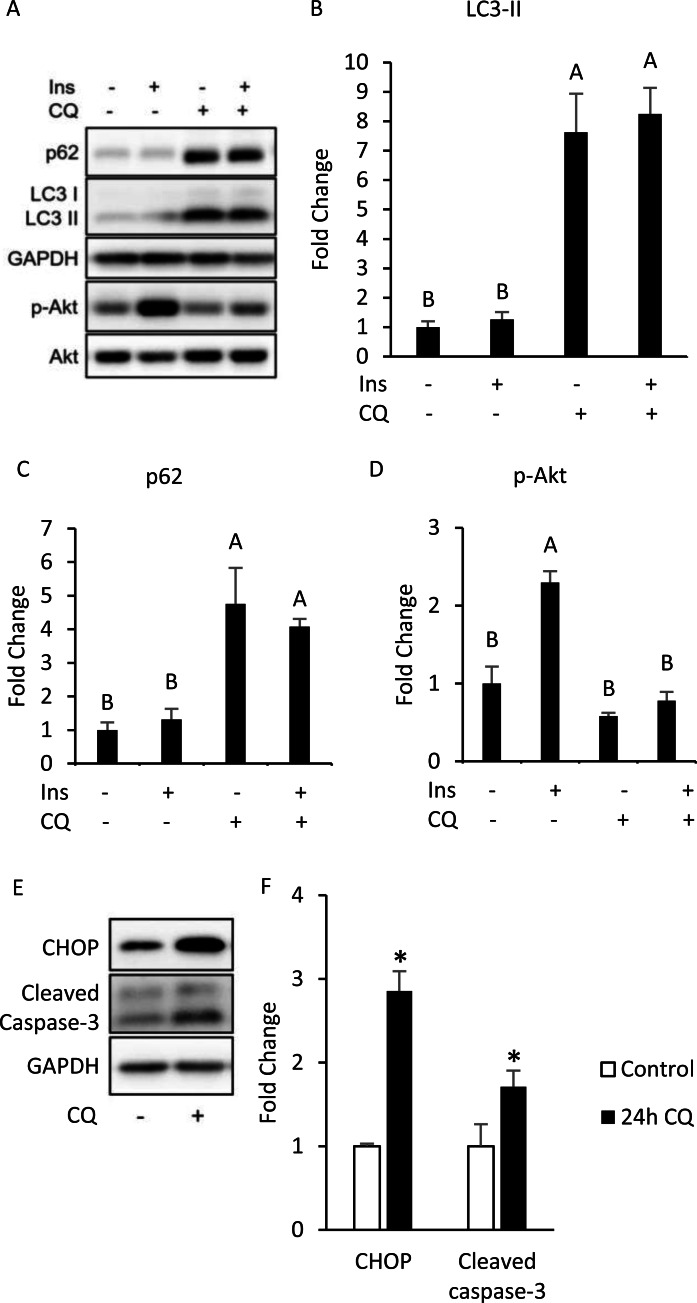
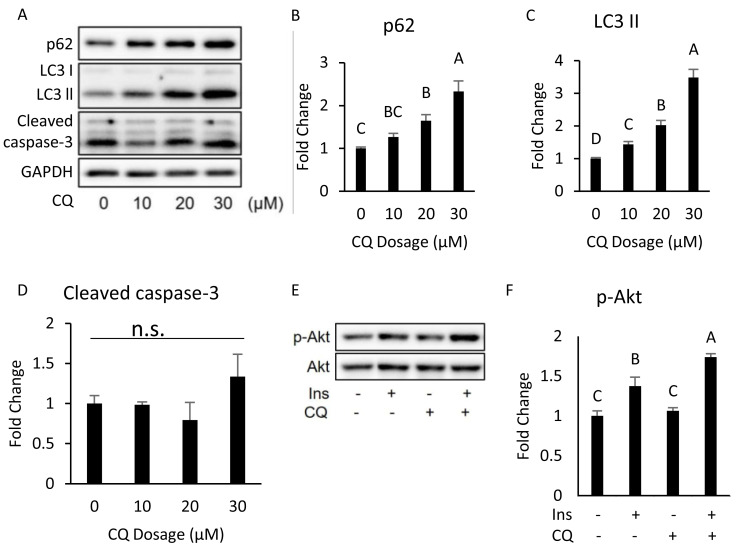
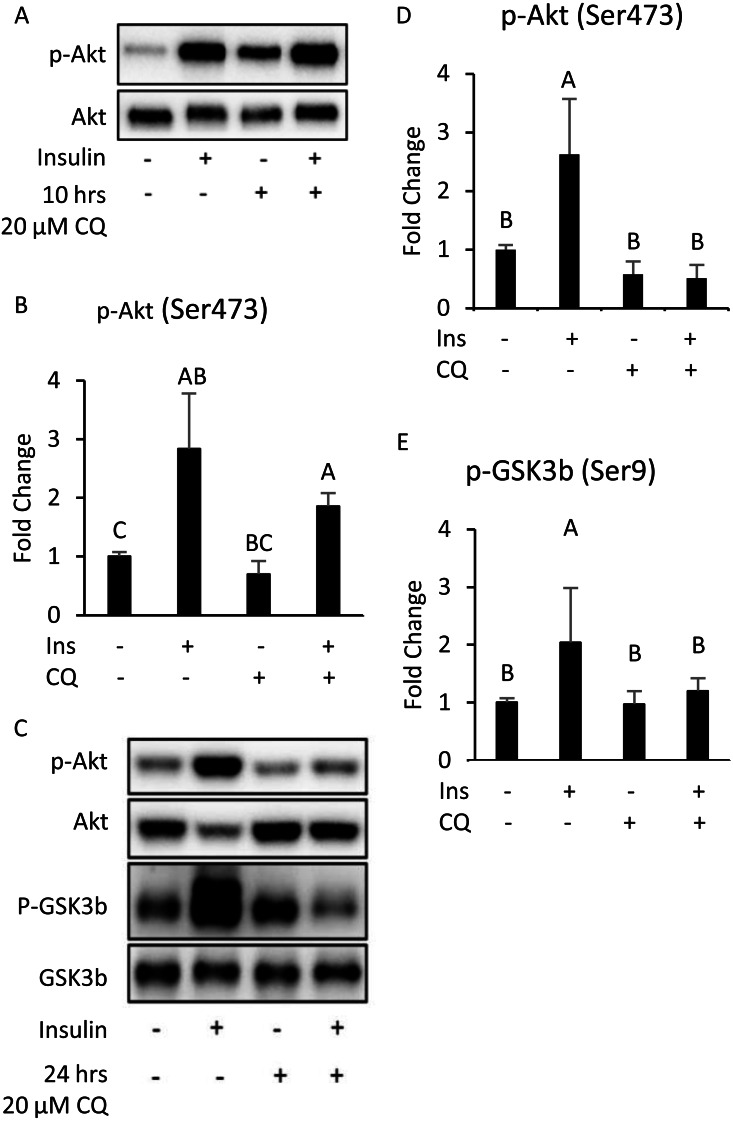
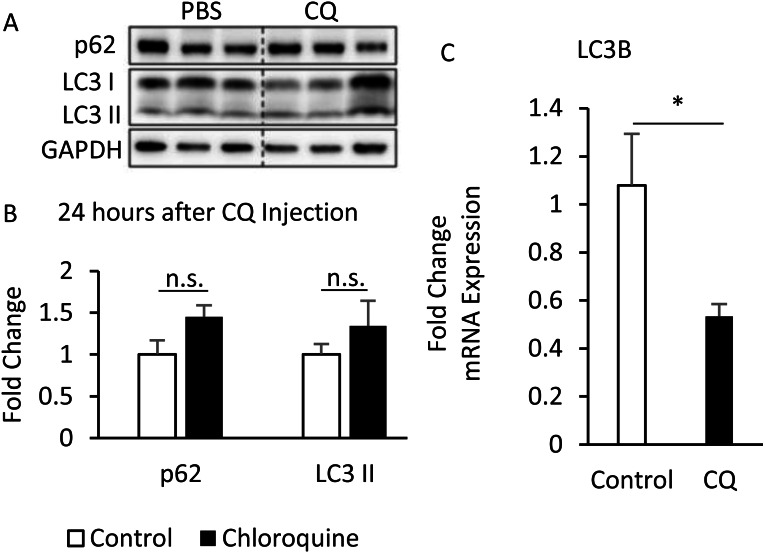
Methods: Eight-week-old male C57BL/6 mice were fed with HFD to confirm the effect of HFD on autophagy and insulin signaling transduction from adipose tissue. Differentiated 3T3-L1 adipocytes were treated with 1.2 mM fatty acids (FAs) and 50 nM Bafilomycin A1 to determine the autophagic flux. 2.5 mg/kg body weight dose of Chloroquine (CQ) in PBS was locally injected into mouse epididymal adipose (10 and 24 h) and 40 µM of CQ to 3T3-L1 adipocytes for 24 h to evaluate the role of autophagy in insulin signaling transduction.

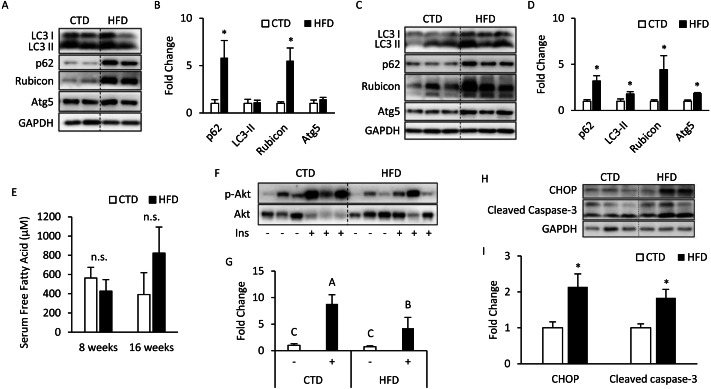
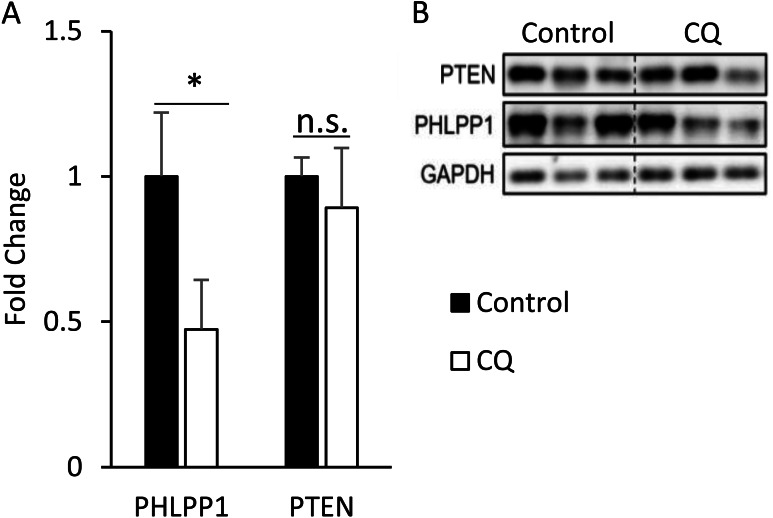
Results: The HFD treatment resulted in a significant increase in SQSTM1/p62, Rubicon expression, and C/EBP homologous protein (CHOP) expression, yet the insulin capability to induce Akt (Ser473) and GSK3β (Ser9) phosphorylation were reduced. PHLPP1 and PTEN remain unchanged after CQ injection. In differentiated 3T3-L1 adipocytes treated with CQ, although the amount of phospho-Akt stimulated by insulin in the CQ-treated group was significantly lower, CHOP expressions and cleaved caspase-3 were increased and bafilomycin A1 induced less accumulation of LC3-II protein.

Conclusion: Long-term high-fat diet promotes insulin resistance, late-stage autophagy inhibition, ER stress, and apoptosis in adipose tissue. Autophagy suppression may not affect insulin signaling transduction via phosphatase expression but indirectly causes insulin resistance through ER stress or apoptosis.

Keywords: Apoptosis; Autophagy; ER stress; High-fat diet; Insulin resistance; Obesity.


Conflict of interest statement

The authors declare there are no competing interests.

Figures

Figure 1
Figure 1. Altered autophagy, insulin resistance, and ER stress in adipose tissues from mice fed with 8- and 16-week HFD.
The 12-week-old male B6 mice were fed with either the control diet or HFD for 8 weeks (A, B) and 16 weeks (C, D). T t he figure shows the immunoblots and the densitometric qua n tifications of SQSTM1/p62, LC3, Rubicon, and Atg5 expression by Western blotting. Values are mean ± SEM (n = 4). The serum-free fatty acid levels between CTD-fed and HFD-fed mice were analyzed using a commercial assay kit (E). Values are mean ± SEM (8 weeks: n = 4 and 16 weeks: n = 6). n.s.: no significant difference. The phospho-Akt (Ser473) levels of adipose tissues from mice injected with or without insulin (0.5 IU/kg body weight I.P., 30 min) were analyzed at the 16th week using Western blotting (F, G). Values are mean ± SEM (n = 6). Different letters are considered statistically significant difference by one-way ANOVA and least significant difference (LSD) test, P < 0.05. Male B6 mice were fed with either the control diet or HFD for 16 weeks (H, I). The figure shows the immunoblots and the densitometric quantifications of C/EBP homologous protein (CHOP) and cleaved caspase-3 expression by Western blotting. Values are mean ± SEM (n = 6). An asterisk (*) indicates statistical significance, P < 0.05.
Figure 2
Figure 2. Free fatty acids (FFAs) impaired the autophagic flux in differentiated 3T3-L1 adipocytes.
The Bafilomycin A1-induced LC3 II protein accumulation in 48-hour BSA- and FFA- (0.6 mM PA + 0.6 mM OA) loaded 3T3-L1 adipocytes were analyzed using Western blotting. The immunoblots (A), and calculated fold change of LC3 II protein levels were presented (B). For densitometric analyses, GAPDH was used as the loading control. Values are mean ± SEM (n = 3). An asterisk (*) indicates statistical significance, P < 0.05.
Figure 3
Figure 3. Autophagy inhibition, insulin resistance, ER stress and apoptosis were found in 3T3-L1 after CQ treatment for 24 h.
The differentiated 3T3-L1 adipocyte was treated with 40 µM CQ for 24 h, and with 40 nM insulin for 15 min before sampling. SQSTM1/p62, LC3 and p-Akt/Akt immunoblots (A) and densitometric quantifications (B, C, D). The differentiated 3T3-L1 adipocyte was treated with 40 µM CQ for 24 h. CHOP and cleaved caspase-3 immunoblot (E) and densitometric quantifications (F). For densitometric analyses of Western blotting data, GAPDH was used as the loading control. Values are mean ± SEM (n = 3). Different letters are considered statistically significant difference by one-way ANOVA and least significant difference (LSD) test, P < 0.05.
Figure 4
Figure 4. Dose–response experiment of CQ treatment in 3T3-L1 cells and insulin resistance, ER stress, and apoptosis were observed in 3T3-L1 after 20 µM CQ treatment for 48 h.
The differentiated 3T3-L1 adipocyte was treated with 10, 20, and 30 µM CQ, for 24 h (A). The figure shows SQSTM1/p62 (B), LC3 (C), and cleaved caspase-3 (D) immunoblots and densitometric quantifications. The differentiated 3T3-L1 adipocyte was treated with 20 µM CQ for 24 h and with 40 nM insulin for 15 min before sampling. The phospho-Akt (Ser473) and total Akt levels of 3T3-L1 adipocyte were analyzed using Western blotting (E, F). GAPDH was used as the loading control. Values are mean ± SEM (n = 3). Different letters are considered statistically significant difference by one-way ANOVA and least significant difference (LSD) test, P < 0.05. n.s.: no significant difference.
Figure 5
Figure 5. The insulin signaling pathway after chloroquine (CQ) treatment for 10 h and 24 h.
B6 mice were injected with PBS or CQ into epididymal adipose tissue for 10 h (A, B) and 24 h (C, D, E) mice injected with or without I.P. insulin (0.5 IU/kg body weight, 30 min) before sacrifice. The phospho-Akt (Ser473) and total Akt levels of adipose tissues were analyzed with Western blotting. Blotting and quantitative data of p-Akt/Akt and p-GSK3 β/ GSK3 β were presented. Values are mean ± SEM (n = 4) (A) (n = 6) (C). Different letters are considered statistically significant difference by one-way ANOVA and least significant difference (LSD) test, P < 0.05. GAPDH was used as the loading control. The LC3B mRNA level in 24-hour PBS- and CQ-treated adipose was measured using qPCR analysis. For data quantification, the housekeeping gene ACTB was used as the internal control. Values are mean ± SEM (n = 6). An asterisk (*) indicates statistical significance, P < 0.05. n.s.: no significant difference.
Figure 6
Figure 6. The suppression of late-stage autophagy may have feedback effect which resulted in reduced mRNA level of LC3B.
B6 mice were injected with PBS or CQ into epididymal adipose tissue for 24 h. Representative SQSTM1/p62 and LC3 immunoblots and densitometric quantifications (A, B). For densitometric analyses of Western blotting data, GAPDH was used as loading control. The LC3B mRNA level in 24-hour PBS- and CQ-treated adipose was measured using qPCR analysis (C). For data quantification, the housekeeping gene ACTB was used as the internal control. Values are mean ± SEM (n = 6). An asterisk (*) indicates statistical significance, P < 0.05. n.s.: no significant difference.
Figure 7
Figure 7. Autophagy may regulate insulin-stimulated signal transduction without associated with PHLPP1 and PTEN.
The PHLPP1 and PTEN level of PBS- and CQ-injected mouse adipose via Western blotting. An asterisk (*) indicates statistical significance, P < 0.05. Quantitative data (A) and Western blotting (B) of PTEN were presented. For densitometric analyses of Western blotting data, GAPDH was used as the loading control. Values are mean ± SEM (n = 3). n.s.: no significant difference.

References

    1. Alkhouri N, Gornicka A, Berk MP, Thapaliya S, Dixon LJ, Kashyap S, Schauer PR, Feldstein AE. Adipocyte apoptosis, a link between obesity, insulin resistance, and hepatic steatosis. Journal of Biological Chemistry. 2010;285(5):3428–3438. doi: 10.1074/jbc.M109.074252. - DOI - PMC - PubMed
    1. Andreozzi F, Procopio C, Greco A, Mannino GC, Miele C, Raciti GA, Iadicicco C, Beguinot F, Pontiroli AE, Hribal ML, Folli F, Sesti G. Increased levels of the Akt-specific phosphatase PH domain leucine-rich repeat protein phosphatase (PHLPP)-1 in obese participants are associated with insulin resistance. Diabetologia. 2011;54(7):1879–1887. doi: 10.1007/s00125-011-2116-6. - DOI - PubMed
    1. Cai J, Pires KM, Ferhat M, Chaurasia B, Buffolo MA, Smailling R, Sargsyan A, Atkinson DL, Summers SA, Graham TE, Boudina S. Autophagy ablation in adipocytes induces insulin resistance and reveals roles for lipid peroxide and Nrf2 signaling in adipose-liver crosstalk. Cell Reports. 2018;25(7):1708–1717.e5. doi: 10.1016/j.celrep.2018.10.040. - DOI - PMC - PubMed
    1. Copps KD, White MF. Regulation of insulin sensitivity by serine/threonine phosphorylation of insulin receptor substrate proteins IRS1 and IRS2. Diabetologia. 2012;55(10):2565–2582. doi: 10.1007/s00125-012-2644-8. - DOI - PMC - PubMed
    1. Crowley LC, Waterhouse NJ. Detecting cleaved caspase-3 in apoptotic cells by flow cytometry. Cold Spring Harbor Protocols. 2016;2016:11. doi: 10.1101/pdb.prot087312. - DOI - PubMed

Publication types