. 2022 Mar;1(3):253-262.
doi: 10.1038/s44161-022-00023-x. Epub 2022 Mar 7.

The pleiotropic benefits of statins include the ability to reduce CD47 and amplify the effect of pro-efferocytic therapies in atherosclerosis

Affiliations

The pleiotropic benefits of statins include the ability to reduce CD47 and amplify the effect of pro-efferocytic therapies in atherosclerosis

Kai-Uwe Jarr et al. Nat Cardiovasc Res. 2022 Mar.

Abstract

The pleiotropic benefits of statins may result from their impact on vascular inflammation. The molecular process underlying this phenomenon is not fully elucidated. Here, RNA sequencing designed to investigate gene expression patterns following CD47-SIRPα inhibition identifies a link between statins, efferocytosis, and vascular inflammation. In vivo and in vitro studies provide evidence that statins augment programmed cell removal by inhibiting the nuclear translocation of NFκB1 p50 and suppressing the expression of the critical 'don't eat me' molecule, CD47. Statins amplify the phagocytic capacity of macrophages, and thus the anti-atherosclerotic effects of CD47-SIRPα blockade, in an additive manner. Analyses of clinical biobank specimens suggest a similar link between statins and CD47 expression in humans, highlighting the potential translational implications. Taken together, our findings identify efferocytosis and CD47 as pivotal mediators of statin pleiotropy. In turn, statins amplify the anti-atherosclerotic effects of pro-phagocytic therapies independently of any lipid-lowering effect.

Keywords: Atherosclerosis; CD47; Efferocytosis; Pleiotropy; Statin.


Conflict of interest statement

Competing Interests I.L.W. and N.J.L. are co-founders and directors of Bitterroot Bio Incorporated, a cardiovascular company studying macrophage checkpoint inhibition. K.-U.J., Y.K., I.L.W., and N.J.L. have filed a provisional patent (U.S. Application Serial No. 63/106,794): ‘CD47 Blockade and Combination Therapies Thereof For Reduction Of Vascular Inflammation’. The remaining authors declare no competing interests.

Figures

Extended Data Fig. 1:
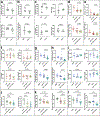
Extended Data Fig. 1:. RNA sequencing revealed HMG-CoA reductase inhibitor as one of the top upstream regulators of SHP-1 inhibition in macrophages.
a, Flow cytometry gating strategy for cell sorting to isolate Cy5.5-positive bone marrow-derived macrophages in each group (SHP1i versus SWNT), which were then subjected to RNA sequencing. b, Rbl1, Xiap, Apoe, Rhob, and Gpx3 expression by quantitative polymerase chain reaction in bone marrow-derived macrophages upon atorvastatin treatment (n = 6 biologically independent samples per group). c, Functional pathways enriched among all differential expressed genes (false-discovery rate < 0.10) as determined by pathway analysis (p-value of overlap). d – e, Samples from vascular smooth muscle cells, bone marrow-derived macrophages, and RAW 264.7 macrophages were collected to rule out mycoplasma contamination by polymerase chain reaction and/or biochemical detection (n = 3 biologically independent samples per group). Each data point represents a biologically independent sample. Data and error bars present mean +/− 95 % confidence interval for parametric results. Data of (b) were analysed by unpaired Student’s t-test (two-tailed). Data of (c) were analysed by Fisher’s Exact Test, IPA.
Extended Data Fig. 2:
Extended Data Fig. 2:. Combined treatment of CD47-SIRPα blockade and atorvastatin showed additive effects on atherosclerotic plaque activity in vivo.
a, Quantification of atherosclerotic lesion area (n = 9 for PBS; n = 10 for Statin). TVA, total vessel area. b, Quantification of necrotic core size (n = 9 for PBS; n = 10 for Statin). c, Quantification of total cholesterol, HDL, LDL, and glucose in the blood (n = 9 for PBS; n = 7 for Statin). d, Quantification of atherosclerotic lesion area (n = 13 for IgG; n = 13 for anti-CD47; n = 13 for anti-CD47+Statin). e, Quantification of necrotic core size (n = 13 for IgG; n = 13 for anti-CD47; n = 13 for anti-CD47+Statin). f, Quantification of total cholesterol, HDL, LDL, and glucose in the blood (n = 10 for IgG; n = 11 for anti-CD47; n = 10 for anti-CD47+Statin). g, Quantification of atherosclerotic lesion area (n = 12 for SWNT; n = 11 for SHP1i; n = 15 for SHP1i+Statin). h, Quantification of necrotic core size (n = 12 for SWNT; n = 11 for SHP1i; n = 15 for SHP1i+Statin). i, Quantification of total cholesterol, HDL, LDL, and glucose in the blood (n = 11 for SWNT; n = 10 for SHP1i; n = 12 for SHP1i+Statin). j – l, Quantification of atherosclerotic lesion area and necrotic core size (n = 10 for Statin; n = 13 for anti-CD47; n = 13 for anti-CD47+Statin; n = 11 for SHP1i; n = 15 for SHP1i+Statin). Each data point represents a biologically independent animal. Data and error bars present mean +/− 95 % confidence interval for parametric and median +/− interquartile range for non-parametric results. Data of (a) were analysed by unpaired Student’s t-test (two-tailed). Data of (b - c) were analysed by Mann-Whitney U test (two-tailed). Data of (d), (g), and (j - l) were analysed by one-way analysis of variance with Sidak’s multiple comparisons test. Data of (e - f) and (h - l) were analysed by Kruskal-Wallis with Dunn’s multiple comparisons test.
Extended Data Fig. 3:
Extended Data Fig. 3:. Combined treatment of CD47-SIRPα blockade and atorvastatin showed additive effects on efferocytosis rate in vitro and in vivo.
a, Flow cytometry plots depicting the staining controls for the conditions. b, Apoptosis assay to quantify the rate of programmed cell death in vitro in the presence or absence of atorvastatin, SHP1i, and dual treatment after staurosporine (STS) stimulation (n = 5 biologically independent samples per group). c, Immunofluorescence images depicting cleaved caspase-3 activity (n = 9 for PBS; n = 10 for Statin; n = 11 for SHP1i; n = 15 for SHP1i+Statin). White line depicts intima. Scale bar, 50 μm; scale bar inset, 10 μm. d, Immunofluorescence images depicting the ratio of free to macrophage associated cleaved caspase-3 activity (n = 9 for PBS; n = 10 for Statin; n = 11 for SHP1i; n = 15 for SHP1i+Statin). White line depicts intima. *, free cleaved caspase-3. #, macrophage-associated cleaved caspase-3. Scale bar, 50 μm; scale bar inset, 10 μm. Each data point represents a biologically independent sample. Data and error bars present mean +/− 95 % confidence interval for parametric results. Data of (b) were analysed by one-way analysis of variance test.
Extended Data Fig. 4:
Extended Data Fig. 4:. Atorvastatin inhibited NFκB1 p50 nuclear translocation under atherogenic conditions and thus directly regulated gene expression of Cd47.
a, Cd47 expression by quantitative polymerase chain reaction in bone marrow-derived macrophages (n = 6 biologically independent samples per group). TNF-α, tumor necrosis factor-α. b, Cd47 expression by flow cytometry in bone marrow-derived macrophages (n = 4 biologically independent samples per group). RFI, ratio of median fluorescence intensity. c, Cd47 expression by immunofluorescence in smooth muscle cells (n = 10 cells for vehicle and n = 15 cells for TNF-α or TNF-α+Statin examined over 3 biologically independent samples per group). SMC, smooth muscle cells. Scale bar, 10 μm. d, NFκB1 p50 nuclear translocation by immunofluorescence in smooth muscle cells (n = 3 biologically independent samples per group). NFκB1, nuclear factor of kappa light polypeptide gene enhancer in B cells 1. M, mevalonate. Scale bar and scale bar inset, 10 μm. Each data point of represents a biologically independent sample. Data and error bars present mean +/− 95 % confidence interval for parametric and median +/− interquartile range for non-parametric results. Data of (a) were analysed by one-way analysis of variance test. Data of (b) were analysed by Kruskal-Wallis test.
Figure 1:
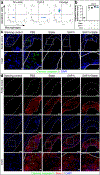
Figure 1:. RNA sequencing revealed HMG-CoA reductase inhibitor as one of the top upstream regulators of SHP-1 inhibition in macrophages.
a, Volcano plot of genes that regulate the response to SHP1i in bone marrow-derived macrophages (n = 3 biologically independent samples per group). Significant hits were defined by a false-discovery rate < 0.10 and marked in blue (downregulated) or red (upregulated). FC, fold change; Rbl1, RB transcriptional corepressor like 1; Xiap, X-linked inhibitor of apoptosis; Apoe, apolipoprotein E; Rhob, ras homolog family member B; Gpx3, glutathione peroxidase 3. b – c, Lovastatin, a first generation HMG-CoA reductase inhibitor, was one of the top activated upstream regulators and the only drug in the database, based on the relevant regulation of Apoe, Rhob, Rbl1, Gpx3, and Xiap. Filter criteria: top four upstream regulators with significant Z-score (≥ 2 for predicted activation and ≤ −2 for predicted inhibition). Sorting criteria: P value of overlap analysed by Fisher’s Exact Test, IPA. All false-discovery rate values are provided in Extended Data Table 1. All significant upstream regulators (Z-score ≥ 2 for predicted activation and ≤ −2 for predicted inhibition) are provided in Extended Data Table 2.
Figure 2:
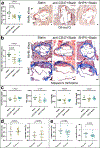
Figure 2:. Combined treatment of CD47-SIRPα blockade and atorvastatin showed additive effects on atherosclerotic plaque activity in vivo.
a, Quantification of atherosclerotic lesion area and cross-sections of aortic roots stained with Oil-red O (n = 10 for Statin; n = 13 for anti-CD47+Statin; n = 15 for SHP1i+Statin). TVA, total vessel area; Scale bar, 100 μm. b, Quantification of necrotic core size and cross-sections of aortic roots stained with Masson’s trichrome (n = 10 for Statin; n = 13 for anti-CD47+Statin; n = 15 for SHP1i+Statin). Scale bar and scale bar inset, 100 μm. c, Quantification of total cholesterol, high-density lipoprotein (HDL), low-density lipoprotein (LDL), and glucose in the blood (n = 7 for Statin; n = 10 for anti-CD47+Statin; n = 12 for SHP1i+Statin). d – e, Applying the Bliss independence model on the analyses of lesion area and necrotic core size to determine additivity/synergy of compounds (n = 10 for Ecalculated; n = 13 for anti-CD47+Statin Eobserved; n = 15 for SHP1i+Statin Eobserved). Δ, change in. Each data point represents a biologically independent animal. Data and error bars present mean +/− 95 % confidence interval for parametric and median +/− interquartile range for non-parametric results. Data of (a) were analysed by one-way analysis of variance with Sidak’s multiple comparisons test. Data of (b – c) were analysed by Kruskal-Wallis with Dunn’s multiple comparisons test. Data of (d – e) were analysed by unpaired Student’s t-test (two-tailed) and Mann–Whitney U test (two-tailed).
Figure 3:
Figure 3:. Combined treatment of CD47-SIRPα blockade and atorvastatin showed additive effects on efferocytosis rate in vitro and in vivo.
a, Quantification of efferocytosis rate and flow cytometry plots depicting the efferocytosis rate in vitro in the presence or absence of atorvastatin, SHP1i, and dual treatment (n = 6 biologically independent samples per group). The right upper quadrant (highlighted in red) includes double-positive cells that are taken to represent a macrophage that has ingested an apoptotic target cell. b, Applying the Bliss independence model on the analyses of efferocytosis rate in vitro to determine additivity/synergy of compounds (n = 6 biologically independent samples per group). c, Apoptosis assay to quantify the rate of programmed cell death in vitro in the presence or absence of atorvastatin, SHP1i, and dual treatment (n = 5 biologically independent samples per group). STS, staurosporine. d, Quantification of cleaved caspase-3 activity and immunofluorescence images (n = 9 for PBS; n = 10 for Statin; n = 11 for SHP1i; n = 15 for SHP1i+Statin). White line depicts intima. Scale bar, 10 μm. e, Quantification of efferocytosis rate in vivo and immunofluorescence images depicting the ratio of free to macrophage associated cleaved caspase-3 activity (n = 9 for PBS; n = 10 for Statin; n = 11 for SHP1i; n = 15 for SHP1i+Statin). White line depicts intima. *, free cleaved caspase-3. #, macrophage-associated cleaved caspase-3. Scale bar, 10 μm. f, Applying the Bliss independence model on the analyses of efferocytosis rate in vivo to determine additivity/synergy of compounds (n = 10 Ecalculated; n = 15 Eobserved). Δ, change in. Each data point represents a biologically independent sample or animal. Data and error bars present mean +/− 95 % confidence interval for parametric and median +/− interquartile range for non-parametric results. Data of (a) were analysed by Kruskal-Wallis with Dunn’s multiple comparisons test. Data of (b) were analysed by Mann–Whitney U test (two-tailed). Data of (c – e) were analysed by one-way analysis of variance with Tukey’s multiple comparisons test. Data of (f) were analysed by unpaired Student’s t-test (two-tailed).
Figure 4:
Figure 4:. Atorvastatin inhibited NFκB1 p50 nuclear translocation under atherogenic conditions and thus directly regulated gene expression of Cd47.
a, Cd47 expression by quantitative polymerase chain reaction in smooth muscle cells (n = 12 biologically independent samples per group). TNF-α, tumor necrosis factor-α. b – c, Cd47 expression by flow cytometry in smooth muscle cells (n = 6 biologically independent samples per group). RFI, ratio of median fluorescence intensity. d, Cd47 expression by immunofluorescence in smooth muscle cells (n = 10 cells for vehicle and n = 15 cells for TNF-α or TNF-α+Statin examined over 3 biologically independent samples per group). AU, arbitrary unit. SMC, smooth muscle cells. Scale bar, 10 μm. e, Cd47 promoter activity by luciferase assay in smooth muscle cells (n = 18 biologically independent samples per group). f, NFκB1 p50 nuclear translocation by immunofluorescence in smooth muscle cells (n = 3 biologically independent samples per group). NFκB1, nuclear factor of kappa light polypeptide gene enhancer in B cells 1. M, mevalonate. Scale bar, 10 μm. g, NFκB1 p50 nuclear translocation by Western blot in smooth muscle cells (n = 11 biologically independent samples per group). HDAC1, histone deacetylase 1. Lane 1, Vehicle. Lane 2, TNF-α. Lane 3, TNF-α+Statin. Lane 4, TNF-α+Statin+Mevalonate. h, CD47 expression by quantitative polymerase chain reaction in carotid endarterectomy samples (n = 7 biologically independent samples per group). Each data point represents a biologically independent sample, except for (d), which shows cells examined (mean value per high power field) over 3 biologically independent samples. Data and error bars present mean +/− 95 % confidence interval for parametric and median +/− interquartile range for non-parametric results. Data of (a) and (d) were analysed by one-way analysis of variance with Tukey’s multiple comparisons test. Data of (b) were analysed by Kruskal-Wallis with Dunn’s multiple comparisons test. Data of (e) were analysed by paired Student’s t-test (two-tailed). Data of (g) were analysed by repeated measures analysis of variance with Tukey’s multiple comparisons test. Data of (h) were analysed by unpaired Student’s t-test (two-tailed).
Figure 5:
Figure 5:. The pleiotropic benefits of statins include the activation of efferocytosis in atherosclerosis.
In advanced atherosclerotic lesions, atorvastatin augments efferocytosis by inhibiting the nuclear translocation of NFκB1 p50 and suppressing expression of the key ‘don’t eat me’ molecule CD47 in vascular smooth muscle cells. Combination of HMG-CoA reductase inhibition and CD47-SIRPα blockade amplifies the phagocytic capacity of macrophages and thus prevents lesion progression in an additive manner. SHP-1, Src homology 2 domain-containing phosphatase-1. SIRPα, signal-regulatory protein alpha.

References

    1. Virani SS et al. Heart Disease and Stroke Statistics-2021 Update: A Report From the American Heart Association. Circulation 143, e254–e743, doi:10.1161/CIR.0000000000000950 (2021). - DOI - PubMed
    1. Brugts JJ et al. The benefits of statins in people without established cardiovascular disease but with cardiovascular risk factors: meta-analysis of randomised controlled trials. BMJ 338, b2376, doi:10.1136/bmj.b2376 (2009). - DOI - PMC - PubMed
    1. Cholesterol Treatment Trialists C et al. Efficacy and safety of more intensive lowering of LDL cholesterol: a meta-analysis of data from 170,000 participants in 26 randomised trials. Lancet 376, 1670–1681, doi:10.1016/S0140-6736(10)61350-5 (2010). - DOI - PMC - PubMed
    1. Oesterle A, Laufs U & Liao JK Pleiotropic Effects of Statins on the Cardiovascular System. Circ Res 120, 229–243, doi:10.1161/CIRCRESAHA.116.308537 (2017). - DOI - PMC - PubMed
    1. Yu D & Liao JK Emerging views of statin pleiotropy and cholesterol lowering. Cardiovasc Res, doi:10.1093/cvr/cvab032 (2021). - DOI - PMC - PubMed