

Left atrial acceleration factor as a magnetic resonance 4D flow measure of mean pulmonary artery wedge pressure in pulmonary hypertension
- PMID: 35990987
- PMCID: PMC9381926
- DOI: 10.3389/fcvm.2022.972142
Left atrial acceleration factor as a magnetic resonance 4D flow measure of mean pulmonary artery wedge pressure in pulmonary hypertension
Abstract
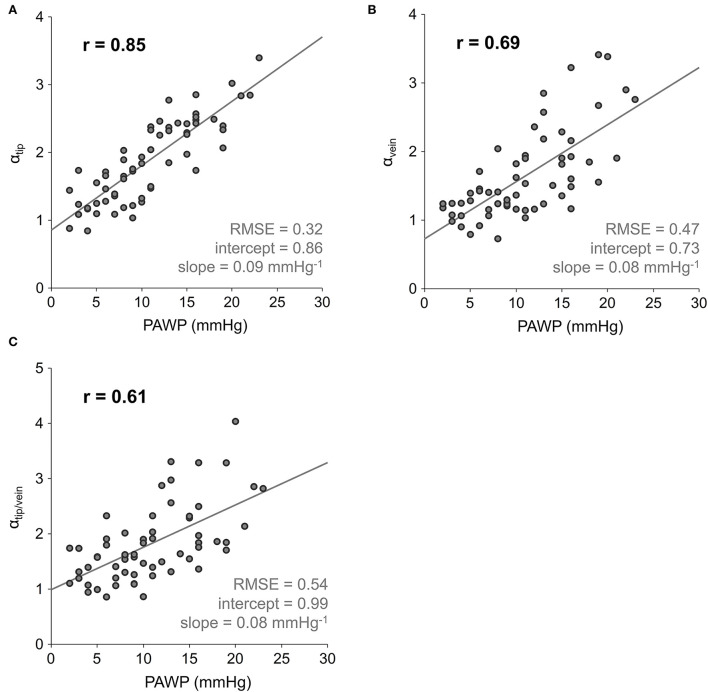
Background: Mean pulmonary artery wedge pressure (PAWP) represents a right heart catheter (RHC) surrogate measure for mean left atrial (LA) pressure and is crucial for the clinical classification of pulmonary hypertension (PH). Hypothesizing that PAWP is related to acceleration of blood throughout the LA, we investigated whether an adequately introduced LA acceleration factor derived from magnetic resonance (MR) four-dimensional (4D) flow imaging could provide an estimate of PAWP in patients with known or suspected PH.
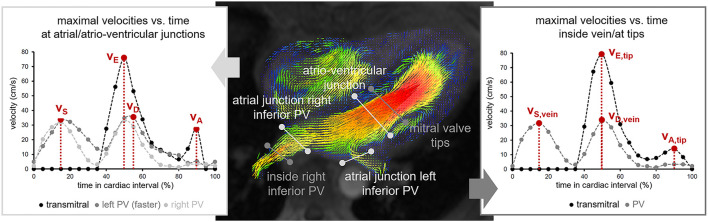
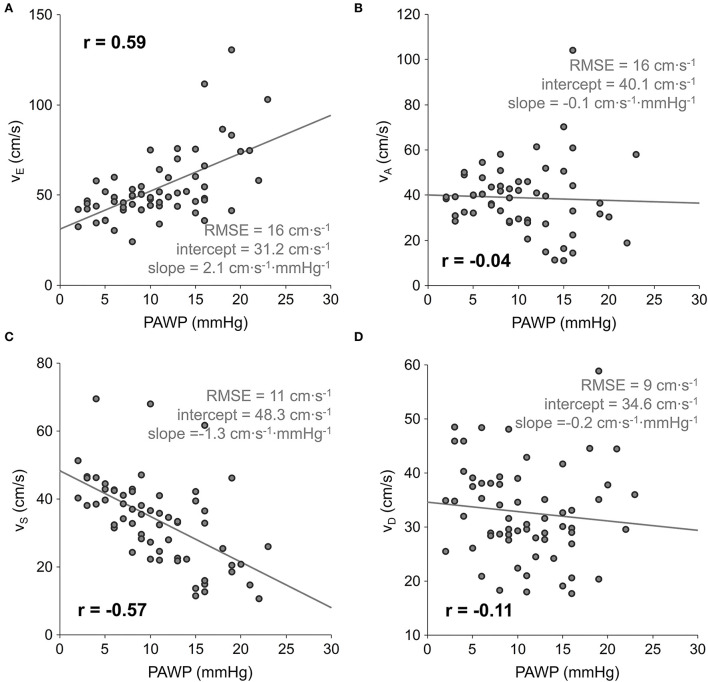
Methods: LA 4D flow data of 62 patients with known or suspected PH who underwent RHC and near-term 1.5 T cardiac MR (ClinicalTrials.gov identifier: NCT00575692) were retrospectively analyzed. Early diastolic LA peak outflow velocity (v E) as well as systolic (v S) and early diastolic (v D) LA peak inflow velocities were determined with prototype software to calculate the LA acceleration factor (α) defined as α = v E/[(v S + v D)/2]. Correlation, regression and Bland-Altman analysis were employed to investigate the relationship between α and PAWP, α-based diagnosis of elevated PAWP (>15 mmHg) was analyzed by receiver operating characteristic curve analysis.
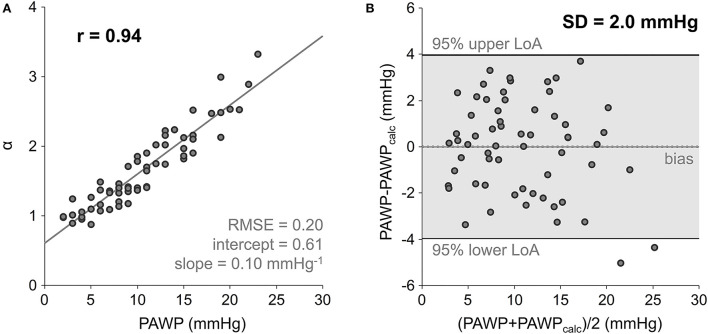
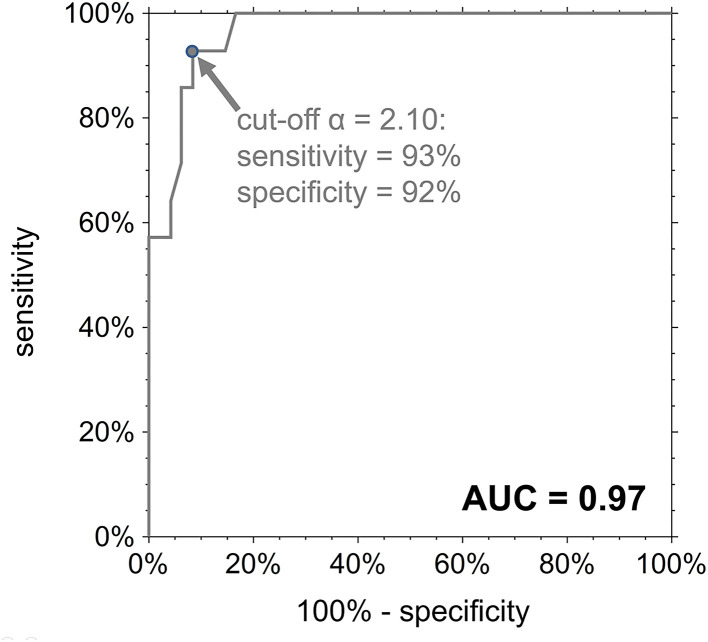
Results: α correlated very strongly with PAWP (r = 0.94). Standard deviation of differences between RHC-derived PAWP and PAWP estimated from linear regression model (α = 0.61 + 0.10·PAWP) was 2.0 mmHg. Employing the linear-regression-derived cut-off α = 2.10, the α-based diagnosis of elevated PAWP revealed the area under the curve 0.97 with sensitivity/specificity 93%/92%.
Conclusions: The very close relationship between the LA acceleration factor α and RHC-derived PAWP suggests α as potential non-invasive parameter for the estimation of PAWP and the distinction between pre- and post-capillary PH.
Keywords: 4D flow; cardiac magnetic resonance (CMR) imaging; pulmonary artery wedge pressure; pulmonary hypertension; right heart catheterization (RHC).
Copyright © 2022 Reiter, Kovacs, Reiter, Schmidt, Fuchsjäger, Olschewski and Reiter.
Conflict of interest statement
Author GR is an employee of Siemens Healthcare Diagnostics GmbH. The remaining authors declare that the research was conducted in the absence of any commercial or financial relationships that could be construed as a potential conflict of interest.
Figures
Similar articles
-
MR 4D flow-derived left atrial acceleration factor for differentiating advanced left ventricular diastolic dysfunction.Eur Radiol. 2024 Jun;34(6):4065-4076. doi: 10.1007/s00330-023-10386-9. Epub 2023 Nov 13. Eur Radiol. 2024. PMID: 37953367 Free PMC article.
-
MR 4D flow-based mean pulmonary arterial pressure tracking in pulmonary hypertension.Eur Radiol. 2021 Apr;31(4):1883-1893. doi: 10.1007/s00330-020-07287-6. Epub 2020 Sep 24. Eur Radiol. 2021. PMID: 32974687 Free PMC article.
-
Atrial fibrillation modifies the association between pulmonary artery wedge pressure and left ventricular end-diastolic pressure.Eur J Heart Fail. 2017 Nov;19(11):1483-1490. doi: 10.1002/ejhf.959. Epub 2017 Sep 25. Eur J Heart Fail. 2017. PMID: 28948687
-
Definitions and diagnosis of pulmonary hypertension.J Am Coll Cardiol. 2013 Dec 24;62(25 Suppl):D42-50. doi: 10.1016/j.jacc.2013.10.032. J Am Coll Cardiol. 2013. PMID: 24355641 Review.
-
DIAGNOSTIC AND PREDICTIVE VALUE OF RIGHT HEART CATHETERIZATION-DERIVED MEASUREMENTS IN PULMONARY HYPERTENSION.Wiad Lek. 2021;74(3 cz 1):546-553. Wiad Lek. 2021. PMID: 33813466 Review.
Cited by
-
Definition, classification and diagnosis of pulmonary hypertension.Eur Respir J. 2024 Oct 31;64(4):2401324. doi: 10.1183/13993003.01324-2024. Print 2024 Oct. Eur Respir J. 2024. PMID: 39209475 Free PMC article.
-
MR 4D flow-derived left atrial acceleration factor for differentiating advanced left ventricular diastolic dysfunction.Eur Radiol. 2024 Jun;34(6):4065-4076. doi: 10.1007/s00330-023-10386-9. Epub 2023 Nov 13. Eur Radiol. 2024. PMID: 37953367 Free PMC article.
-
Gender differences in the incidence of saphenous vein graft intervention.J Cardiothorac Surg. 2024 Dec 5;19(1):643. doi: 10.1186/s13019-024-03139-2. J Cardiothorac Surg. 2024. PMID: 39633444 Free PMC article.
-
A nomogram for predicting left atrial thrombus or spontaneous echo contrast in non-valvular atrial fibrillation patients using hemodynamic parameters from transthoracic echocardiography.Front Cardiovasc Med. 2024 Feb 8;11:1337853. doi: 10.3389/fcvm.2024.1337853. eCollection 2024. Front Cardiovasc Med. 2024. PMID: 38390444 Free PMC article.
References
-
- Galiè N, Humbert M, Vachiery J-L, Gibbs S, Lang I, Torbicki A, et al. . (2016). 2015 ESC/ERS guidelines for the diagnosis and treatment of pulmonary hypertension: the joint task force for the diagnosis and treatment of pulmonary hypertension of the European Society of Cardiology (ESC) and the European Respiratory Society (ERS) endorsed by: Association for European Paediatric and Congenital Cardiology (AEPC), International Society for Heart and Lung Transplantation (ISHLT). Eur Heart J. 37, 67–119. 10.1093/eurheartj/ehv317 - DOI - PubMed
-
- Reiter G, Reiter U, Kovacs G, Kainz B, Schmidt K, Maier R, et al. . Magnetic resonance–derived 3-dimensional blood flow patterns in the main pulmonary artery as a marker of pulmonary hypertension and a measure of elevated mean pulmonary arterial pressure. Circ Cardiovasc Imaging. (2008) 1:23–30. 10.1161/CIRCIMAGING.108.780247 - DOI - PubMed
Associated data
LinkOut - more resources
Full Text Sources
Medical