

Drug Diffusion Through Peer Networks: The Influence of Industry Payments
- PMID: 35992019
- PMCID: PMC9387671
- DOI: 10.1257/pol.20200044
Drug Diffusion Through Peer Networks: The Influence of Industry Payments
Abstract
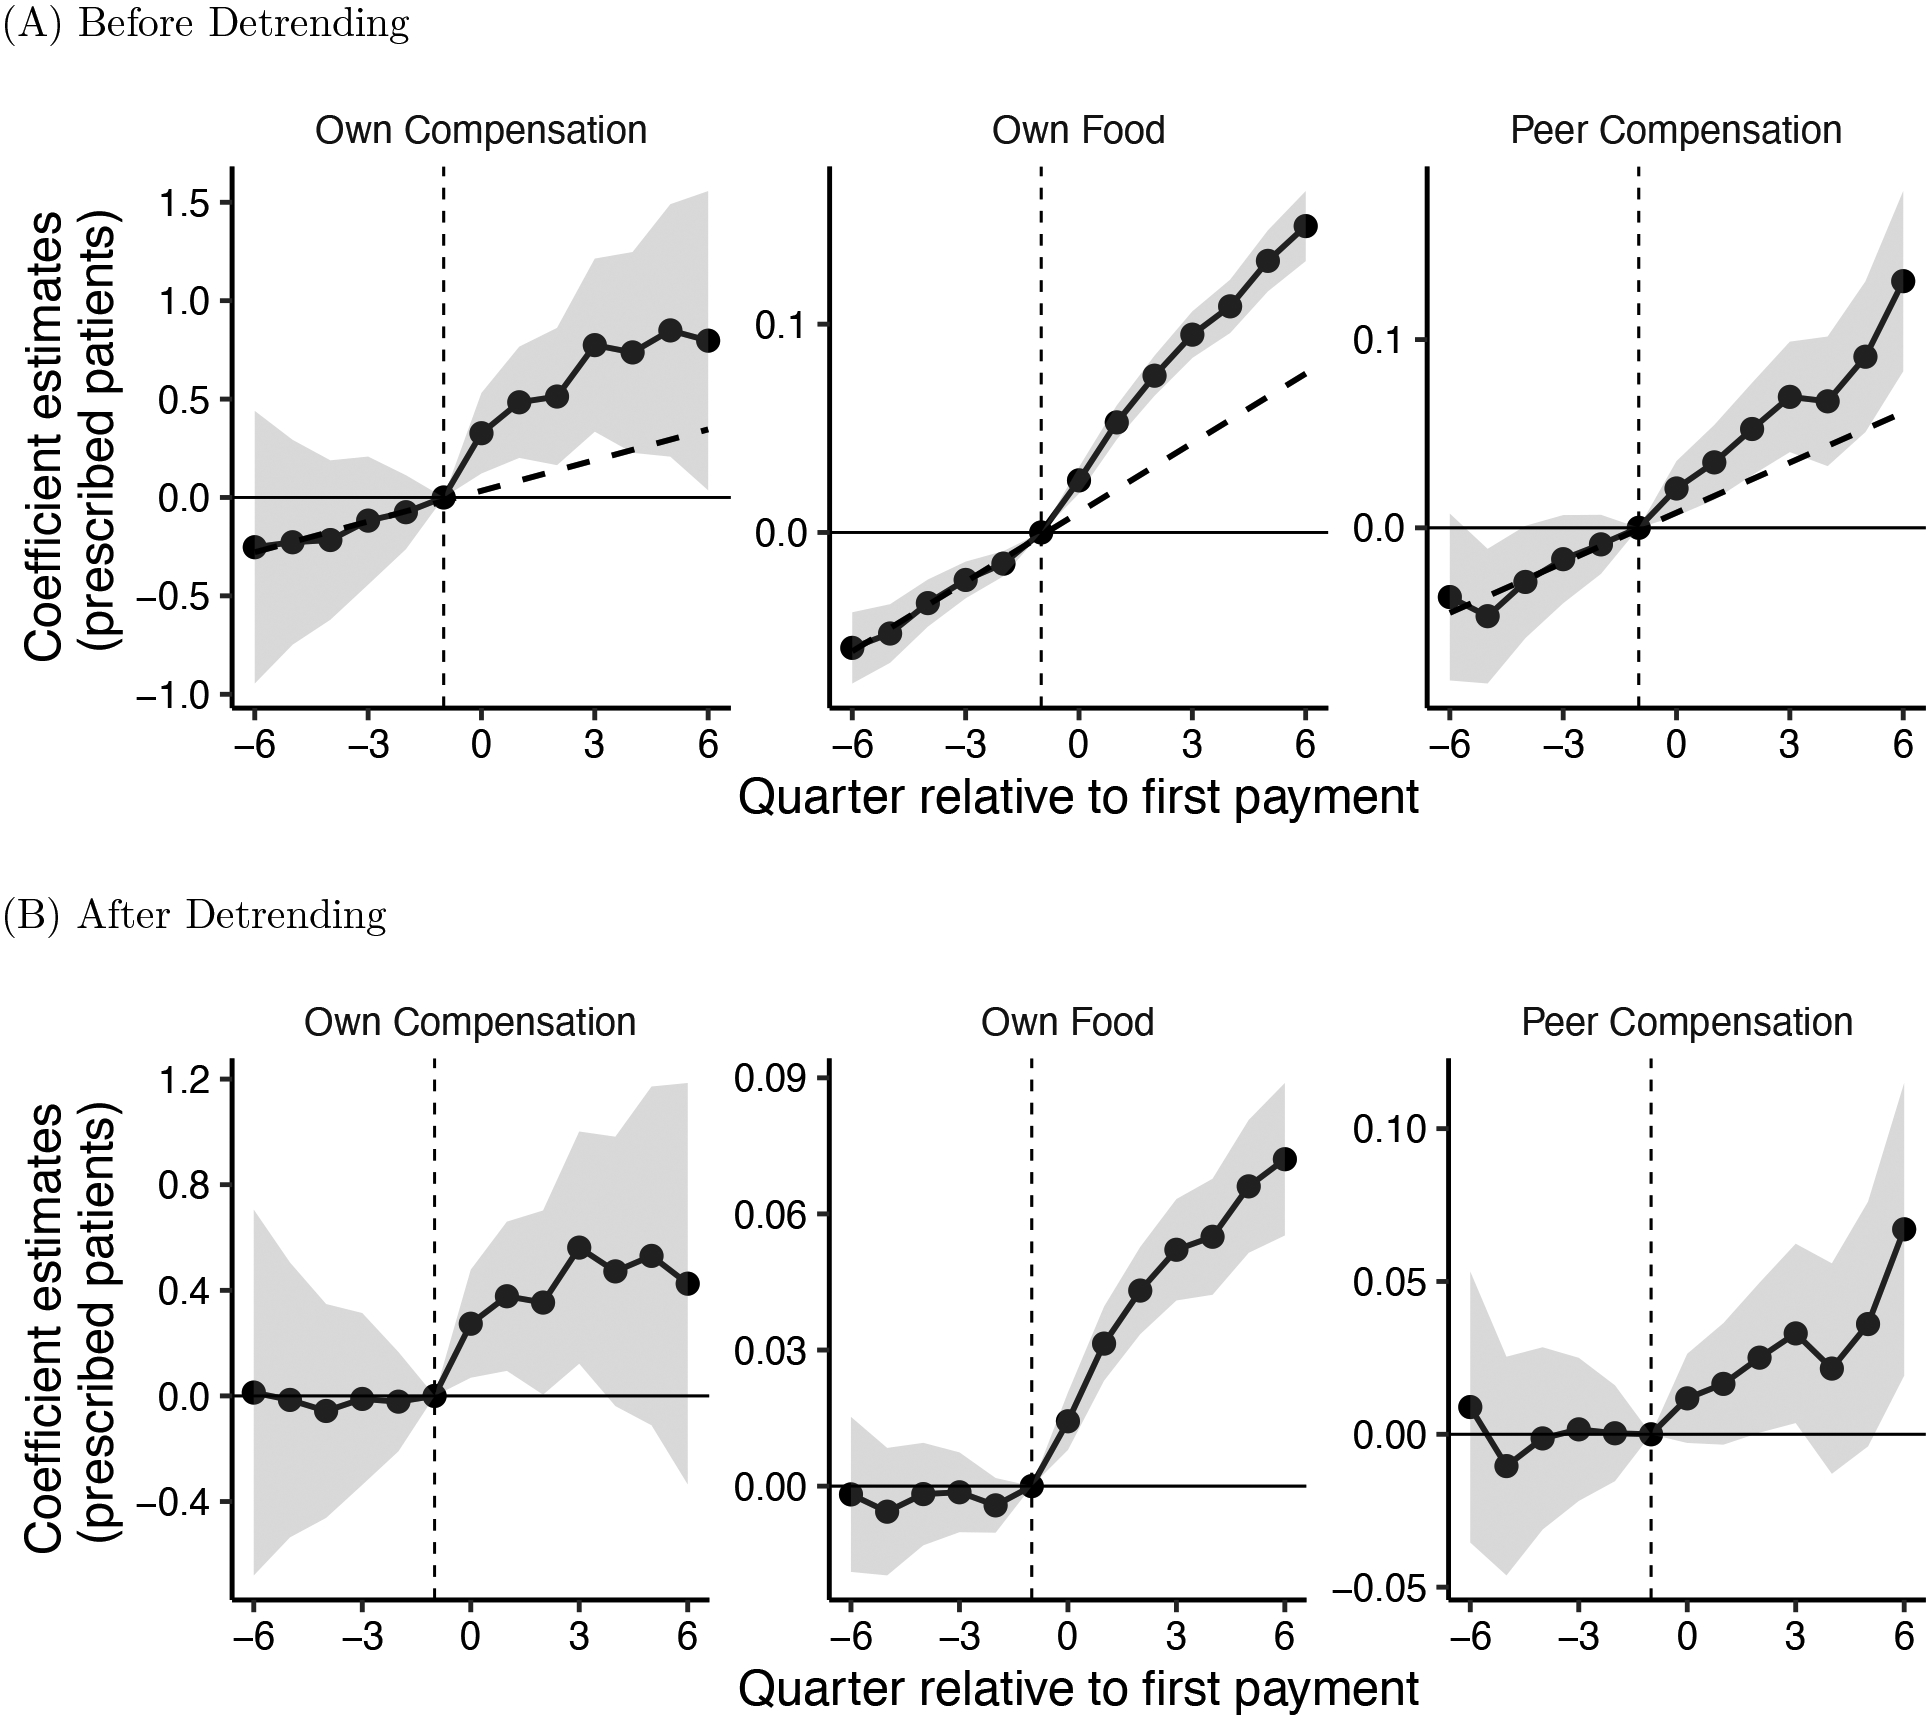
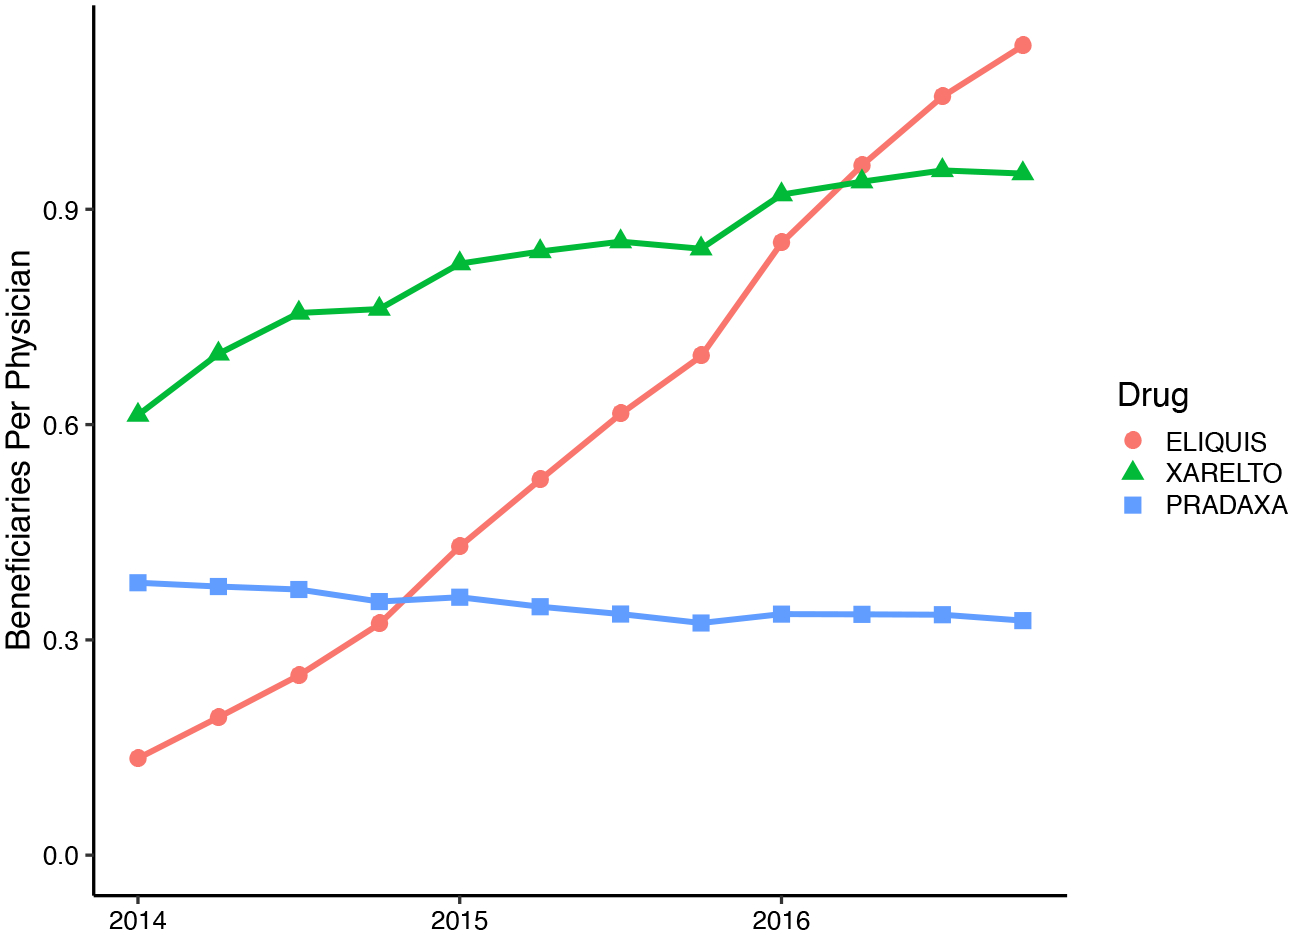
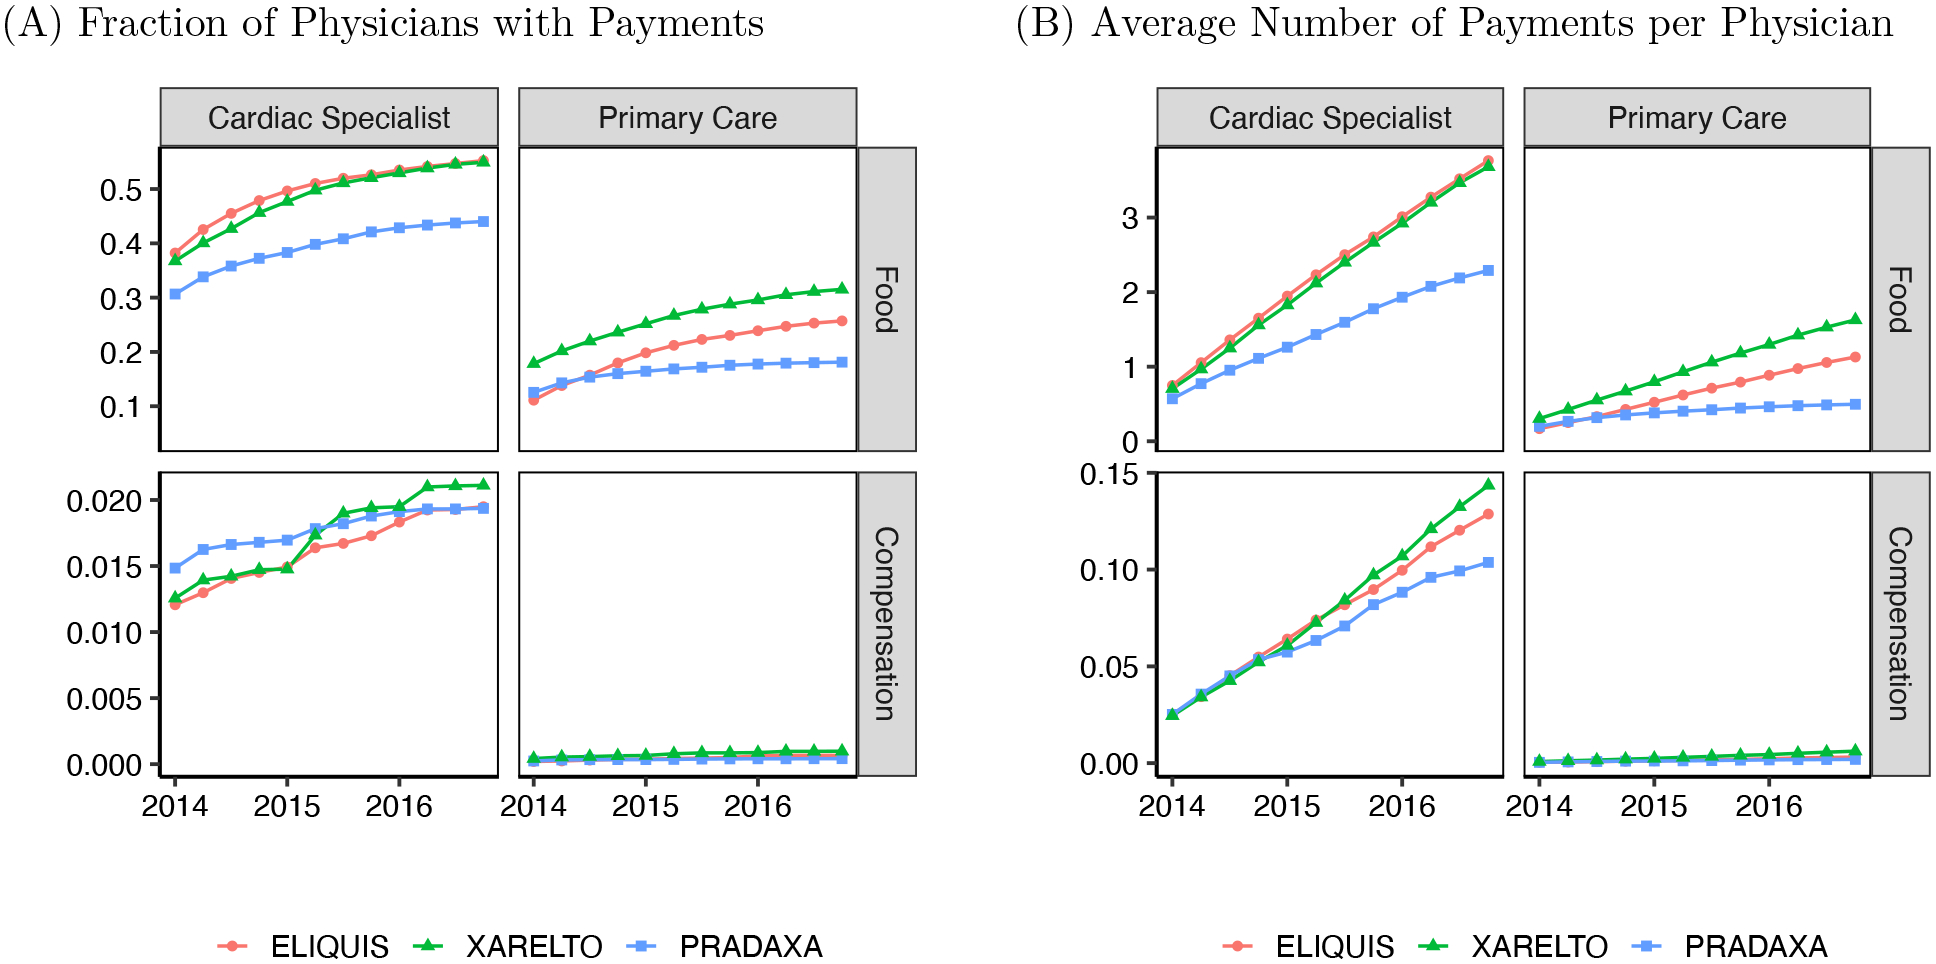
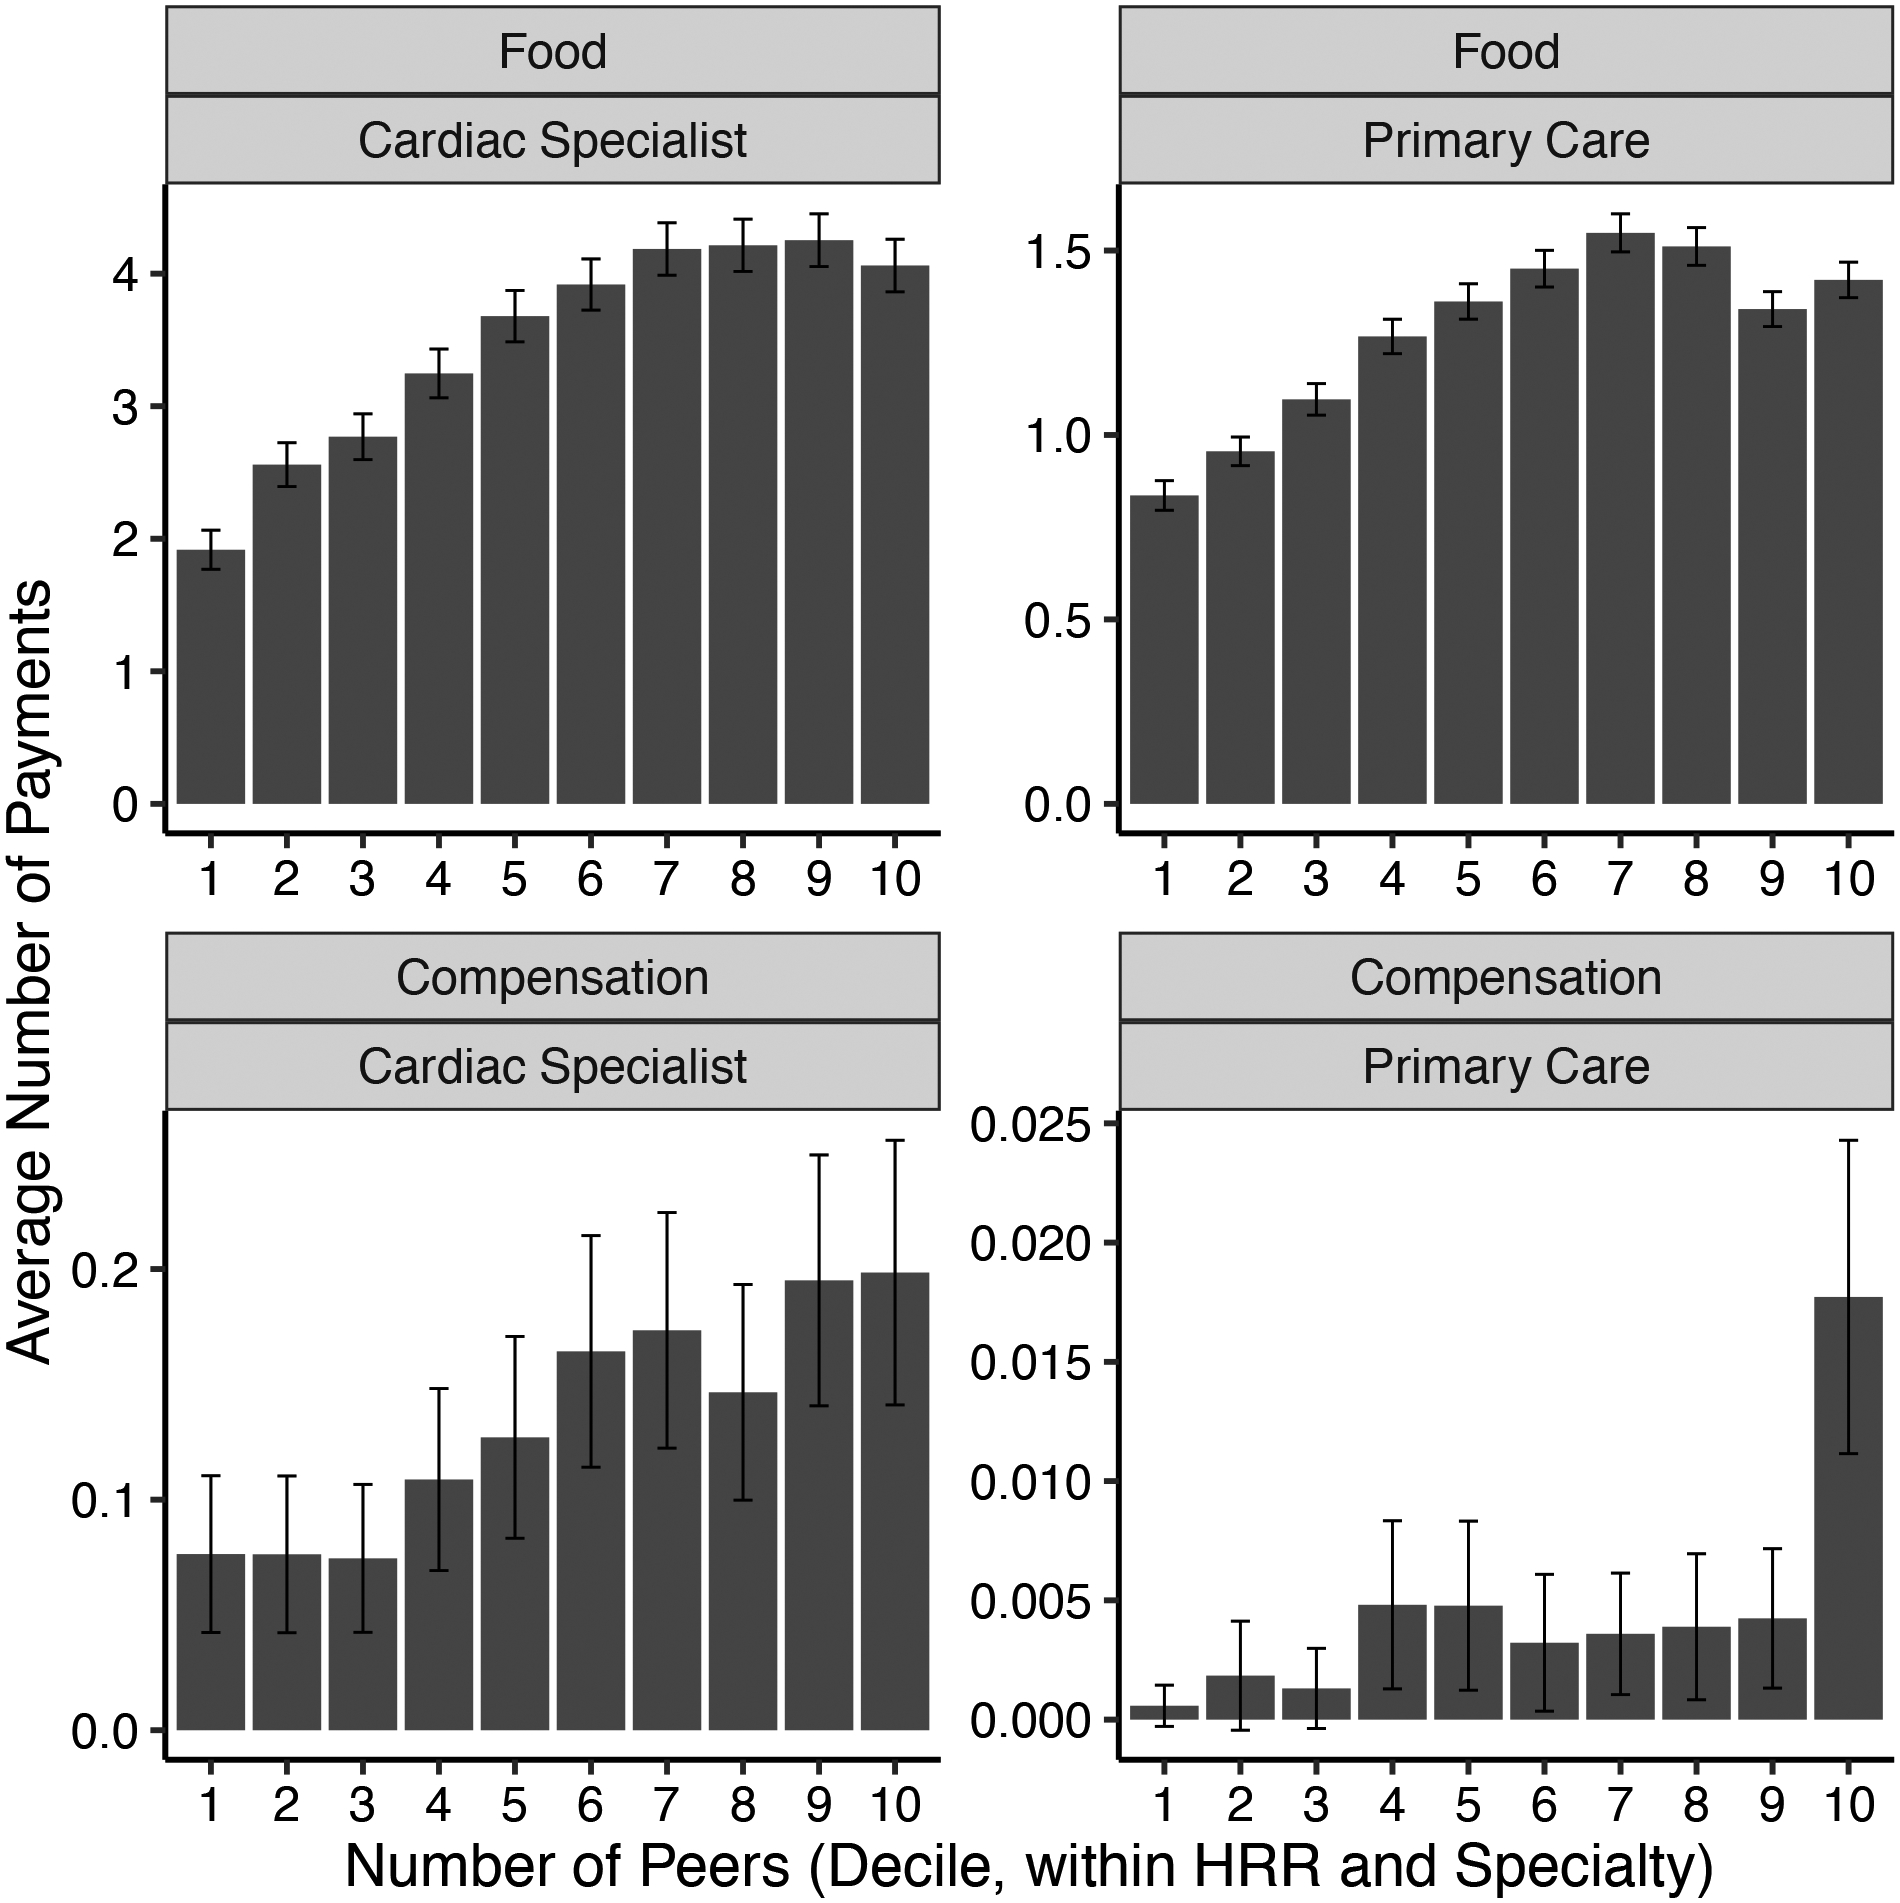
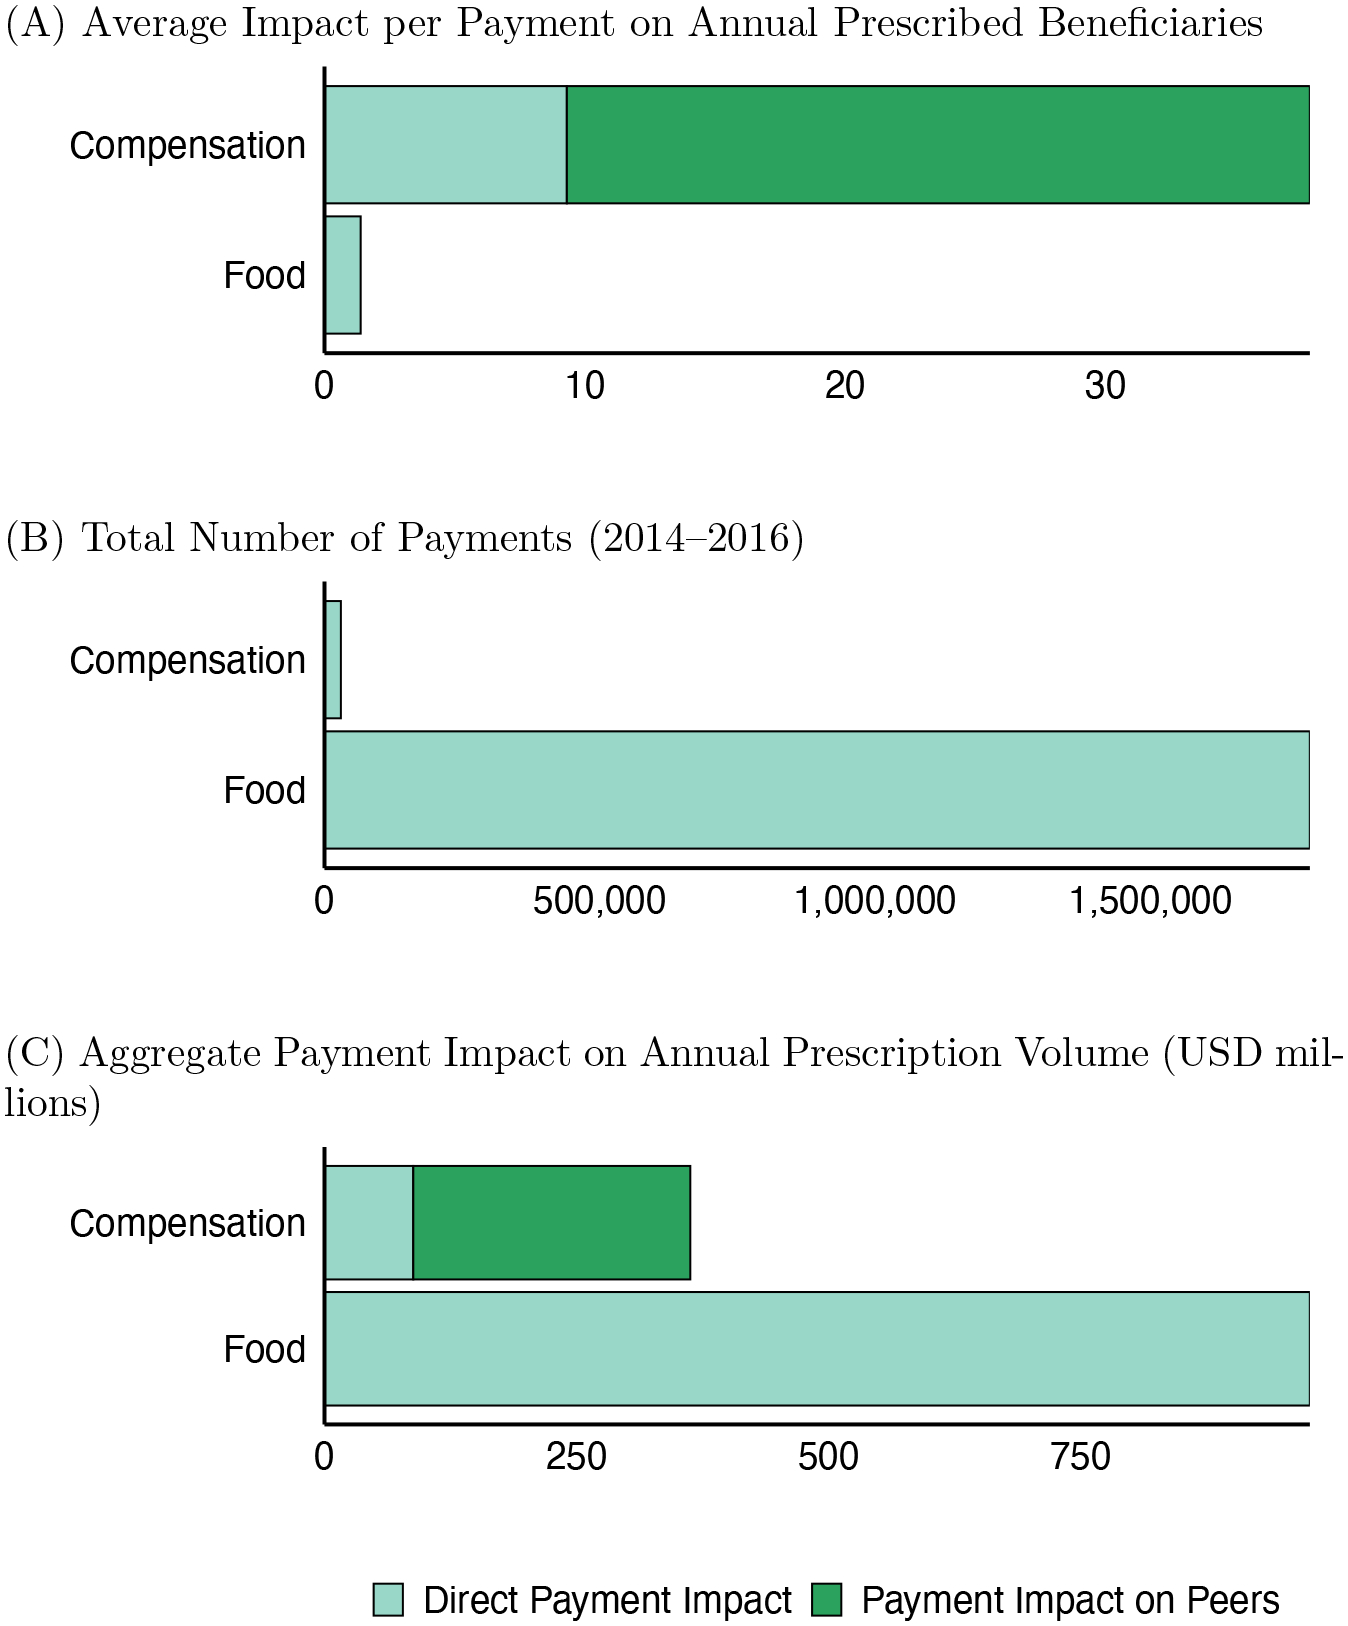
Pharmaceutical companies market to physicians through individual detailing accompanied by monetary or in-kind transfers. Large compensation payments to a small number of physicians account for most of this promotional spending. Studying US promotional payments and prescriptions for anticoagulant drugs, we investigate how peer influence broadens the payments' reach. Following a compensation payment, prescriptions for the marketed drug increase by both the paid physician and the paid physician's peers. Payments increase prescriptions to both recommended and contraindicated patients. Over three years, marketed anticoagulant prescriptions rose 23 percent due to payments, with peer spillovers contributing a quarter of the increase.
Keywords: I11; L14; O33; health care; networks; peer effects; pharmaceutical advertising; technology diffusion.
Figures
Similar articles
-
Medical Marketing in the United States, 1997-2016.JAMA. 2019 Jan 1;321(1):80-96. doi: 10.1001/jama.2018.19320. JAMA. 2019. PMID: 30620375
-
The impact of reducing pharmaceutical industry payments on physician prescribing.Health Econ. 2020 Mar;29(3):382-390. doi: 10.1002/hec.3993. Epub 2020 Jan 12. Health Econ. 2020. PMID: 31930636
-
Provider-directed marketing may increase prescribing of medications for opioid use disorder.J Subst Abuse Treat. 2019 Sep;104:104-115. doi: 10.1016/j.jsat.2019.06.014. Epub 2019 Jul 1. J Subst Abuse Treat. 2019. PMID: 31370974
-
Industry Compensation to Physician Vascular Specialist Authors of Highly-referenced Aortic Aneurysm Studies.Ann Vasc Surg. 2021 Jul;74:410-418. doi: 10.1016/j.avsg.2021.01.103. Epub 2021 Apr 2. Ann Vasc Surg. 2021. PMID: 33819597 Review.
-
Assessment of Pharmaceutical Company and Device Manufacturer Payments to Gastroenterologists and Their Participation in Clinical Practice Guideline Panels.JAMA Netw Open. 2018 Dec 7;1(8):e186343. doi: 10.1001/jamanetworkopen.2018.6343. JAMA Netw Open. 2018. PMID: 30646328 Free PMC article. Review.
Cited by
-
Personal Payments from Pharmaceutical Companies to Authors of Oncology Clinical Practice Guidelines.Oncologist. 2021 Sep;26(9):771-778. doi: 10.1002/onco.13823. Epub 2021 May 26. Oncologist. 2021. PMID: 33982829 Free PMC article.
-
Comparing pharmaceutical company payments in the four UK countries: a cross-sectional and social network analysis.BMJ Open. 2023 Mar 29;13(3):e061591. doi: 10.1136/bmjopen-2022-061591. BMJ Open. 2023. PMID: 36990486 Free PMC article.
-
Industry Payments to Physicians Are Kickbacks. How Should Stakeholders Respond?J Health Polit Policy Law. 2022 Dec 1;47(6):815-833. doi: 10.1215/03616878-10041205. J Health Polit Policy Law. 2022. PMID: 35867550 Free PMC article.
-
Quantifying Industry Spending on Promotional Events Using Open Payments Data.JAMA Health Forum. 2024 Jun 7;5(6):e241581. doi: 10.1001/jamahealthforum.2024.1581. JAMA Health Forum. 2024. PMID: 38941087 Free PMC article.
-
Physicians payment in the United States between 2014 and 2018: An analysis of the CMS Open Payments database.PLoS One. 2021 Jun 2;16(6):e0252656. doi: 10.1371/journal.pone.0252656. eCollection 2021. PLoS One. 2021. PMID: 34077460 Free PMC article.
References
-
- Abaluck Jason, Agha Leila, Chan David C Jr, Singer Daniel, and Zhu Diana, “Fixing Misallocation with Guidelines: Awareness vs. Adherence,” NBER Working Paper No. 27467, 2020.
-
- Agency for Healthcare Research and Quality, “Medical Expenditure Panel Survery,” 2014. data retrieved from https://meps.ahrq.gov.
-
- Angrist Joshua D, “The perils of peer effects,” Labour Economics, 2014, 30, 98–108.
-
- Banerjee Abhijit, Chandrasekhar Arun G., Duflo Esther, and Jackson Matthew O, “The diffusion of microfinance,” Science, 2013, 341 (6144), 1236498. - PubMed
Grants and funding
LinkOut - more resources
Full Text Sources