. 2022 Jul 16;25(8):104772.
doi: 10.1016/j.isci.2022.104772. eCollection 2022 Aug 19.

Single cell full-length transcriptome of human subcutaneous adipose tissue reveals unique and heterogeneous cell populations

Affiliations

Single cell full-length transcriptome of human subcutaneous adipose tissue reveals unique and heterogeneous cell populations

Katie L Whytock et al. iScience. .

Abstract

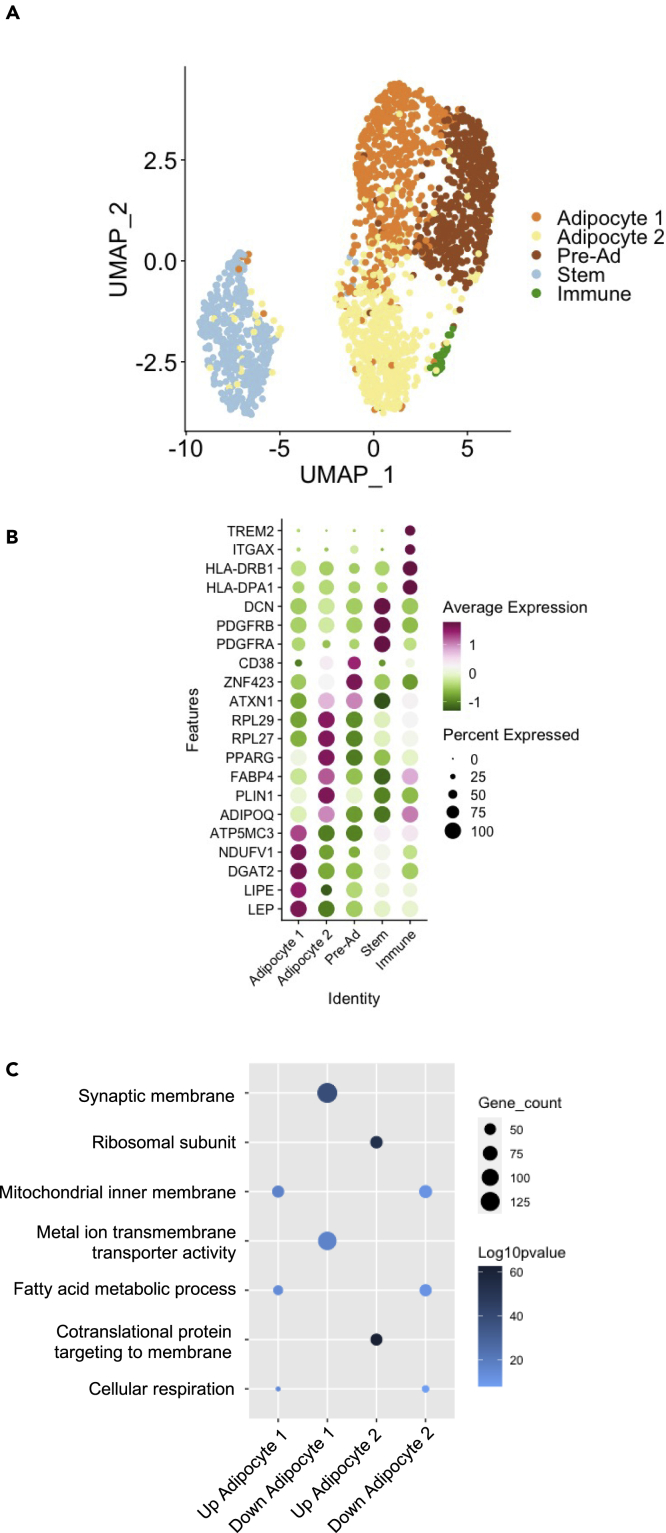
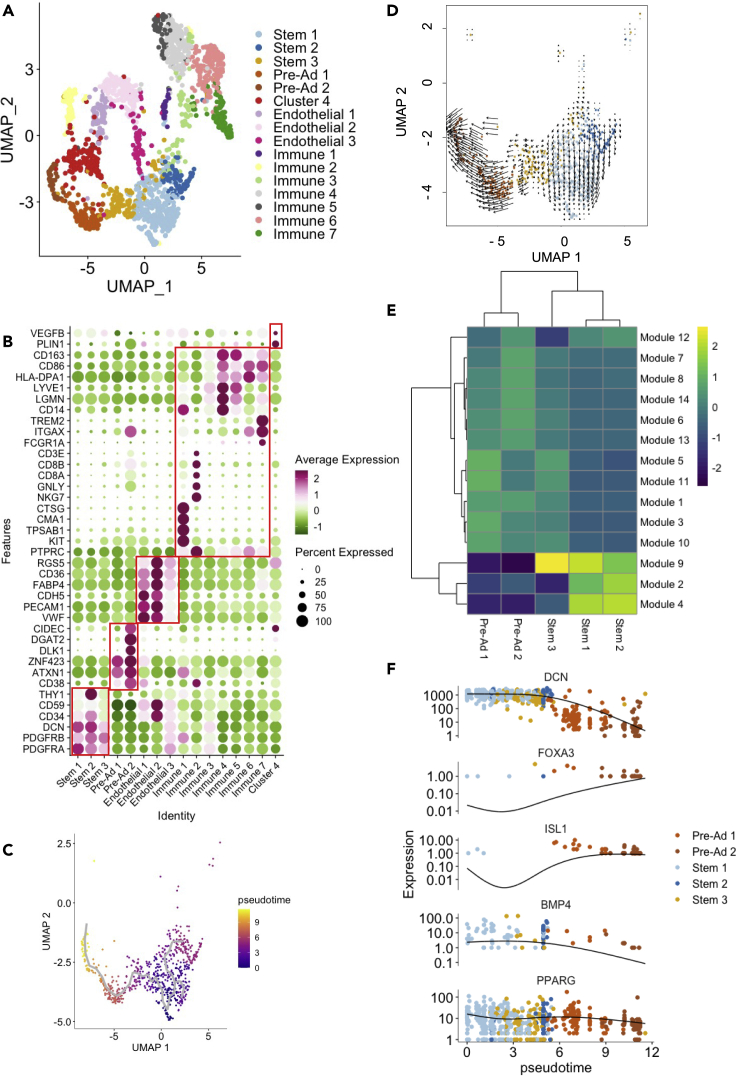
White adipose tissue (WAT) is a complex mixture of adipocytes and non-adipogenic cells. Characterizing the cellular composition of WAT is critical for identifying where potential alterations occur that impact metabolism. Most single-cell (sc) RNA-Seq studies focused on the stromal vascular fraction (SVF) which does not contain adipocytes and have used technology that has a 3' or 5' bias. Using full-length sc/single-nuclei (sn) RNA-Seq technology, we interrogated the transcriptional composition of WAT using: snRNA-Seq of whole tissue, snRNA-Seq of isolated adipocytes, and scRNA-Seq of SVF. Whole WAT snRNA-Seq provided coverage of major cell types, identified three distinct adipocyte clusters, and was capable of tracking adipocyte differentiation with pseudotime. Compared to WAT, adipocyte snRNA-Seq was unable to match adipocyte heterogeneity. SVF scRNA-Seq provided greater resolution of non-adipogenic cells. These findings provide critical evidence for the utility of sc full-length transcriptomics in WAT and SVF in humans.

Keywords: Cell biology; Omics; Transcriptomics.


Conflict of interest statement

The authors declare no competing interests.

Figures

None
Graphical abstract
Figure 1
Figure 1
Single nuclei RNA-Seq of frozen subcutaneous white adipose tissue (WAT) (A) UMAP showing 9 clusters from 2253 nuclei. (B) Dotplot showing average standardized expression of differentially expressed genes that distinguish cell population determined by Wilcoxon rank-sum test. (C) Selected gene ontology (GO) terms over-represented in the three adipocyte clusters. (D) Pseudotime trajectory of pre-adipocytes and adipocytes mapped to the UMAP. (E) RNA velocity analysis of pre-adipocytes and adipocytes mapped to the UMAP. (F) Boxplots showing median and minimum and maximum quartiles of adipocyte differentiation score (ADS) in each of the pre-adipocyte and adipocyte clusters. (G) Boxplots showing median and minimum and maximum quartiles of ADS according to octiles along the pseudotime trajectory.
Figure 2
Figure 2
Single nuclei RNA-Seq of isolated adipocytes derived from subcutaneous abdominal white adipose tissue (WAT) (A) UMAP showing 5 clusters from 2025 nuclei. (B) Dotplot showing average standardized expression of differentially expressed genes that distinguish cell population determined by Wilcoxon rank-sum test. (C) Selected gene ontology (GO) terms over-represented in the two adipocyte clusters.
Figure 3
Figure 3
Single cell RNA-Seq of the stromal vascular fraction derived from subcutaneous abdominal white adipose tissue (WAT) (A) UMAP plot showing 16 clusters from 1776 cells. (B) Dotplot showing average standardized expression of differentially expressed genes that distinguish the cell populations determined by Wilcoxon rank-sum test. (C) Pseudotime trajectory of stem cells and pre-adipocyte mapped onto SVF UMAP. (D) RNA velocity analysis of the stem cells and pre-adipocytes mapped to the UMAP. (E) Heatmap of aggregated expression of co-regulated genes for each module mapped to each cell-type from the pseudotime trajectory. (F) Single-cell expression trajectories of highlighted genes along the pseudotime trajectory.

References

    1. Acosta J.R., Joost S., Karlsson K., Ehrlund A., Li X., Aouadi M., Kasper M., Arner P., Rydén M., Laurencikiene J. Single cell transcriptomics suggest that human adipocyte progenitor cells constitute a homogeneous cell population. Stem Cell Res. Ther. 2017;8:250. doi: 10.1186/s13287-017-0701-4. - DOI - PMC - PubMed
    1. Bäckdahl J., Franzén L., Massier L., Li Q., Jalkanen J., Gao H., Andersson A., Bhalla N., Thorell A., Rydén M., et al. Spatial mapping reveals human adipocyte subpopulations with distinct sensitivities to insulin. Cell Metabol. 2021;33:1869–1882.e6. doi: 10.1016/j.cmet.2021.07.018. - DOI - PubMed
    1. Bakken T.E., Hodge R.D., Miller J.A., Yao Z., Nguyen T.N., Aevermann B., Barkan E., Bertagnolli D., Casper T., Dee N., et al. Single-nucleus and single-cell transcriptomes compared in matched cortical cell types. PLoS One. 2018;13:e0209648. doi: 10.1371/journal.pone.0209648. - DOI - PMC - PubMed
    1. Bergen V., Lange M., Peidli S., Wolf F.A., Theis F.J. Generalizing RNA velocity to transient cell states through dynamical modeling. Nat. Biotechnol. 2020;38:1408–1414. doi: 10.1038/s41587-020-0591-3. - DOI - PubMed
    1. Bergen V., Soldatov R.A., Kharchenko P.V., Theis F.J. RNA velocity—current challenges and future perspectives. Mol. Syst. Biol. 2021;17:e10282. doi: 10.15252/msb.202110282. - DOI - PMC - PubMed