. 2022 Aug 3:12:921410.
doi: 10.3389/fcimb.2022.921410. eCollection 2022.

Isolation, characterization, and functional study of extracellular vesicles derived from Leishmania tarentolae

Affiliations

Isolation, characterization, and functional study of extracellular vesicles derived from Leishmania tarentolae

Mehrdad Shokouhy et al. Front Cell Infect Microbiol. .

Abstract

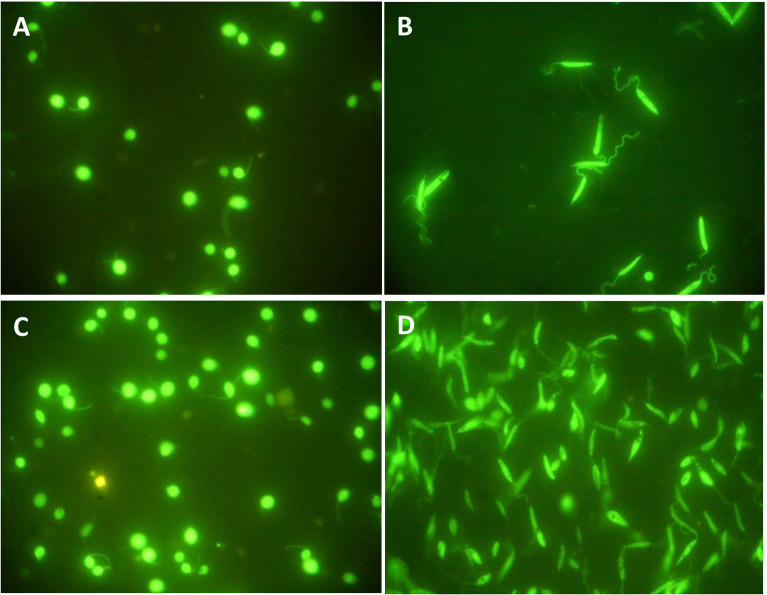
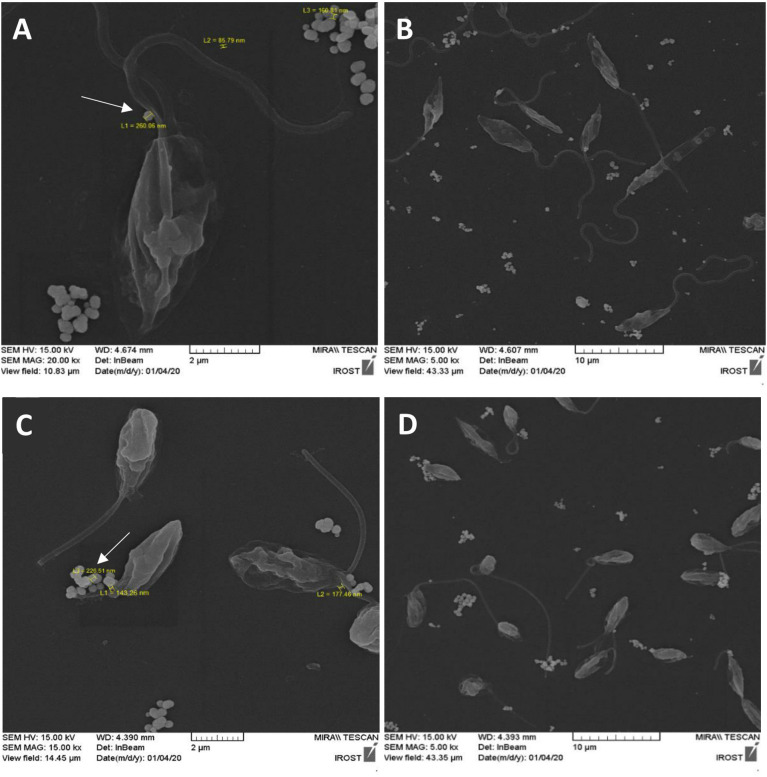
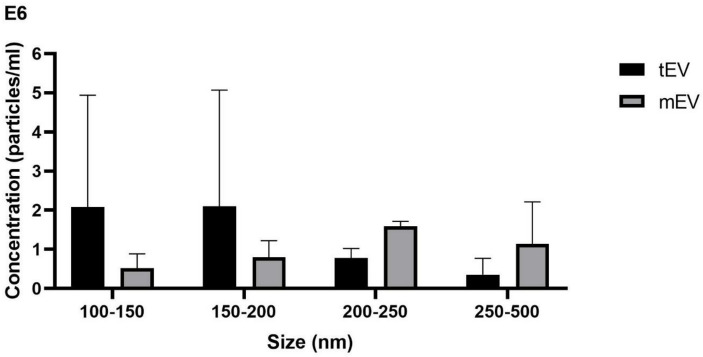
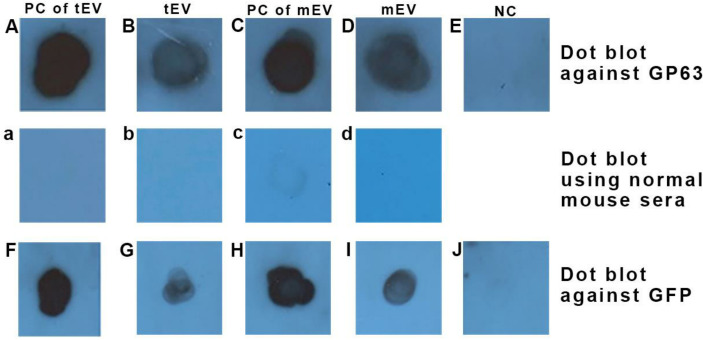
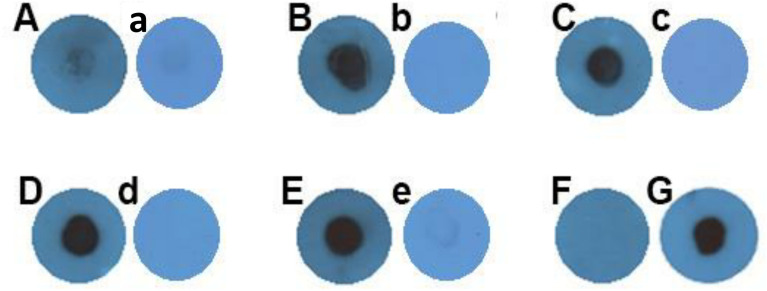
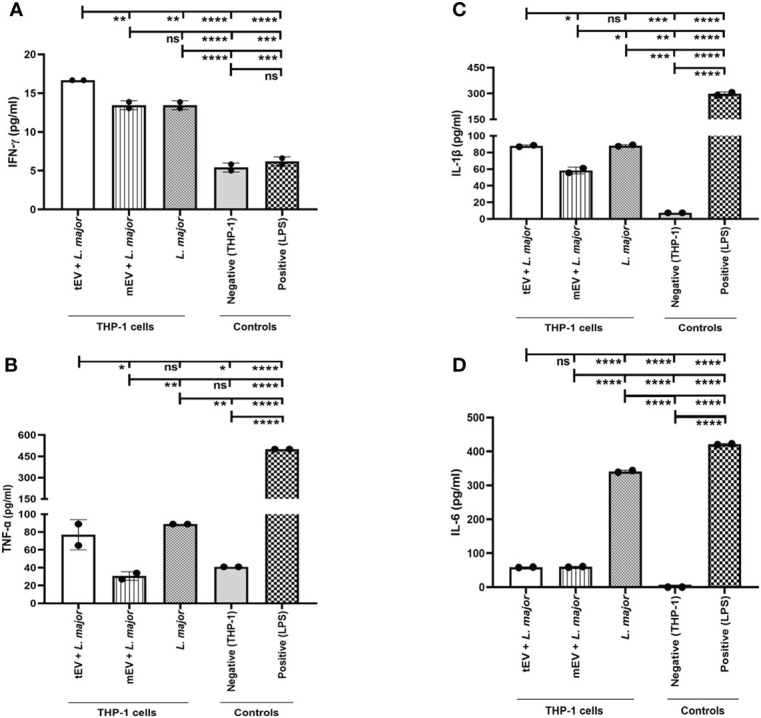
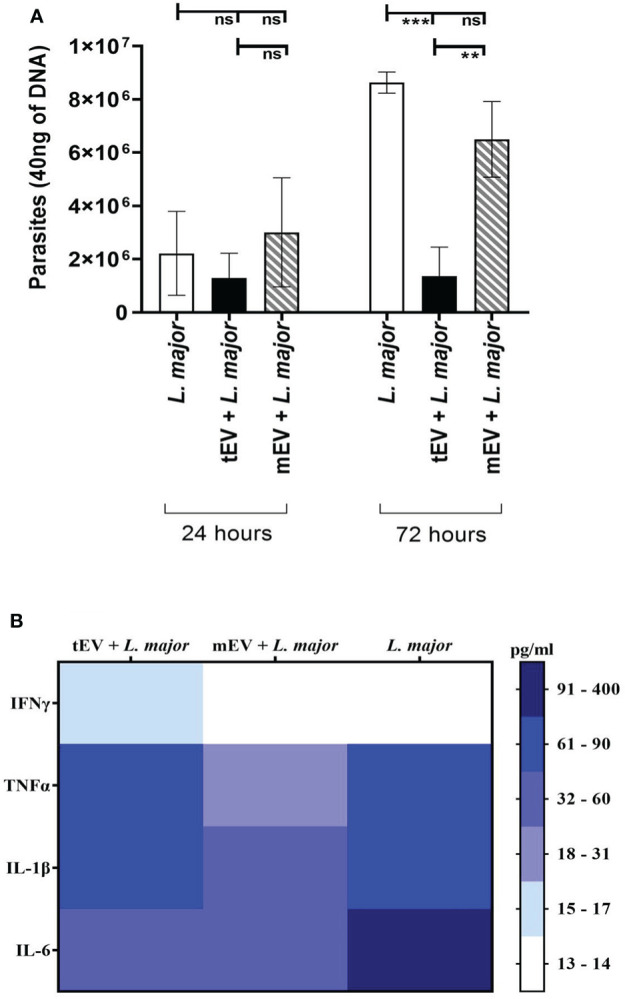
Leishmania (L.) species are protozoan parasites with a complex life cycle consisting of a number of developmental forms that alternate between the sand fly vector and their host. The non-pathogenic species L. tarentolae is not able to induce an active infection in a human host. It has been observed that, in pathogenic species, extracellular vesicles (EVs) could exacerbate the infection. However, so far, there is no report on the identification, isolation, and characterization of L. tarentolae EVs. In this study, we have isolated and characterized EVs from L. tarentolae GFP+ (tEVs) along with L. major GFP+ as a reference and positive control. The EVs secreted by these two species demonstrated similar particle size distribution (approximately 200 nm) in scanning electron microscopy and nanoparticle tracking analysis. Moreover, the said EVs showed similar protein content, and GFP and GP63 proteins were detected in both using dot blot analysis. Furthermore, we could detect Leishmania-derived GP63 protein in THP-1 cells treated with tEVs. Interestingly, we observed a significant increase in the production of IFN-γ, TNF-α, and IL-1β, while there were no significant differences in IL-6 levels in THP-1 cells treated with tEVs following an infection with L. major compared with another group of macrophages that were treated with L. major EVs prior to the infection. Another exciting observation of this study was a significant decrease in parasite load in tEV-treated Leishmania-infected macrophages. In addition, in comparison with another group of Leishmania-infected macrophages which was not exposed to any EVs, tEV managed to increase IFN-γ and decrease IL-6 and the parasite burden. In conclusion, we report for the first time that L. tarentolae can release EVs and provide evidence that tEVs are able to control the infection in human macrophages, making them a great potential platform for drug delivery, at least for parasitic infections.

Keywords: Leishmania major; Leishmania tarentolae; extracellular vesicles; human macrophage cell line; infection.


Conflict of interest statement

The authors declare that the research was conducted in the absence of any commercial or financial relationships that could be construed as a potential conflict of interest.

Figures

Figure 1
Figure 1
(A) L. tarentolae GFP+ and (B) L. major GFP+ on the fourth day of cultivation and before any manipulation; both species express GFP. (C) L. tarentolae GFP+ after 4 h of incubation at 26°C. (D) L. major GFP+ after 4 h of incubation at 37°C. No difference in morphology was observed. All images were taken using a fluorescence microscope at ×100 magnification (Nikon ECLIPSE E200, Japan).
Figure 2
Figure 2
FE-SEM image after 4 h of culture in serum-free medium clearly showing the production of extracellular vesicles (EVs) by both species. (A) L. major GFP+ at 37°C with 2-µm scale bar. The arrow indicates an EV produced by L. major GFP+ with a diameter of 260 nm. (B) L. major GFP+ with 10-µm scale bar. (C) L. tarentolae GFP+ at 26°C with 2-µm scale bar. The arrow indicates an EV produced by L. tarentolae GFP+ with a diameter of 226 nm. (D) L. tarentolae GFP+ with 10-µm scale bar.
Figure 3
Figure 3
Size and concentration demonstrated by nanoparticle tracking analysis (NTA) showing that tEV released from L. tarentolae GFP+ and mEV derived from L. major GFP+ contain 5.92 × 10⁸ and 5.45 × 10⁸ particles per milliliter, respectively. The bar chart depicts a comparison between tEV and mEV in terms of their concentration in different size intervals based on NTA. Most particles (D90) in both species were below 500 nm, and one-way ANOVA showed no significant differences between tEV and mEV within the size ranges considered. This graph represents the approximate concentration (particles/milliliter) in two individual rounds of the NTA assay.
Figure 4
Figure 4
Dot blot using anti-GP63 (upper row) confirmed the presence of this GPI-anchored extracellular vesicle (EV) marker in EVs of both species and dot blot using anti-GFP (lower row) confirmed the presence of this cytosolic EV marker within EVs of both species. (A, F) L. tarentolae GFP+ extract as a positive control for tEV (35 µg protein in total). (B, G) L. tarentolae GFP+ EVs or tEV (1 µg in total). (C, H) L. major GFP+ extract as a positive control for mEV (35 µg in total). (D, I) L. major GFP+ EVs or mEV (1 µg in total). (E, J) Negative control (phosphate-buffered saline). The middle row depicts a separate dot blot using normal mouse sera as the primary antibody, which serves as a negative control. (a) L. tarentolae GFP+ extract (same as A, F). (b) L. tarentolae GFP+ EVs or tEV (similar to B, G). (c) L. major GFP+ extract (same as C, H). (d) L. major GFP+ EVs or mEV (similar to D, I). PC, positive control; tEV, L. tarentolae EV; mEV, L. major EV; NC, negative control.
Figure 5
Figure 5
Dot blot against GP63 on THP-1 macrophages treated with Leishmania EVs. (A) Negative control (macrophage without extracellular vesicle treatment). (B) THP-1 macrophages treated with tEV. (C) THP-1 macrophages treated with mEV. (D) THP-1 macrophages infected only with L. major GFP+. (E) L. major GFP+ extract. The concentration of all samples so far was 35 µg in total. (F) Negative control (phosphate-buffered saline). (G) β-actin positive control 35 µg THP-1, same sample as (A). All of the panels labeled with lowercase letters (a–e) are representative of another individual experiment on which normal mouse sera were used as the primary antibody with the same samples as those in each of the uppercase-labeled panels.
Figure 6
Figure 6
Cytokine assay on extracellular vesicle-treated and / or -infected THP-1 macrophages. Here different groups were included as mentioned in the result section (Treatment with tEVs induced cytokines in THP-1 macrophages). (A) IFN-γ production in 72 h showed a significant (**p-value = 0.0076) increase in the main test group (tEV + L. major) compared with both mEV+L. major and L. major groups. In addition, the statistical analysis between the main test group and other control groups (positive and negative control) showed a significant (****p-value < 0.0001) increase. The detection limit was 9–600 pg per milliliter. (B) TNF-α production in 24 h demonstrated a significant (*p-value = 0.0107) increase between the main test group and THP-1 macrophages which were treated with mEV prior to infection (mEV + L. major), whereas no significant differences were seen between the test group and the macrophages that were only infected with L. major. The detection limit was 15–1,000 pg/ml. (C) IL-1β production in 72 h showed a significant (*p-value = 0.0177) increase in the main test group compared with the mEV + L. major group, whereas no significant differences were detected between the test and the L. major group. Furthermore, the IL-1β levels were significantly increased with p-value = 0.0002 compared with the negative control group, but these levels were significantly reduced with p-value <0.0001 in comparison with the positive control group. The detection limit was 3–250 pg/ml. (D) IL-6 production in 48 h showed a significant (****p-value < 0.0001) decrease in the test group in comparison with the L. major group, while no significant differences were detected between the test and the mEV + L. major group. In a comparison between the test group and both control groups, the differences with p-value <0.0001 were significant, where the production of this cytokine was increased and decreased compared with the negative and positive control groups, respectively. The detection limit was 9–600 pg/ml. All of the results were derived from two individual experiments. The asterisk indicates the significant difference between the values of the indicated groups as determined by one-way ANOVA followed by Tukey’s test (*p < 0.05, **p < 0.01, ***p < 0.001, ****p < 0.0001, and ns, non-significant).
Figure 7
Figure 7
(A) The number of parasites present in 40 ng DNA of THP-1 macrophage after 24 and 72 h. In the two experimental groups, the macrophages were first treated with tEV or mEV for 24 h, and to evaluate their effect on THP-1 human macrophages, they were infected with the pathogenic L. major for 6 h, while the parasite burden was assessed using the genome extracted from them with Leishmania-specific RV1/RV2 primer. According to one-way ANOVA along with post-hoc Tukey’s test, the statistical analysis of three individual experiments, in the 72-h results, showed a significant difference (***p-value = 0.0003) between the control group—which was only infected with L. major—and the test group—which was treated with tEV before infection—which was significant (***p-value = 0.0003), furthermore, between the test group and the reference group that was treated with mEV before infection had a significant difference (**p-value = 0.0056). In 72 h, the differences between the control group and the reference group and also between all 24-h groups were not significant (*p < 0.05, **p < 0.01, ***p < 0.001, and ns, non-significant). (B) Cumulative comparison of the cytokine results (Figure 6) shown as a heat map for further comparison between tEV + L. major group with other groups in all studied cytokines.

Similar articles

Cited by

References

    1. Available at: https://www.who.int/en/news-room/factsheets/detail/leishmaniasis.
    1. Abdossamadi Z., Taheri T., Seyed N., Montakhab-Yeganeh H., Zahedifard F., Taslimi Y., et al. . (2017). Live leishmania tarentolae secreting HNP1 as an immunotherapeutic tool against leishmania infection in BALB/c mice. Immunotherapy 9 (13), 1089–1102. doi: 10.2217/imt-2017-0076 - DOI - PubMed
    1. Al-Kamel M. A. (2017). Stigmata in cutaneous leishmaniasis: Historical and new evidence-based concepts. Our Dermatol. Online/Nasza Dermatol Online 8 (1), 81–90. doi: 10.7241/ourd.20171.21 - DOI
    1. Alvar J., Vélez I. D., Bern C., Herrero M., Desjeux P., Cano J., et al. . (2012). Leishmaniasis worldwide and global estimates of its incidence. PloS One 7 (5), e35671. doi: 10.1371/journal.pone.0035671 - DOI - PMC - PubMed
    1. Angelini F., Ionta V., Rossi F., Miraldi F., Messina E., Giacomello A. (2016). Foetal bovine serum-derived exosomes affect yield and phenotype of human cardiac progenitor cell culture. BioImpacts: BI 6 (1), 15–24. doi: 10.15171/bi.2016.03 - DOI - PMC - PubMed

Publication types

LinkOut - more resources