. 2022 Aug 5:15:924534.
doi: 10.3389/fnmol.2022.924534. eCollection 2022.

Disrupting interaction between miR-132 and Mmp9 3'UTR improves synaptic plasticity and memory in mice

Affiliations

Disrupting interaction between miR-132 and Mmp9 3'UTR improves synaptic plasticity and memory in mice

Bozena Kuzniewska et al. Front Mol Neurosci. .

Abstract

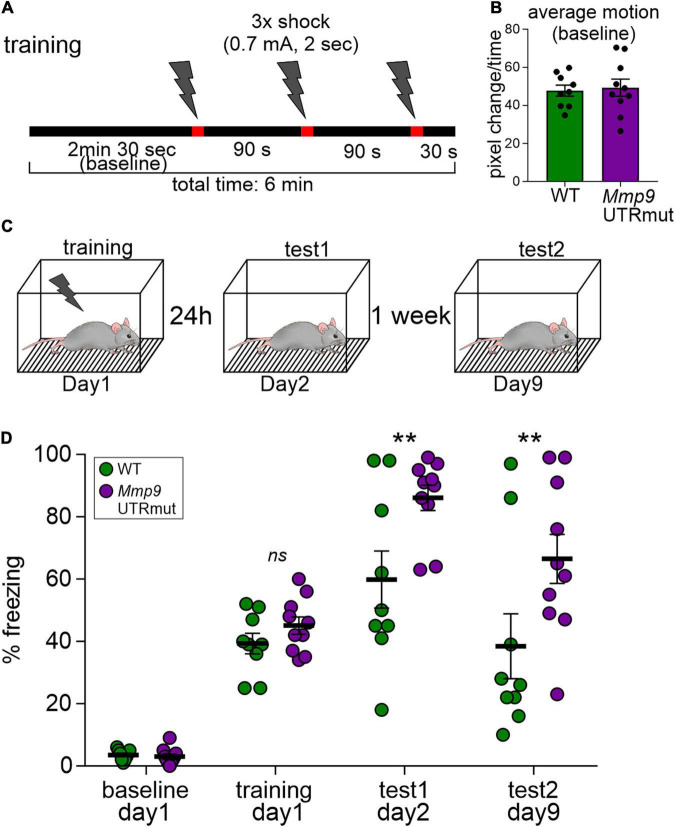
As microRNAs have emerged to be important regulators of molecular events occurring at the synapses, the new questions about their regulatory effect on the behavior have araised. In the present study, we show for the first time that the dysregulated specific targeting of miR132 to Mmp9 mRNA in the mouse brain results in the increased level of Mmp9 protein, which affects synaptic plasticity and has an effect on memory formation. Our data points at the importance of complex and precise regulation of the Mmp9 level by miR132 in the brain.

Keywords: Mmp9; behavior; brain; miR132; microRNA; synaptic plasticity.


Conflict of interest statement

The authors declare that the research was conducted in the absence of any commercial or financial relationships that could be construed as a potential conflict of interest.

Figures

FIGURE 1
FIGURE 1
Generating mouse model harboring mutation in miR132 binding site in 3′UTR of Mmp9 gene. (A) Schematic illustration of Mmp9 allele, which contains coding sequence (dark gray) and untranslated regions (UTR, shown in light gray). The sequence of 3′UTR fragment that contains miR132 binding site is depicted in blue and aligned with human and rat sequences. Sequence of miR132 is aligned with its binding site. (B) Sequence of Mmp9 3′UTR fragment. The position of miR132-binding site (seed match) is marked with a gray box (WT seed match in blue and mutated in red). Position of the single-guide RNA (sgRNA) target is indicated with light-blue box. PAM, protospacer adjacent motif and the “cut” position is marked. To facilitate the detection of mutations, restriction site for HpaI was introduced. (C) Schematic illustration of the strategy to introduce a knock-in mutations into the Mmp9 locus using CRISPR/Cas9 strategy. (D) Alignment of chromatograms covering miR132 seed match site in Mmp9: wild-type (WT, top) and mutant (Mmp9 UTRmut, bottom). Right panel, genotyping results of wild-type, heterozygous, and mutant mice based on HpaI (KspAI) digestion of PCR amplicons covering miR132 seed match site in Mmp9. (E) Nissl-stained coronal sections of brains from wild-type (a, b, e, f) and mutant (c, d, g, h) mice. No neuroanatomical differences were observed in the WT and Mmp9 UTRmut brains (a–d). Also, no abnormalities were found within the hippocampus (e, g) or in the cortex (f, h) of Mmp9 UTRmut mice.
FIGURE 2
FIGURE 2
Relative expression of mature miR132 (A) and Mmp9 mRNA (B) in the course of hippocampal development in Mmp9 UTRmut and WT mice assessed by qRT-PCR. Generally, no significant differences in miR132 (A) and Mmp9 mRNA (B) levels were observed among the two genotypes at any developmental stage. A two-way ANOVA revealed that there was statistically significant interaction between the effects of genotype and developmental stage on miR132 levels [(A) F(4,34) = 3.61; p = 0.015], but not on Mmp9 mRNA levels [(B) F(4,32) = 0.59; p = 0.68] in the hippocampus. Simple main effects analysis showed that genotype did not have a statistically significant effect neither on miR132 levels [F(1,34) = 1.05; p = 0.31], nor on Mmp9 mRNA levels [F(1,32) = 0.12; p = 0.74]. However, developmental stage did have a statistically significant effect on both miR132 [F(4,34) = 69.53; p < 0.0001] and on Mmp9 mRNA [F(4,32) = 23.35; p < 0.0001] levels. (A) Expression of miR132 was increased gradually and significantly during the development of the hippocampus at P15, P22, and P26 till adulthood (P49) in both genotypes (as compared to P8; ***p < 0.001; post hoc Sidak’s multiple comparisons test). (B) Mmp9 mRNA levels were reduced by half already at P15 hippocampus and stayed on the same low level till adulthood (as compared to P8; **p < 0.01, ***p < 0.001; post hoc Sidak’s multiple comparisons test). Data is presented as mean ± SEM, normalized to P8 WT levels, dots correspond to single animals. Mmp9 mRNA level was normalized to Gapdh mRNA.
FIGURE 3
FIGURE 3
Mmp9 UTRmut mice display increased Mmp9 protein levels in the hippocampus and have shorter and more dense dendritic spines in the CA1 area. (A) Representative zymography gel revealing enzymatic activity of gelatinases from mouse hippocampus. Mmp9 and Mmp2 were identified as bright bands at ∼95 kDa and ∼65 kDa, respectively. (B) Two-way ANOVA did not reveal significant interaction between “genotype” and “development” factors [F(2,31) = 1.23; p = 0.3063], however, “development” factor had significant effect [F(2,31) = 11.62; p = 0.0002]. A significant increase of Mmp9 protein level was observed in the hippocampus of Mmp9 UTRmut mice at P28 (post hoc Sidak’s multiple comparisons test; *p = 0.0444; post hoc Bonferroni’s multiple comparisons test; *p = 0.0450). Data is presented as mean ± SEM. Mmp9 levels were normalized to Mmp2 levels and presented as relative to WT P7. Dots correspond to single animals. (C) Examples of DiI-stained dendrites in the CA1 area of the hippocampus of wild-type (WT) and Mmp9 UTRmut mice. (D) Increased dendritic spine density in Mmp9 UTRmut mice as compared to WT (unpaired Student’s t-test; **p = 0.0022). Data is presented as mean ± SEM. Dots correspond to mean density from single image, n = 50 images/genotype; dendritic segments of four animals per genotype were analyzed. (E–H) Morphology of dendritic spines is altered in Mmp9 UTRmut mice. Data is presented as cumulative frequency of analyzed parameters and as mean ± SEM. Significant differences in the spine shape parameter: decreased length/width [(E) ***p < 0.0001], spine length [(F) ***p < 0.0001] and spine area [(G) **p = 0.0057] were found in Mmp9 UTRmut mice as compared to wild-types. Spine head width was unchanged in Mmp9 UTRmut mice [(H) ns p = 0.096]. Nested unpaired Student’s t-test was performed (dendritic segments of four animals per genotype were analyzed resulting in 67–79 images with 8890–9900 spines per experimental group). The analysis was performed in a blinded fashion. (I,J) Spines were clustered into three categories: long, stubby, and mushroom. Mmp9 UTRmut mice exhibited a significant decrease in the population of long spines as compared with WT mice (*p = 0.0399; two-way ANOVA, post hoc Sidak’s multiple comparisons test).
FIGURE 4
FIGURE 4
Mmp9 UTRmut mice show enhanced hippocampal long-term potentiation. (A) Electrophysiological recordings setup depicting positions of stimulating (stim) and recording (rec1, rec2) electrodes in CA1 and CA3 fields of the hippocampus (stPyr–stratum pyramidale, stRad–stratum radiatum). (B) Input/output curve of fEPSP amplitude. Data is represented as mean ± SEM (n: WT 18 slices/5 mice, Mmp9 UTRmut 18 slices/5 mice; two-way ANOVA with Bonferroni post hoc test). (C) Amplitude of population spikes measured in the CA1 stratum pyramidale during increasing intensity stimulation of Schaffer collaterals (n: WT-13 slices/5 mice, Mmp9 UTRmut 9 slices/5 mice; two-way ANOVA with Bonferroni post hoc test; **p < 0.01, ***p < 0.001). (D–F) LTP induction at CA3–CA1 hippocampal synapses. High frequency stimulation (HFS) consisted of 4 trains of 100 pulses at 100 Hz with 15 s intervals between consecutive trains. Data is represented as mean of fEPSP amplitudes normalized to mean of baseline fEPSP amplitude ± SEM (n: WT 9 slices/5 mice, Mmp9 UTRmut 9 slices/5 mice; repeated-measures two-way ANOVA with Bonferroni post hoc test; **p < 0.01). (F) Bar graph of the means ± SEM of normalized fEPSP amplitude calculated from the data in panel (E). Averaged amplitudes of fEPSP during 20 min baseline, 10 min after HFS (STP), and last 10 min of the recording (LTP) were plotted (n: WT 9 slices/5 mice, Mmp9 UTRmut 9 slices/5 mice; repeated-measures two-way ANOVA with Bonferroni post hoc test; **p < 0.01).
FIGURE 5
FIGURE 5
Learning is enhanced in contextual fear conditioning in the Mmp9 UTRmut mice. (A) Training protocol for fear conditioning indicating the number and timing of footshocks (lightning bolts). (B) Mouse activity within the conditioning chamber before the experiments was registered and quantified as an index of motion. (C) Scheme showing the experimental design. (D) Mice were conditioned according to the protocol and their freezing was recorded before the training–“baseline,” during the “training” and 24 h later–“test1.” Seven days after the training, the mice were exposed to the experimental chamber again and their freezing was recorded (“test2”). Mmp9 UTRmut mice showed enhanced freezing in the test1 as compared to WT (**p = 0.0099). After 1 week Mmp9 UTRmut mice still displayed enhanced freezing levels (** p = 0.0051). Data is presented as mean ± SEM. Dots correspond to single animals. Repeated-measures two-way ANOVA, post hoc Sidak’s multiple comparisons test.

Similar articles

Cited by

References

    1. Aujla P. K., Huntley G. W. (2014). Early postnatal expression and localization of matrix metalloproteinases-2 and -9 during establishment of rat hippocampal synaptic circuitry. J. Comp. Neurol. 522 1249–1263. 10.1002/cne.23468 - DOI - PMC - PubMed
    1. Bassell G. J., Warren S. T. (2008). Fragile X syndrome: Loss of local mRNA regulation alters synaptic development and function. Neuron 60 201–214. 10.1016/j.neuron.2008.10.004 - DOI - PMC - PubMed
    1. Ben-Ari Y. (2001). Developing networks play a similar melody. Trends Neurosci. 24 353–360. 10.1016/S0166-2236(00)01813-0 - DOI - PubMed
    1. Beroun A., Mitra S., Michaluk P., Pijet B., Stefaniuk M., Kaczmarek L. (2019). MMPs in learning and memory and neuropsychiatric disorders. Cell Mol. Life Sci. 76 3207–3228. 10.1007/s00018-019-03180-8 - DOI - PMC - PubMed
    1. Brennan G. P., Henshall D. C. (2020). MicroRNAs as regulators of brain function and targets for treatment of epilepsy. Nat. Rev. Neurol. 16 506–519. 10.1038/s41582-020-0369-8 - DOI - PubMed