. 2022;476(1-2):491-509.
doi: 10.1007/s11104-022-05530-1. Epub 2022 Jun 11.

Impact of root hairs on microscale soil physical properties in the field

Affiliations

Impact of root hairs on microscale soil physical properties in the field

M Marin et al. Plant Soil. 2022.

Abstract

Aims: Recent laboratory studies revealed that root hairs may alter soil physical behaviour, influencing soil porosity and water retention on the small scale. However, the results are not consistent, and it is not known if structural changes at the small-scale have impacts at larger scales. Therefore, we evaluated the potential effects of root hairs on soil hydro-mechanical properties in the field using rhizosphere-scale physical measurements.

Methods: Changes in soil water retention properties as well as mechanical and hydraulic characteristics were monitored in both silt loam and sandy loam soils. Measurements were taken from plant establishment to harvesting in field trials, comparing three barley genotypes representing distinct phenotypic categories in relation to root hair length. Soil hardness and elasticity were measured using a 3-mm-diameter spherical indenter, while water sorptivity and repellency were measured using a miniaturized infiltrometer with a 0.4-mm tip radius.

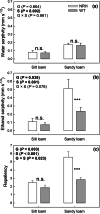
Results: Over the growing season, plants induced changes in the soil water retention properties, with the plant available water increasing by 21%. Both soil hardness (P = 0.031) and elasticity (P = 0.048) decreased significantly in the presence of root hairs in silt loam soil, by 50% and 36%, respectively. Root hairs also led to significantly smaller water repellency (P = 0.007) in sandy loam soil vegetated with the hairy genotype (-49%) compared to the hairless mutant.

Conclusions: Breeding of cash crops for improved soil conditions could be achieved by selecting root phenotypes that ameliorate soil physical properties and therefore contribute to increased soil health.

Supplementary information: The online version contains supplementary material available at 10.1007/s11104-022-05530-1.

Keywords: Barley; Root hairs; Soil health; Soil hydromechanical properties; Soil structure; Soil water retention.


Figures

Fig. 1
Fig. 1
Variation in root biomass (mg) of contrasting root hair genotypes grown in the field in silt loam (a) and sandy loam (b) soils in 2018. Four sampling campaigns were carried out: 19, 33, 49 and 61 days after sowing (DAS). Data are the mean of eight replicates (2018), with error bars representing the s.e. Differences between genotypes over the growing season were established using the REML analysis, P-values are reported and significant (P < 0.05) parameters are in bold, with ‘T’ representing time, ‘G’ representing genotype and ‘G × T’ representing the interaction of genotype and time. Identical letters indicate no significant differences between genotypes within the same sampling campaign as tested using one-way ANOVA followed by a post-hoc Tukey’s test. NRH represents the no root hair genotype and WT the wildtype (cv Optic), along a separate cv Sassy
Fig. 2
Fig. 2
Average root length (cm) per diameter class (0–0.4 mm; 0.4–1 mm; 1–1.5 mm; 1.5–2 mm; > 2 mm) of contrasting root hair genotypes grown in the field in silt loam (a; b; c; d) and sandy loam (e; f; g; h) soils. Four sampling campaigns were carried out: 19 (a; c), 33 (b; f), 49 (c; g) and 61 (d; h) days after sowing (DAS). Data are the mean of eight replicates, with error bars representing the s.e. Identical letters indicate no significant differences between genotypes, as tested using one-way ANOVA followed by a post-hoc Tukey’s test. NRH represents the no root hair genotype and WT the wildtype (cv Optic), along a separate cv Sassy
Fig. 3
Fig. 3
Estimated pore volume per diameter class: aeration pores (> 300 µm; a, e); drainage pores (300 – 30 µm; b, f); slow drainage and retention pores (30 – 0.2 µm; c, g); pores holding not-useful water for plants (< 0.2 µm; d, h) for cores sampled from NRH, WT and Sassy plots in silt loam soil at 0.1 m (a, b, c, d) and 0.2 m (a, f, g, h) depths during the growing season (i.e., days after sowing, DAS). The total volume of the soil core was equal to 95 cm.3. Data are the mean of four replicates ± standard error of mean. Differences between genotypes over the growing season were established using the REML analysis, P-values are reported and significant (P < 0.05) parameters are in bold, with ‘T’ representing time, ‘G’ representing genotype and ‘G × T’ representing the interaction of genotype and time. NRH represents the no root hair genotype and WT the wildtype (cv Optic), along a separate cv Sassy
Fig. 4
Fig. 4
Estimated pore volume per diameter class: aeration pores (> 300 µm; a, e); drainage pores (300 – 30 µm; b, f); slow drainage and retention pores (30 – 0.2 µm; c, g); pores holding not-useful water for plants (< 0.2 µm; d, h) for cores sampled from NRH, WT and Sassy plots in sandy loam soil at 0.1 m (a, b, c, d) and 0.2 m (a, f, g, h) depths during the growing season (i.e., days after sowing, DAS). The total volume of the soil core was equal to 95 cm.3. Data are the mean of four replicates ± standard error of mean. Differences between genotypes over the growing season were established using the REML analysis, P-values are reported and significant (P < 0.05) parameters are in bold, with ‘T’ representing time, ‘G’ representing genotype and ‘G × T’ representing the interaction of genotype and time. NRH represents the no root hair genotype and WT the wildtype (cv Optic), along a separate cv Sassy
Fig. 5
Fig. 5
Water sorptivity (a), ethanol sorptivity (b) and repellency (c) measured in soil cores sampled from different experimental treatments (i.e., NRH and WT) in both silt and sandy loam fields. Data are the mean of eight replicates, with error bars representing the s.e. Differences between genotypes and soil textures were established using two-way ANOVA, P-values are reported and significant (P < 0.05) parameters are in bold, with ‘G’ representing genotype, ‘S’ representing soil texture, and ‘G × S’ representing the interaction of genotype and soil texture. *** indicates a significant difference between NRH and WT samples, while n.s. indicates a lack of significant differences. NRH represents the no root hair genotype and WT the wildtype (cv Optic)
Fig. 6
Fig. 6
Average penetration resistance measured in soil cores sampled in NRH, WT and Sassy plots at 0.1 m (a; b) and 0.2 m (c; d) in the silt loam field during the growing season, and equilibrated on a suction ceramic plate at -5 kPa (a; c) and -20 kPa (b; d). Data are the mean of four replicates, with error bars representing the s.e. Differences between genotypes along the growing season were established using the REML analysis, P-values are reported and significant (P < 0.05) parameters are in bold, with ‘G’ representing genotype, ‘T’ representing time, and ‘G × T’ representing the interaction of genotype and time. The scatter plot indicates the penetration resistance measured in the field in May 2018 at 0.1 and 0.2 m depth in NRH (○), WT () and SASSY (□) plots using a field penetrometer. The soil water potential in the field averaged -5.9 ± 2.1 kPa at 0.2 m depth. Data are the mean of four replicates with error bars representing the s.e. NRH represents the no root hair genotype and WT the wildtype (cv Optic), along a separate cv Sassy
Fig. 7
Fig. 7
Average penetration resistance measured in soil cores sampled in NRH, WT and Sassy plots at 0.1 m (a; b) and 0.2 m (c; d) in the sandy loam field during the growing season, and equilibrated on a suction ceramic plate at -5 kPa (a; c) and -20 kPa (b; d). Data are the mean of four replicates, with error bars representing the s.e. Differences between genotypes along the growing season were established using the REML analysis, P-values are reported and significant (P < 0.05) parameters are in bold, with ‘G’ representing genotype, ‘T’ representing time, and ‘G × T’ representing the interaction of genotype and time. The scatter plot indicates the penetration resistance measured in the field in May 2018 at 0.1 and 0.2 m depth in NRH (○), WT () and SASSY (□) plots using a field penetrometer. The soil water potential in the field averaged -5.7 ± 2.0 kPa at 0.2 m depth. Data are the mean of four replicates with error bars representing the s.e. Identical letters indicate no significant differences between genotypes for each sampling campaign, as tested using one-way ANOVA followed by a post-hoc Tukey’s test. NRH represents the no root hair genotype and WT the wildtype (cv Optic), along a separate cv Sassy
Fig. 8
Fig. 8
Hardness (a) and elasticity (b) measured in soil cores sampled from different experimental treatments (i.e., NRH and WT) in both silt and sandy loam fields. Data are the mean of eight replicates, with error bars representing the s.e. Differences between genotypes and soil textures were established using two-way ANOVA, P-values are reported and significant (P < 0.05) parameters are in bold, with ‘G’ representing genotype, ‘S’ representing soil texture, and ‘G × S’ representing the interaction of genotype and soil texture. *** indicates a significant difference between NRH and WT samples, while n.s. indicates a lack of significant differences. NRH represents the no root hair genotype and WT the wildtype (cv Optic)

Similar articles

Cited by

References

    1. Ahmed MA, Kroener E, Benard P, Zarebanadkouki M, Kaestner A, Carminati A. Drying of mucilage causes water repellency in the rhizosphere of maize: measurements and modelling. Plant Soil. 2016;407:161–171. doi: 10.1007/s11104-015-2749-1. - DOI
    1. Aravena JE, Berli M, Ghezzehei TA, Tyler SW. Effects of root-induced compaction on rhizosphere hydraulic properties - X-ray microtomography imaging and numerical simulations. Environ Sci Technol. 2011;45:425–431. doi: 10.1021/es102566j. - DOI - PubMed
    1. Barré P, Hallett PD. Rheological stabilization of wet soils by model root and fungal exudates depends on clay mineralogy. Eur J Soil Sci. 2009;60:525–538. doi: 10.1111/j.1365-2389.2009.01151.x. - DOI
    1. Benard P, Kroener E, Vontobel P, Kaestner A, Carminati A. Water percolation through the root-soil interface. Adv Water Resour. 2016;95:190–198. doi: 10.1016/j.advwatres.2015.09.014. - DOI
    1. Bengough AG (2012) Water dynamics of the root zone: Rhizosphere biophysics and its control on soil hydrology. Vadose Zone J 11. 10.2136/vzj2011.0111

LinkOut - more resources