

Identification of potent inhibitors of SARS-CoV-2 infection by combined pharmacological evaluation and cellular network prioritization
- PMID: 35992305
- PMCID: PMC9374494
- DOI: 10.1016/j.isci.2022.104925
Identification of potent inhibitors of SARS-CoV-2 infection by combined pharmacological evaluation and cellular network prioritization
Abstract
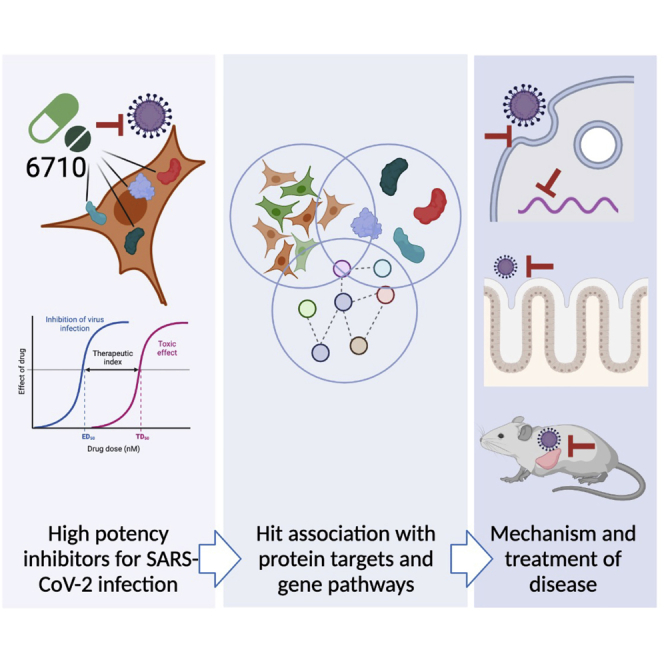
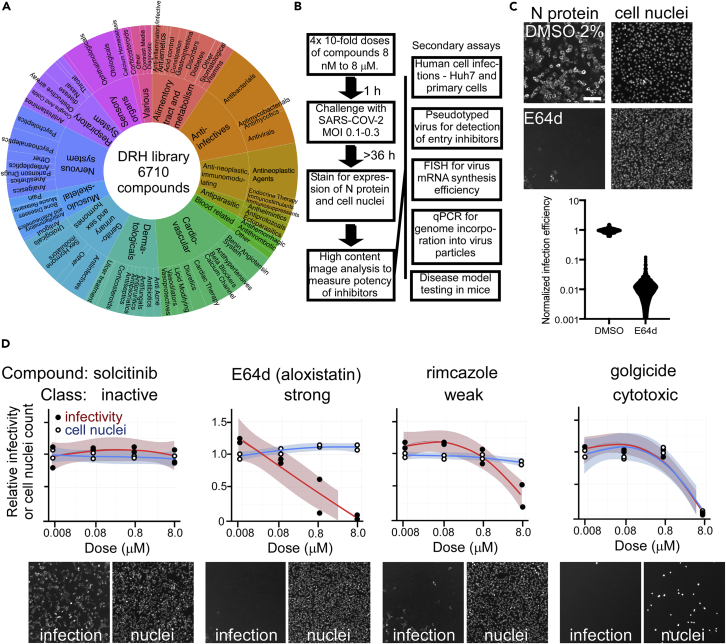
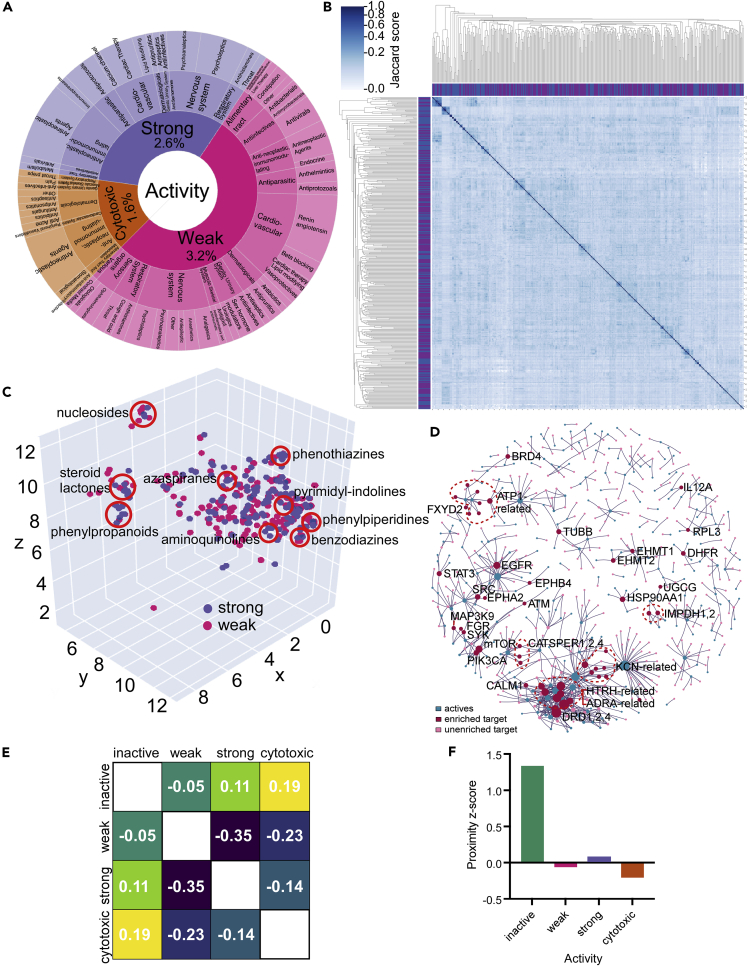
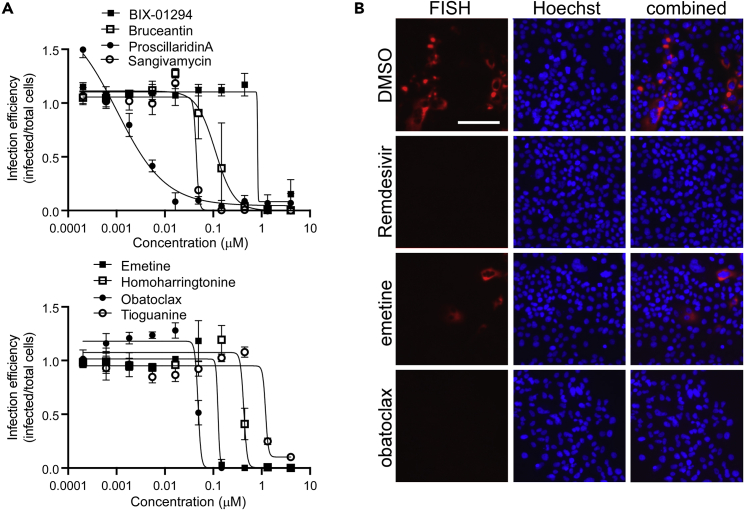
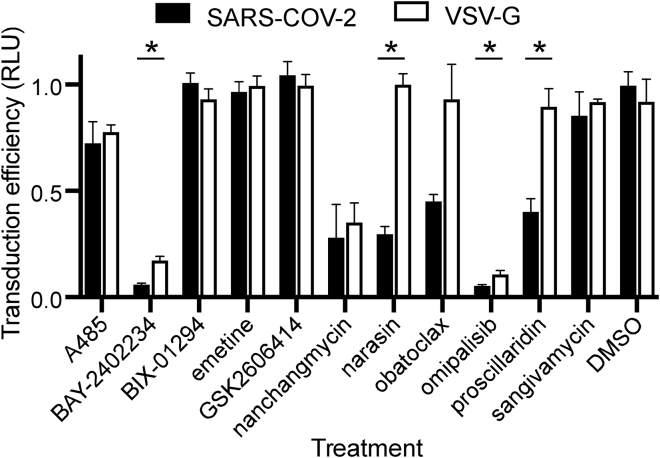
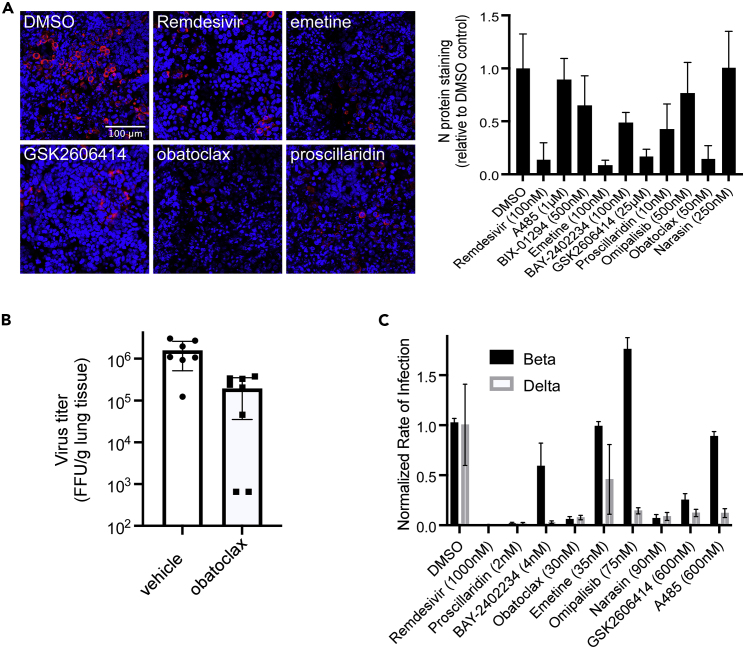
Pharmacologically active compounds with known biological targets were evaluated for inhibition of SARS-CoV-2 infection in cell and tissue models to help identify potent classes of active small molecules and to better understand host-virus interactions. We evaluated 6,710 clinical and preclinical compounds targeting 2,183 host proteins by immunocytofluorescence-based screening to identify SARS-CoV-2 infection inhibitors. Computationally integrating relationships between small molecule structure, dose-response antiviral activity, host target, and cell interactome produced cellular networks important for infection. This analysis revealed 389 small molecules with micromolar to low nanomolar activities, representing >12 scaffold classes and 813 host targets. Representatives were evaluated for mechanism of action in stable and primary human cell models with SARS-CoV-2 variants and MERS-CoV. One promising candidate, obatoclax, significantly reduced SARS-CoV-2 viral lung load in mice. Ultimately, this work establishes a rigorous approach for future pharmacological and computational identification of host factor dependencies and treatments for viral diseases.
Keywords: Bioinformatics; Pharmacoinformatics; Pharmacology; Virology.
© 2022 The Authors.
Conflict of interest statement
There are no interests to declare.
Figures
Update of
-
Identification of druggable host targets needed for SARS-CoV-2 infection by combined pharmacological evaluation and cellular network directed prioritization both in vitro and in vivo.bioRxiv [Preprint]. 2022 Feb 1:2021.04.20.440626. doi: 10.1101/2021.04.20.440626. bioRxiv. 2022. Update in: iScience. 2022 Sep 16;25(9):104925. doi: 10.1016/j.isci.2022.104925. PMID: 33907750 Free PMC article. Updated. Preprint.
Similar articles
-
Identification of druggable host targets needed for SARS-CoV-2 infection by combined pharmacological evaluation and cellular network directed prioritization both in vitro and in vivo.bioRxiv [Preprint]. 2022 Feb 1:2021.04.20.440626. doi: 10.1101/2021.04.20.440626. bioRxiv. 2022. Update in: iScience. 2022 Sep 16;25(9):104925. doi: 10.1016/j.isci.2022.104925. PMID: 33907750 Free PMC article. Updated. Preprint.
-
A New Cellular Interactome of SARS-CoV-2 Nucleocapsid Protein and Its Biological Implications.Mol Cell Proteomics. 2023 Jul;22(7):100579. doi: 10.1016/j.mcpro.2023.100579. Epub 2023 May 20. Mol Cell Proteomics. 2023. PMID: 37211047 Free PMC article.
-
Discovery of host-directed modulators of virus infection by probing the SARS-CoV-2-host protein-protein interaction network.Brief Bioinform. 2022 Nov 19;23(6):bbac456. doi: 10.1093/bib/bbac456. Brief Bioinform. 2022. PMID: 36305426 Free PMC article.
-
Current status of antivirals and druggable targets of SARS CoV-2 and other human pathogenic coronaviruses.Drug Resist Updat. 2020 Dec;53:100721. doi: 10.1016/j.drup.2020.100721. Epub 2020 Aug 26. Drug Resist Updat. 2020. PMID: 33132205 Free PMC article. Review.
-
Therapeutic potential of green tea catechin, (-)-epigallocatechin-3-O-gallate (EGCG) in SARS-CoV-2 infection: Major interactions with host/virus proteases.Phytomed Plus. 2023 Feb;3(1):100402. doi: 10.1016/j.phyplu.2022.100402. Epub 2022 Dec 30. Phytomed Plus. 2023. PMID: 36597465 Free PMC article. Review.
Cited by
-
Development of a robust and convenient dual-reporter high-throughput screening assay for SARS-CoV-2 antiviral drug discovery.Antiviral Res. 2023 Feb;210:105506. doi: 10.1016/j.antiviral.2022.105506. Epub 2022 Dec 21. Antiviral Res. 2023. PMID: 36565756 Free PMC article.
-
Machine learning-based integration of network features and chemical structure of compounds for SARS-CoV-2 drug effect analysis.CPT Pharmacometrics Syst Pharmacol. 2024 Feb;13(2):257-269. doi: 10.1002/psp4.13076. Epub 2023 Nov 20. CPT Pharmacometrics Syst Pharmacol. 2024. PMID: 37950385 Free PMC article.
-
The human E3 ligase RNF185 is a regulator of the SARS-CoV-2 envelope protein.iScience. 2023 May 19;26(5):106601. doi: 10.1016/j.isci.2023.106601. Epub 2023 Apr 8. iScience. 2023. PMID: 37095859 Free PMC article.
-
Inhibition of dimeric SARS-CoV-2 Mpro displays positive cooperativity and a mixture of covalent and non-covalent binding.iScience. 2025 May 28;28(7):112773. doi: 10.1016/j.isci.2025.112773. eCollection 2025 Jul 18. iScience. 2025. PMID: 40655098 Free PMC article.
-
Molecular interaction networks and drug development: Novel approach to drug target identification and drug repositioning.FASEB J. 2023 Jan;37(1):e22660. doi: 10.1096/fj.202201683R. FASEB J. 2023. PMID: 36468661 Free PMC article.
References
Grants and funding
LinkOut - more resources
Full Text Sources
Other Literature Sources
Molecular Biology Databases
Research Materials
Miscellaneous
