. 2022 Aug 5:10:930540.
doi: 10.3389/fbioe.2022.930540. eCollection 2022.

Rapid and Economical Drug-Eluting IOL Preparation via Thermoresponsive Agarose Coating for Effective Posterior Capsular Opacification Prevention

Affiliations

Rapid and Economical Drug-Eluting IOL Preparation via Thermoresponsive Agarose Coating for Effective Posterior Capsular Opacification Prevention

Siqi Chen et al. Front Bioeng Biotechnol. .

Abstract

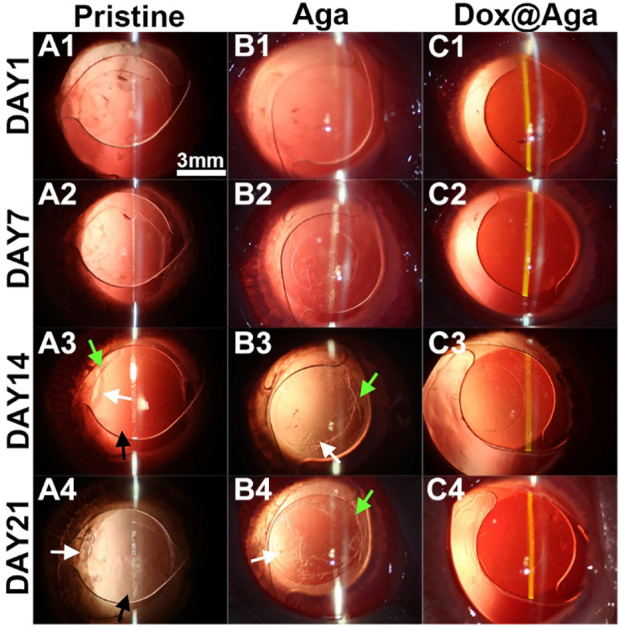
Posterior capsular opacification (PCO), the highest incidence complication after cataract surgery, is mainly due to the attachment, proliferation, and migration of the residual lens epithelial cells (LECs). Although the drug-eluting IOLs have been proved to be an effective way to prevent PCO incidence, its preparations are time consuming and require tedious preparation steps. Herein, the thermoreversible agarose is adopted to prepare drug-eluting IOL. Such functional coating can be obtained easily by simple immersion in the antiproliferative drug containing hot agarose and taken out for cooling, which not only does not affect the optical property but also can effectively decrease the PCO incidence after intraocular implantation. As a result, the proposed agarose coating provides a rapid and economical alternative of drug-eluting IOL fabrication for PCO prevention.

Keywords: agarose; drug-eluting coating; intraocular lens; posterior capsular opacification; surface modification.


Conflict of interest statement

The authors declare that the research was conducted in the absence of any commercial or financial relationships that could be construed as a potential conflict of interest.

Figures

SCHEME 1
SCHEME 1
Schematic illustration of the gelation process of Dox@Aga coating (A) and effects of Dox@Aga coating on the PCO prevention after IOL implantation (B).
FIGURE 1
FIGURE 1
(A) Representative scanning electron microscope images of the Aga coatings obtained by different Aga concentrations (A1–A5: 0.5 mg/ml, 1 mg/ml, 2 mg/ml, 4 mg/ml, and 6 mg/ml, respectively, scale bar: 200 μm). (B) Visible light transmittance of the Aga coatings obtained from different Aga concentrations. (C) UV spectra of Dox-loaded Aga coating obtained from different Aga concentrations with same Dox concentration. (D) The calculated Dox loading density in the Aga coating obtained from different Aga concentrations. N = 6, ns means no statistical significance when compared each group with every other group at the level of p < 0.05 using ANOVA followed by a post hoc test.
FIGURE 2
FIGURE 2
(A) Visible light transmittance of the Aga coatings obtained from different soaking time, including 0, 5, 15, 30, 60, and 120 min. (B) The calculated Dox loading density in the Aga coating obtained from different soaking time. N = 6, ns means no statistical significance when compared each group with every other group at the level of p < 0.05 using ANOVA followed by a post hoc test.
FIGURE 3
FIGURE 3
Representative fluorescent images of the FDA-stained LECs on the pristine and the different concentration of Dox-loaded Aga coating, cultured for 24 (A1–F1), 48 (A2–F2), and 72 h (A3–F3) (scale bar: 400 μm). (G) The LECs survival rate ratio on the coating modified material surfaces. N = 5, , ∗∗, ∗∗∗, and ∗∗∗∗ indicates p < 0.05.
FIGURE 4
FIGURE 4
(A) Diagram summarizing water contact angle on different substrates. (B) The stereomicroscopic images of different IOL: the pristine IOL, the agarose gel coating IOL (Aga), and the agarose gel coating IOL loaded with Dox (Dox@Aga) (scale bar: 3 mm). (C) Confocal laser scanning microscopic images of the surface morphology of the corresponding substrates; the red fluorescence represented Dox (scale bar: 40 μm). (D) Imaging quality of the different IOLs characterized by the United States Air Force (USAF) resolution board (scale bar: 1 mm and 200 μm). (E) The statistical diagram of refractive index of the three groups. N = 3, ns means no statistical significance when compared each group with every other group at the level of p < 0.05 using ANOVA followed by a post hoc test.
FIGURE 5
FIGURE 5
Representative fluorescent images of the LECs treated by the material leaching liquids with (B1–B3) or without (A1–A3) Aga coating modification, cultured for 24 h (A1, B1), 48 h (A2, B2), and 72 h (A3, B3). The green fluorescence represented FDA-stained LECs (scale bar: 400 μm). (C) The calculated cell density. N = 6, ns means no statistical significance when compared each group with the other group for the same time point at the level of p < 0.05 using ANOVA followed by a post hoc test.
FIGURE 6
FIGURE 6
Representative fluorescent images of the Hoechst-stained cells on the pristine, the Aga coating modified, and the Dox@Aga coating modified materials surfaces with incubation time of 24 h (A1–C1), 48 h (A2–C2), and 72 h (A3–C3). The blue fluorescence represented cell nucleus (scale bar: 400 μm). (D) The cell density of three groups, N = 5. (E) Statistical diagram of cell viability in three conditions. N = 6; ∗∗, ∗∗∗, and ∗∗∗∗ indicate p < 0.01.
FIGURE 7
FIGURE 7
(A1–C1) Representative fluorescent images of the calcein/PI-stained cells, green and red fluorescence represented live and dead LECs, respectively. (A2–C2, A3–C3) The scanning electron microscope images of cell morphology on the three different kinds of material surfaces at different magnifications. (A2–C2): ×500 and (A3–C3): ×2000. Scale bar: 150 and 40 μm, respectively.
FIGURE 8
FIGURE 8
Representative fluorescent images of the LECs on the three different kinds of materials surfaces (A4–C4). The cytomembrane (A1–C1), Dox (A2–C2), and nucleus (A3–C3) were represented by the green, red and blue fluorescence, respectively (scale bar:30 μm).
FIGURE 9
FIGURE 9
Cells seeding on three kinds of different materials surfaces in the 24-well cell culture plates to observe cell migration behavior. The representative photos taken by stereomicroscope from the general view (A1–C1; scale bar: 2 mm), peripheral area (A2–C2; scale bar: 400 μm), and central area (A3–C3; scale bar: 400 μm), respectively.
FIGURE 10
FIGURE 10
Representative slit lamp photographs of the rabbit eyes implanted with pristine IOLs (A1–A4), Aga coating modified IOLs (Aga) (B1–B4), and Dox@Aga coating modified IOLs (Dox@Aga) (C1–C4). The images were taken at postoperative days 1, 7, 14, and 21, respectively (black arrows indicated the scattered proliferating LECs; white arrows indicated the capsular wrinkles; scale bar: 3 mm).
FIGURE 11
FIGURE 11
(A1–C1) The visualized images of PCO matched with slit lamp microscopic images (scale bar: 3 mm). (A2–C2) The H&E staining slices of the lens capsular bag of the eyes implanted with the pristine (A), Aga coating modified (B), and Dox@Aga coating modified (C) IOLs (scale bar: 400 μm). (D) PCO clinical evaluation and scoring analysis. Opacification density was graded from 0 to 4 (0 = none, 1 = minimal, 2 = mild, 3 = moderate, 4 = severe). ∗∗ and ∗∗∗ indicate p < 0.01.
FIGURE 12
FIGURE 12
In vivo biocompatibility evaluation. (A) Representative specular microscopy images of corneal endothelial cells, including the nonoperative eyes and eyes implanted with the pristine, Aga coating modified, and Dox@Aga coating modified IOLs. (B) The intraocular pressure examination of eyes implanted with the pristine, Aga coating modified, and Dox@Aga coating modified IOLs (measurements were conducted at preoperative day, post-operative days 7, 14, and 21, respectively).
FIGURE 13
FIGURE 13
Representative H&E staining slices images of cornea, iris, and retina histomorphology after eyes implanted with the pristine, Aga coating modified, and Dox@Aga coating modified IOLs (scale bar: 200 μm).

References

    1. Ahuja G., Pathak K. (2009). Porous Carriers for Controlled/modulated Drug Delivery. Indian J. Pharm. Sci. 71 (6), 599–607. 10.4103/0250-474x.59540 - DOI - PMC - PubMed
    1. Awasthi N., Guo S., Wagner B. J. (2009). Posterior Capsular Opacification. Arch. Ophthalmol. 127 (4), 555–562. 10.1001/archophthalmol.2009.3 - DOI - PubMed
    1. Buckley C. T., Thorpe S. D., O’Brien F. J., Robinson A. J., Kelly D. J. (2009). The Effect of Concentration, Thermal History and Cell Seeding Density on the Initial Mechanical Properties of Agarose Hydrogels. J. Mech. Behav. Biomed. Mater. 2 (5), 512–521. 10.1016/j.jmbbm.2008.12.007 - DOI - PubMed
    1. Burq M. A., Taqui A. M. (2008). Frequency of Retinal Detachment and Other Complications after neodymium:Yag Laser Capsulotomy. J. Pak Med. Assoc. 58 (10), 550–552. 10.1117/12.43733 - DOI - PubMed
    1. García-Martínez L., Campos F., Godoy-Guzmán C., del Carmen Sánchez-Quevedo M., Garzón I., Alaminos M., et al. (2017). Encapsulation of Human Elastic Cartilage-Derived Chondrocytes in Nanostructured Fibrin-Agarose Hydrogels. Histochem Cell Biol. 147 (1), 83–95. 10.1007/s00418-016-1485-9 - DOI - PubMed