. 2022 Aug 5:10:866970.
doi: 10.3389/fbioe.2022.866970. eCollection 2022.

Evaluation of Load-To-Strength Ratios in Metastatic Vertebrae and Comparison With Age- and Sex-Matched Healthy Individuals

Affiliations

Evaluation of Load-To-Strength Ratios in Metastatic Vertebrae and Comparison With Age- and Sex-Matched Healthy Individuals

Dennis E Anderson et al. Front Bioeng Biotechnol. .

Abstract

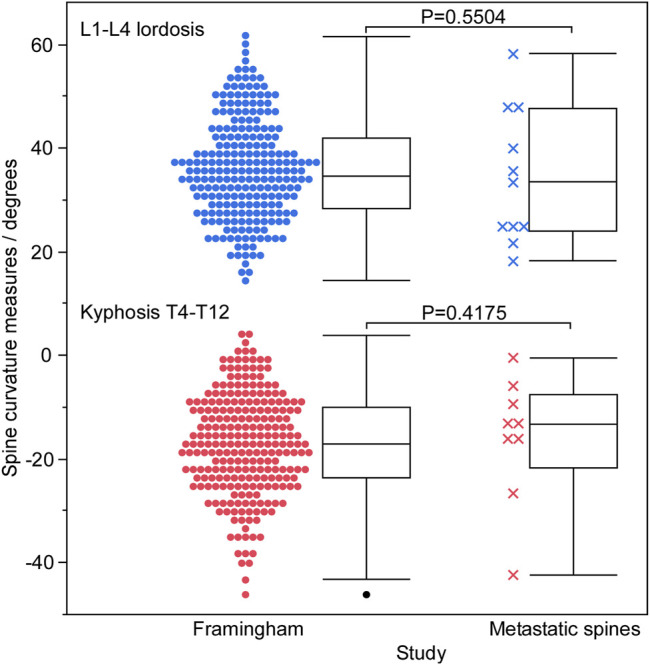
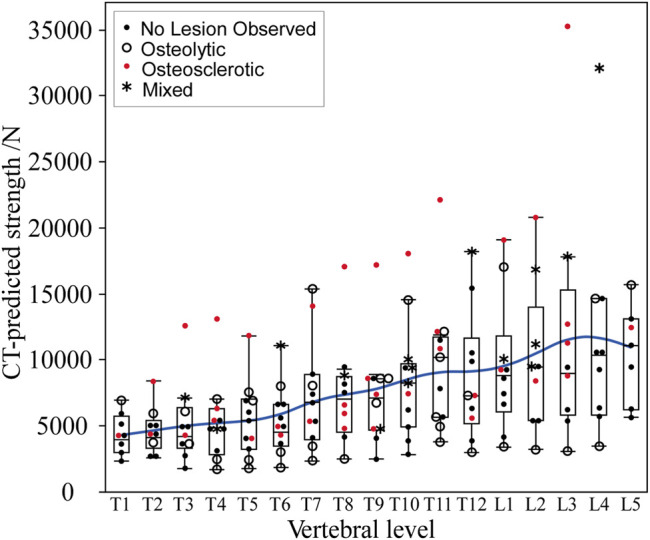
Vertebrae containing osteolytic and osteosclerotic bone metastases undergo pathologic vertebral fracture (PVF) when the lesioned vertebrae fail to carry daily loads. We hypothesize that task-specific spinal loading patterns amplify the risk of PVF, with a higher degree of risk in osteolytic than in osteosclerotic vertebrae. To test this hypothesis, we obtained clinical CT images of 11 cadaveric spines with bone metastases, estimated the individual vertebral strength from the CT data, and created spine-specific musculoskeletal models from the CT data. We established a musculoskeletal model for each spine to compute vertebral loading for natural standing, natural standing + weights, forward flexion + weights, and lateral bending + weights and derived the individual vertebral load-to-strength ratio (LSR). For each activity, we compared the metastatic spines' predicted LSRs with the normative LSRs generated from a population-based sample of 250 men and women of comparable ages. Bone metastases classification significantly affected the CT-estimated vertebral strength (Kruskal-Wallis, p < 0.0001). Post-test analysis showed that the estimated vertebral strength of osteosclerotic and mixed metastases vertebrae was significantly higher than that of osteolytic vertebrae (p = 0.0016 and p = 0.0003) or vertebrae without radiographic evidence of bone metastasis (p = 0.0010 and p = 0.0003). Compared with the median (50%) LSRs of the normative dataset, osteolytic vertebrae had higher median (50%) LSRs under natural standing (p = 0.0375), natural standing + weights (p = 0.0118), and lateral bending + weights (p = 0.0111). Surprisingly, vertebrae showing minimal radiographic evidence of bone metastasis presented significantly higher median (50%) LSRs under natural standing (p < 0.0001) and lateral bending + weights (p = 0.0009) than the normative dataset. Osteosclerotic vertebrae had lower median (50%) LSRs under natural standing (p < 0.0001), natural standing + weights (p = 0.0005), forward flexion + weights (p < 0.0001), and lateral bending + weights (p = 0.0002), a trend shared by vertebrae with mixed lesions. This study is the first to apply musculoskeletal modeling to estimate individual vertebral loading in pathologic spines and highlights the role of task-specific loading in augmenting PVF risk associated with specific bone metastatic types. Our finding of high LSRs in vertebrae without radiologically observed bone metastasis highlights that patients with metastatic spine disease could be at an increased risk of vertebral fractures even at levels where lesions have not been identified radiologically.

Keywords: load-to-strength ratio; metastatic disease; musculoskeletal models; spine; vertebral strength.


Conflict of interest statement

The authors declare that the research was conducted in the absence of any commercial or financial relationships that could be construed as a potential conflict of interest.

Figures

FIGURE 1
FIGURE 1
CT images presenting the radiographic appearance of vertebrae classified in this study as no lesion observed (NOL), osteolytic, mixed lesion, and osteosclerotic. The osteolytic vertebra exhibits several osteolytic foci and rarefication of bone trabecula within the vertebra. Note the destruction of bone architecture at the pedicle and transverse processes. The vertebra with osteosclerotic metastases shows unorganized bone trabeculae remodeling with high osteoid material deposition within the axial cross-section. In the vertebra with mixed metastases, several regions of sclerotic bone and large lytic foci are observed within the vertebral cross-section.
FIGURE 2
FIGURE 2
A graphical summary of spinal curvature measured for the Framingham cohort and cadaveric spines using SpineAnalyzer (Optasia Medical, Cheadle, United Kingdom), grouped by lordotic and kyphotic regions. No statistically significant difference was observed between the two groups in either the lumbar or thoracic regions.
FIGURE 3
FIGURE 3
A statistical summary of the CT-estimated bone mineral density (BMD) (A) and computed strength (B) of the metastatic vertebral levels grouped by bone lesion quality. The boxplot central line indicates the median; the box top and bottom boundaries indicate 25th and 75th percentiles, with whisker lines representing a 95% confidence interval. Vertebrae classified as osteosclerotic and mixed lesions showed significantly higher CT-estimated BMD and computed strength than vertebrae classified as NOL or osteolytic. There was no statistically significant difference in CT-estimated BMD or computed strength between vertebrae classified as NOL and osteolytic or osteosclerotic and mixed lesions.
FIGURE 4
FIGURE 4
Tobit regression analysis demonstrates that the CT-estimated model predicted strength is strongly associated with the measured vertebral strength, with the model performance agreeing with that obtained independently from FE analysis (Stadelmann et al., 2020).
FIGURE 5
FIGURE 5
In the metastatic spines, CT-estimated vertebral strength showed a monotonic increase from the upper thoracic to the lower lumbar vertebral levels. The boxplot central line indicates the median; the box top and bottom boundaries indicate 25th and 75th percentiles, with whisker lines representing a 95% confidence interval. Per level, osteolytic vertebrae predominantly formed the lower bounds, with osteosclerotic vertebrae predominantly forming the upper bounds of the estimated strength.
FIGURE 6
FIGURE 6
Regression analysis of the pooled data shows CT-estimated BMD to be a strong independent predictor of CT-estimated strength. Grouping by individual metastatic bone type shows that the association was stronger for osteolytic and osteosclerotic bone lesions but weaker for mixed lesions, highlighting the uncertainty in predicting the strength for this type of bone lesion. Surprisingly, the weakest association was observed for the NOL vertebrae, suggesting that vertebral bone in vertebrae without radiographic evidence of bone lesions should not be perceived as free of disease in cancer patients.
FIGURE 7
FIGURE 7
Effect of simulated daily tasks on the change in vertebral compressive. (A) Nautral standing, (B) standing while holding a weight (elbows flexed 90° with 5 kg in each hand), (C) 40° trunk flexion while holding 5 kg in each hand, and (D) 20° trunk lateral bending to the right with 5 kg in the right hand. Each subject-specific model was adjusted for height, weight, and spine curvature. The boxplot central line indicates the median; the box top and bottom boundaries indicate 25th and 75th percentiles, with whisker lines representing a 95% confidence interval. The dotted lines represent the 5th percentile (green), median, 50%, (black), and 95th percentile (purple) of the computed LSR values for each activity modeled using the data obtained for the Framingham cohort (Mokhtarzadeh et al., 2021).
FIGURE 8
FIGURE 8
Bone lesion type significantly affected the spine’s LSR for each activity, yielding higher LSRs for osteolytic and NOL vertebrae under simulated natural standing and lateral bending with weight and for osteolytic vertebrae under natural standing with weight compared with the Framingham cohort median (50%) LSRs. Vertebrae with osteosclerotic bone lesions showed lower LSRs for each of the modeled activities than the Framingham cohort median (50%) LSRs, with vertebrae classified as mixed lesions showing similar trends. The boxplot central line indicates the median; the box top and bottom boundaries indicate 25th and 75th percentiles, with whisker lines representing a 95% confidence interval. Dotted lines represent median (50%) LSR 5, and 5th and 95th percentiles derived for each activity examined from the data obtained for the Framingham cohort (Mokhtarzadeh et al., 2021).

References

    1. Adams M., Hutton W. (1980). The Effect of Posture on the Role of the Apophysial Joints in Resisting Intervertebral Compressive Forces. J. Bone Jt. Surg. Br. 62 (3), 358–362. 10.1302/0301-620x.62b3.6447702 - DOI - PubMed
    1. Aebi M. (2003). Spinal Metastasis in the Elderly. Eur. Spine J. 12, S202–S213. 10.1007/s00586-003-0609-9 - DOI - PMC - PubMed
    1. Alkalay R. N., Groff M. W., Stadelmann M. A., Buck F. M., Hoppe S., Theumann N., et al. (2022). Improved Estimates of Strength and Stiffness in Pathologic Vertebrae with Bone Metastases Using CT-derived Bone Density Compared with Radiographic Bone Lesion Quality Classification. J. Neurosurg. Spine 36, 113–124. 10.3171/2021.2.SPINE202027 - DOI - PMC - PubMed
    1. Alkalay R. N. (2015). Effect of the Metastatic Defect on the Structural Response and Failure Process of Human Vertebrae: An Experimental Study. Clin. Biomech. 30 (2), 121–128. 10.1016/j.clinbiomech.2014.10.001 - DOI - PMC - PubMed
    1. Anderson D. E., D'Agostino J. M., Bruno A. G., Manoharan R. K., Bouxsein M. L. (2012). Regressions for Estimating Muscle Parameters in the Thoracic and Lumbar Trunk for Use in Musculoskeletal Modeling. J. Biomech. 45 (1), 66–75. 10.1016/j.jbiomech.2011.10.004 - DOI - PMC - PubMed