. 2022 Aug 4:13:943613.
doi: 10.3389/fpsyg.2022.943613. eCollection 2022.

The multiple indicator multiple cause model for cognitive neuroscience: An analytic tool which emphasizes the behavior in brain-behavior relationships

Affiliations

The multiple indicator multiple cause model for cognitive neuroscience: An analytic tool which emphasizes the behavior in brain-behavior relationships

Adon F G Rosen et al. Front Psychol. .

Abstract

Cognitive neuroscience has inspired a number of methodological advances to extract the highest signal-to-noise ratio from neuroimaging data. Popular techniques used to summarize behavioral data include sum-scores and item response theory (IRT). While these techniques can be useful when applied appropriately, item dimensionality and the quality of information are often left unexplored allowing poor performing items to be included in an itemset. The purpose of this study is to highlight how the application of two-stage approaches introduces parameter bias, differential item functioning (DIF) can manifest in cognitive neuroscience data and how techniques such as the multiple indicator multiple cause (MIMIC) model can identify and remove items with DIF and model these data with greater sensitivity for brain-behavior relationships. This was performed using a simulation and an empirical study. The simulation explores parameter bias across two separate techniques used to summarize behavioral data: sum-scores and IRT and formative relationships with those estimated from a MIMIC model. In an empirical study participants performed an emotional identification task while concurrent electroencephalogram data were acquired across 384 trials. Participants were asked to identify the emotion presented by a static face of a child across four categories: happy, neutral, discomfort, and distress. The primary outcomes of interest were P200 event-related potential (ERP) amplitude and latency within each emotion category. Instances of DIF related to correct emotion identification were explored with respect to an individual's neurophysiology; specifically an item's difficulty and discrimination were explored with respect to an individual's average P200 amplitude and latency using a MIMIC model. The MIMIC model's sensitivity was then compared to popular two-stage approaches for cognitive performance summary scores, including sum-scores and an IRT model framework and then regressing these onto the ERP characteristics. Here sensitivity refers to the magnitude and significance of coefficients relating the brain to these behavioral outcomes. The first set of analyses displayed instances of DIF within all four emotions which were then removed from all further models. The next set of analyses compared the two-stage approaches with the MIMIC model. Only the MIMIC model identified any significant brain-behavior relationships. Taken together, these results indicate that item performance can be gleaned from subject-specific biomarkers, and that techniques such as the MIMIC model may be useful tools to derive complex item-level brain-behavior relationships.

Keywords: cognitive neurosciences; power; sensitivity; structural equation modeling; systems of equations.


Conflict of interest statement

The authors declare that the research was conducted in the absence of any commercial or financial relationships that could be construed as a potential conflict of interest.

Figures

Figure 1
Figure 1
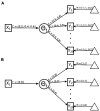
Graphical representation of a multiple indicator multiple cause (MIMIC) model and MIMIC models exploring differential item functioning (DIF). (A) Displayed is the MIMIC model which is composed of a formative (causal) and a reflexive (measurement) model. (B) Displays the mechanism used to assess for uniform DIF, notably the mediator is the latent variable which is believed to be the mechanism linking the causal and indicator variables. When the gamma path is not fully mediated then uniform DIF is present. (C) Displays the mechanisms used to assess nonuniform DIF, notably, when the relationship between the latent variable and an individual indicator varies as a function of the causal variable nonuniform DIF is present.
Figure 2
Figure 2
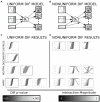
Manipulation of MIMIC model for simulation component. (A) Details all possible values that can be sampled from within a single population model. These values include the relationship of the causal model indicated by 𝚪, the strength of the indicator variables indicated by 𝝠, and the intercept values indicated by 𝝡. (B) Details one example permutation with 𝚪 = 0.6, the odd 𝝠 = 0.8, the even 𝝠 = 0.4, and the 𝝡 is selected between 0:2 with a uniform distribution.
Figure 3
Figure 3
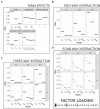
Results from ANOVA comparing bias in parameter estimates. (A) Displays the main effects from all variables included in the ANOVA model, panels are faceted by the variable, and the x-axis details the levels within each factor. (B) Displays the two-way interaction with the largest eta squared between the method used to summarize the behavior scores (model) and the magnitude of the true formative relationship, results suggest near equivalent performance when a weak formative relationship is present across the models, but as the relationship increases the MIMIC model’s bias remains much lower compared to that of the sum-score and item response theory (IRT) model. (C) Displays a three-way interaction with the largest eta squared between the methods used to summarize the behavior scores (model) the magnitude of the true formative relationship, and the range of difficulty of the items results extend the logic of the two-way interaction but emphasize the reduction in bias when the difficulty parameters cover a greater majority of the range of ability estimates present in the data. (D) Displays a four-way interaction with the largest eta squared between the method used to summarize the behavior scores (model), the magnitude of the true formative relationship, the range of the difficulty parameters, and the magnitude of the indicator variable strength.
Figure 4
Figure 4
Results from DIF analyses. (A) Displays the mediation model used to identify all instances of uniform DIF within an emotion. (B) Displays the moderated mediation model used to identify all instances of nonuniform DIF within an emotion. (C) The resulting item characteristic curves (ICC) from all uniform DIF items organized within emotion. The color of the ICC is determined by the individual’s interaction (amplitude by latency) magnitude. The color of the border displays the significance of the direct path from the interaction to an item’s response patterns after controlling for the latent variable. The uniform DIF results in changes in difficulty (intercept) displayed by parallel shifts of the item characteristics curve. (D) The resulting ICC from all nonuniform DIF items organized within emotion. The color of the ICC is determined by the individual’s interaction (amplitude by latency) magnitude. The border displays the significance of the moderation between the individual’s interaction value and the latent trait onto an item’s response patterns after controlling for the latent variable. The nonuniform DIF analyses explore for changes in discrimination (slope), instances where item characteristics are not parallel indicate nonuniform DIF (Proverbio et al., 2006). Facial images reproduced with permission from Proverbio et al. (2006).
Figure 5
Figure 5
Comparison of MIMIC model and two-stage results. (A) Displayed are correlations of iDemo battery summarization which include the two-stage sum-scores, a two-stage IRT, and finally the MIMIC model. (B) Magnitude of formative relationships is plotted (+/− SE), with significant effects distinguished from nonsignificant effects based on the bar’s fill.

References

    1. Bauer D. J. (2017). A more general model for testing measurement invariance and differential item functioning. Psychol. Methods 22, 507–526. doi: 10.1037/met0000077, PMID: - DOI - PMC - PubMed
    1. Baum G. L., Roalf D. R., Cook P. A., Ciric R., Rosen A. F. G., Xia C., et al. . (2018). The impact of in-scanner head motion on structural connectivity derived from diffusion MRI. NeuroImage 173, 275–286. doi: 10.1016/j.neuroimage.2018.02.041, PMID: - DOI - PMC - PubMed
    1. Benjamini Y., Hochberg Y. (1995). Controlling the false discovery rate: A practical and powerful approach to multiple testing. J. R. Stat. Soc., B: Stat. Methodol. 57, 289–300. doi: 10.1111/j.2517-6161.1995.tb02031.x - DOI
    1. Bentin S., Deouell L. Y. (2000). Structural encoding and identification in face processing: Erp evidence for separate mechanisms. Cogn. Neuropsychol. 17, 35–55. doi: 10.1080/026432900380472, PMID: - DOI - PubMed
    1. Bollen K. A. (1989a). “Structural equation models with observed variables,” in Structural Equations With Latent Variables. (Wiley Online Books; ), 80–150.

LinkOut - more resources