

Subject-specific features of excitation/inhibition profiles in neurodegenerative diseases
- PMID: 35992607
- PMCID: PMC9391060
- DOI: 10.3389/fnagi.2022.868342
Subject-specific features of excitation/inhibition profiles in neurodegenerative diseases
Abstract
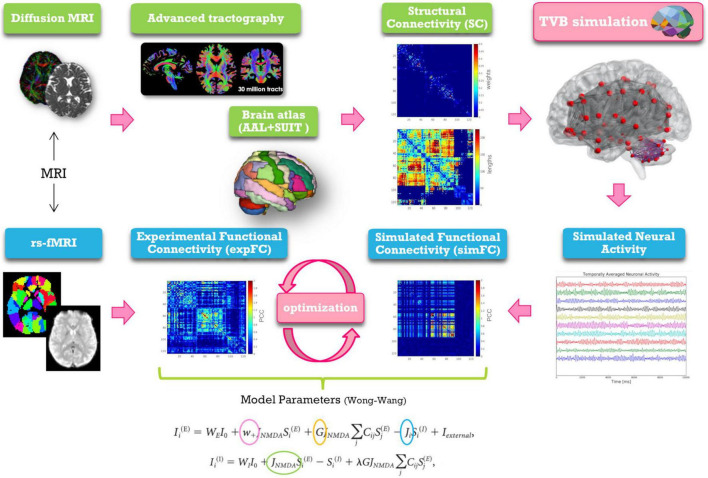
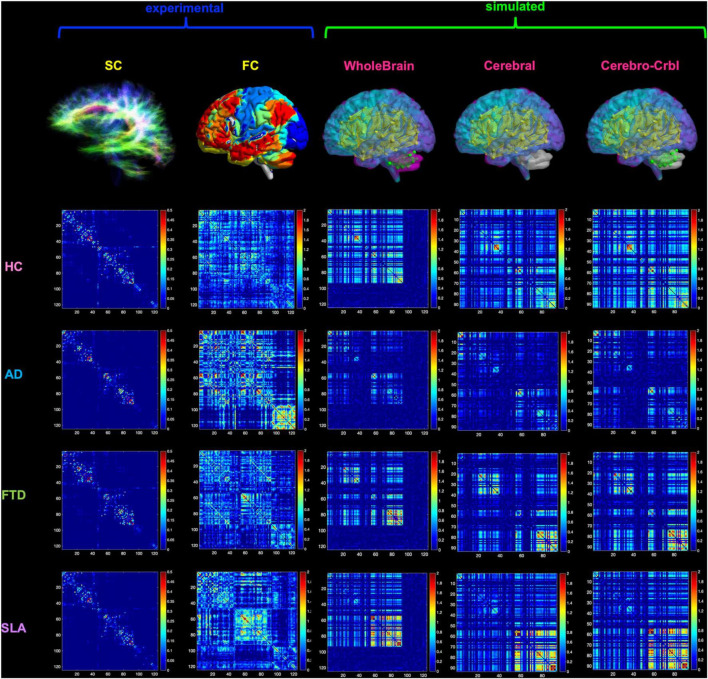
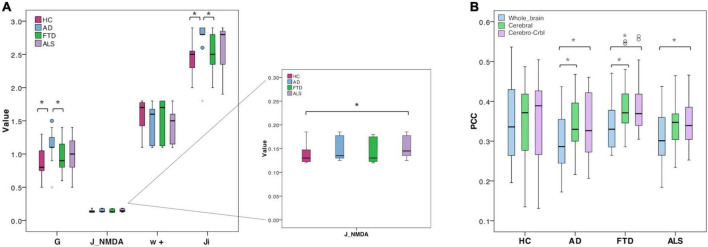
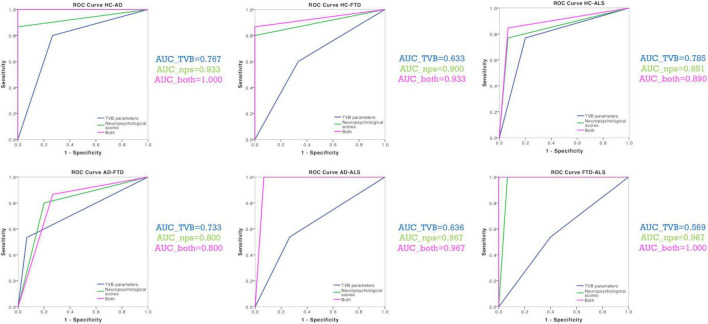
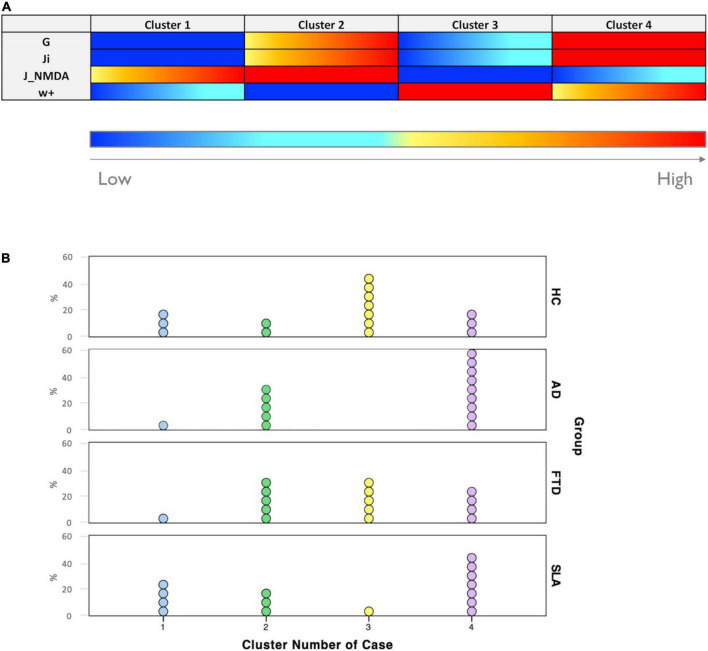
Brain pathologies are characterized by microscopic changes in neurons and synapses that reverberate into large scale networks altering brain dynamics and functional states. An important yet unresolved issue concerns the impact of patients' excitation/inhibition profiles on neurodegenerative diseases including Alzheimer's Disease, Frontotemporal Dementia, and Amyotrophic Lateral Sclerosis. In this work, we used The Virtual Brain (TVB) simulation platform to simulate brain dynamics in healthy and neurodegenerative conditions and to extract information about the excitatory/inhibitory balance in single subjects. The brain structural and functional connectomes were extracted from 3T-MRI (Magnetic Resonance Imaging) scans and TVB nodes were represented by a Wong-Wang neural mass model endowing an explicit representation of the excitatory/inhibitory balance. Simulations were performed including both cerebral and cerebellar nodes and their structural connections to explore cerebellar impact on brain dynamics generation. The potential for clinical translation of TVB derived biophysical parameters was assessed by exploring their association with patients' cognitive performance and testing their discriminative power between clinical conditions. Our results showed that TVB biophysical parameters differed between clinical phenotypes, predicting higher global coupling and inhibition in Alzheimer's Disease and stronger N-methyl-D-aspartate (NMDA) receptor-dependent excitation in Amyotrophic Lateral Sclerosis. These physio-pathological parameters allowed us to perform an advanced analysis of patients' conditions. In backward regressions, TVB-derived parameters significantly contributed to explain the variation of neuropsychological scores and, in discriminant analysis, the combination of TVB parameters and neuropsychological scores significantly improved the discriminative power between clinical conditions. Moreover, cluster analysis provided a unique description of the excitatory/inhibitory balance in individual patients. Importantly, the integration of cerebro-cerebellar loops in simulations improved TVB predictive power, i.e., the correlation between experimental and simulated functional connectivity in all pathological conditions supporting the cerebellar role in brain function disrupted by neurodegeneration. Overall, TVB simulations reveal differences in the excitatory/inhibitory balance of individual patients that, combined with cognitive assessment, can promote the personalized diagnosis and therapy of neurodegenerative diseases.
Keywords: Alzheimer’s Disease; Amyotrophic Lateral Sclerosis; Frontotemporal Dementia; MRI; brain dynamics; connectivity; excitatory/inhibitory balance.
Copyright © 2022 Monteverdi, Palesi, Costa, Vitali, Pichiecchio, Cotta Ramusino, Bernini, Jirsa, Gandini Wheeler-Kingshott and D’Angelo.
Conflict of interest statement
The authors declare that the research was conducted in the absence of any commercial or financial relationships that could be construed as a potential conflict of interest.
Figures
Similar articles
-
Virtual brain simulations reveal network-specific parameters in neurodegenerative dementias.Front Aging Neurosci. 2023 Jul 28;15:1204134. doi: 10.3389/fnagi.2023.1204134. eCollection 2023. Front Aging Neurosci. 2023. PMID: 37577354 Free PMC article.
-
The Importance of Cerebellar Connectivity on Simulated Brain Dynamics.Front Cell Neurosci. 2020 Jul 31;14:240. doi: 10.3389/fncel.2020.00240. eCollection 2020. Front Cell Neurosci. 2020. PMID: 32848628 Free PMC article.
-
Linking Molecular Pathways and Large-Scale Computational Modeling to Assess Candidate Disease Mechanisms and Pharmacodynamics in Alzheimer's Disease.Front Comput Neurosci. 2019 Aug 13;13:54. doi: 10.3389/fncom.2019.00054. eCollection 2019. Front Comput Neurosci. 2019. PMID: 31456676 Free PMC article.
-
Protein synthesis modulation as a therapeutic approach for amyotrophic lateral sclerosis and frontotemporal dementia.Neural Regen Res. 2022 Jul;17(7):1423-1430. doi: 10.4103/1673-5374.330593. Neural Regen Res. 2022. PMID: 34916412 Free PMC article. Review.
-
Neurodegeneration of brain networks in the amyotrophic lateral sclerosis-frontotemporal lobar degeneration (ALS-FTLD) continuum: evidence from MRI and MEG studies.CNS Spectr. 2018 Dec;23(6):378-387. doi: 10.1017/S109285291700075X. Epub 2017 Oct 27. CNS Spectr. 2018. PMID: 29076800 Review.
Cited by
-
New clues for the role of cerebellum in schizophrenia and the associated cognitive impairment.Front Cell Neurosci. 2024 May 10;18:1386583. doi: 10.3389/fncel.2024.1386583. eCollection 2024. Front Cell Neurosci. 2024. PMID: 38799988 Free PMC article. Review.
-
Event-related potential markers of subjective cognitive decline and mild cognitive impairment during a sustained visuo-attentive task.Neuroimage Clin. 2025;45:103760. doi: 10.1016/j.nicl.2025.103760. Epub 2025 Feb 25. Neuroimage Clin. 2025. PMID: 40023055 Free PMC article.
-
Amyotrophic Lateral Sclerosis: Recent Considerations for Diagnosis, Pathogenesis and Therapy.Brain Sci. 2025 May 13;15(5):498. doi: 10.3390/brainsci15050498. Brain Sci. 2025. PMID: 40426669 Free PMC article.
-
UPDATE trial: investigating the effects of ultra-processed versus minimally processed diets following UK dietary guidance on health outcomes: a protocol for an 8-week community-based cross-over randomised controlled trial in people with overweight or obesity, followed by a 6-month behavioural intervention.BMJ Open. 2024 Mar 11;14(3):e079027. doi: 10.1136/bmjopen-2023-079027. BMJ Open. 2024. PMID: 38471681 Free PMC article.
-
A multi-layer mean-field model of the cerebellum embedding microstructure and population-specific dynamics.PLoS Comput Biol. 2023 Sep 1;19(9):e1011434. doi: 10.1371/journal.pcbi.1011434. eCollection 2023 Sep. PLoS Comput Biol. 2023. PMID: 37656758 Free PMC article.
References
-
- Ades-Aron B., Lemberskiy G., Veraart J., Golfinos J., Fieremans E., Novikov D. S., et al. (2020). Improved task-based functional MRI language mapping in patients with brain tumors through marchenko-pastur principal component analysis denoising. Radiology 298 365–373. 10.1148/RADIOL.2020200822 - DOI - PMC - PubMed
LinkOut - more resources
Full Text Sources