

A novel m7G-related lncRNA risk model for predicting prognosis and evaluating the tumor immune microenvironment in colon carcinoma
- PMID: 35992788
- PMCID: PMC9386370
- DOI: 10.3389/fonc.2022.934928
A novel m7G-related lncRNA risk model for predicting prognosis and evaluating the tumor immune microenvironment in colon carcinoma
Abstract
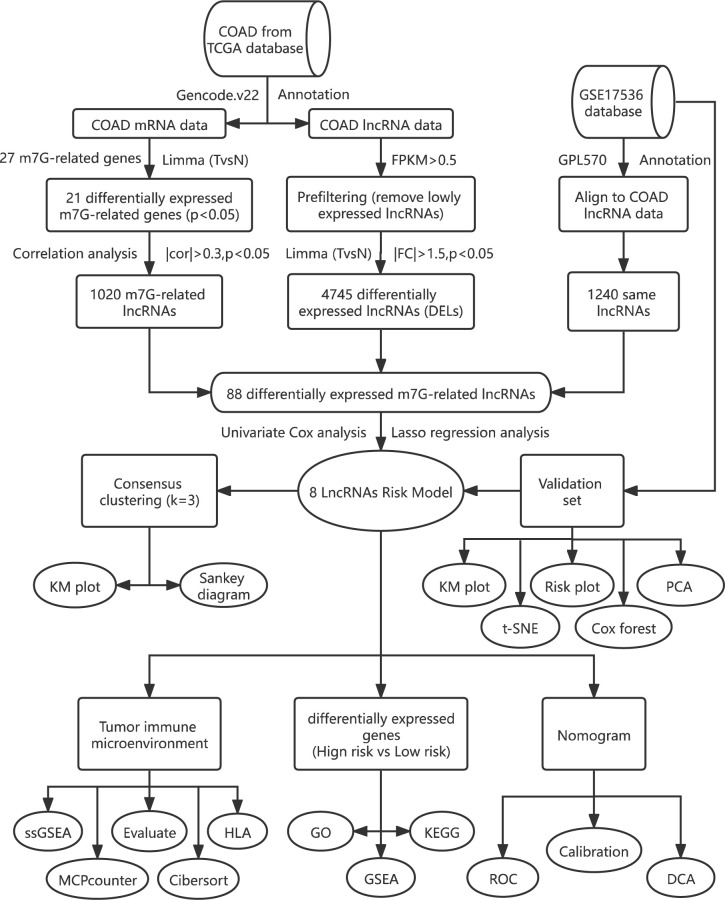
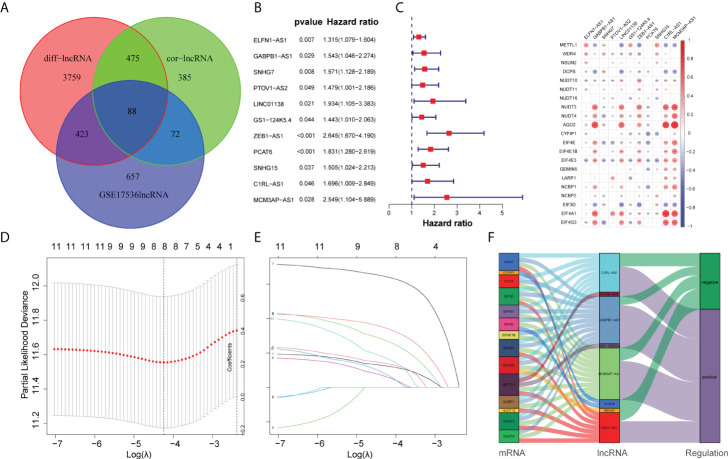
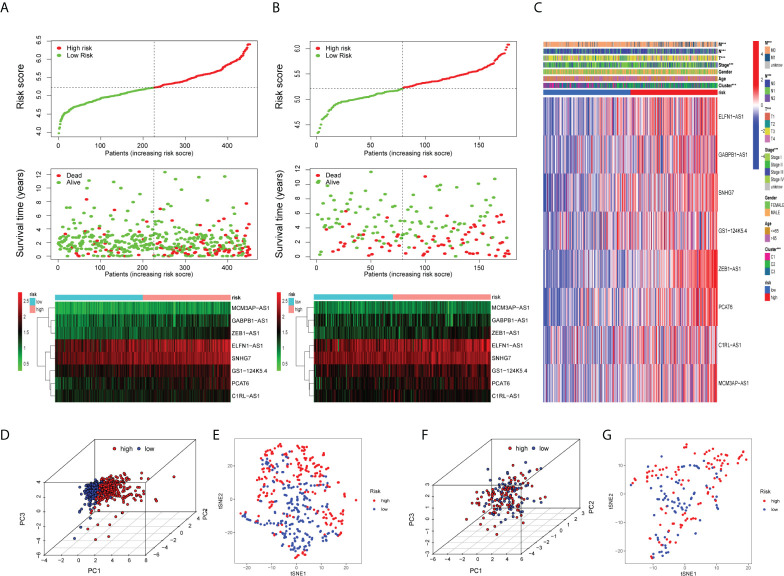
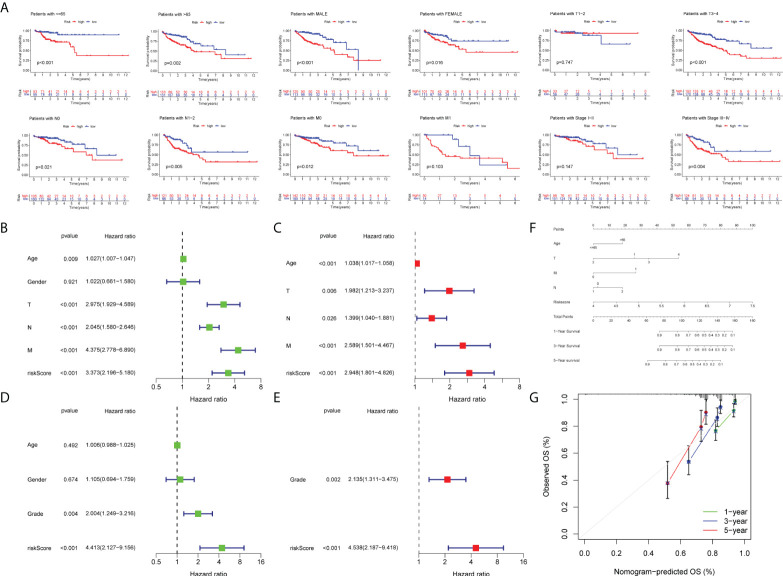
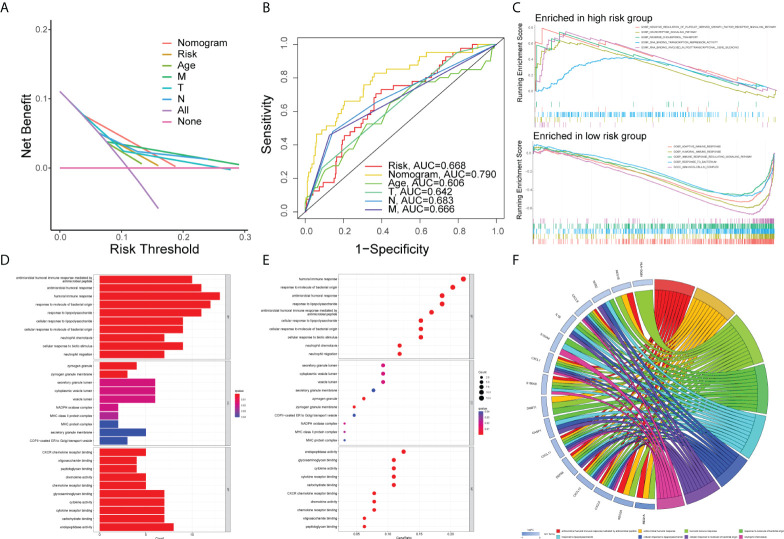
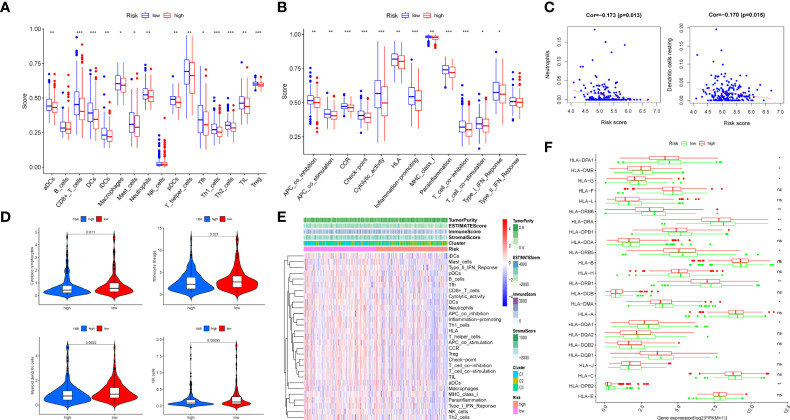
N7-Methylguanosine (m7G) modifications are a common type of posttranscriptional RNA modifications. Its function in the tumor microenvironment (TME) has garnered widespread focus in the past few years. Long non-coding RNAs (lncRNAs) played an essential part in tumor development and are closely associated with the tumor immune microenvironment. In this study, we employed a comprehensive bioinformatics approach to develop an m7G-associated lncRNA prognostic model based on the colon adenocarcinoma (COAD) database from The Cancer Genome Atlas (TCGA) database. Pearson's correlation analysis was performed to identify m7G-related lncRNAs. Differential gene expression analysis was used to screen lncRNAs. Then, we gained 88 differentially expressed m7G-related lncRNAs. Univariate Cox analysis and Lasso regression analysis were performed to build an eight-m7G-related-lncRNA (ELFN1-AS1, GABPB1-AS1, SNHG7, GS1-124K5.4, ZEB1-AS1, PCAT6, C1RL-AS1, MCM3AP-AS1) risk model. Consensus clustering analysis was applied to identify the m7G-related lncRNA subtypes. We also verified the risk prediction effect of a gene signature in the GSE17536 test set (177 patients). A nomogram was constructed to predict overall survival rates. Furthermore, we analyzed differentially expressed genes (DEGs) between high-risk and low-risk groups. Gene Ontology (GO) analysis and Kyoto Encyclopedia of Genes and Genomes (KEGG) pathway enrichment analysis were conducted with the analyzed DEGs. At last, single-sample gene set enrichment analysis (ssGSEA), CIBERSORT, MCP-COUNTER, and Estimation of STromal and Immune cells in MAlignant Tumor tissues using Expression data (ESTIMATE) algorithms were utilized to discover the relationship between the risk model and the TME. Consequently, the m7G-related lncRNA risk model for COAD patients could be a viable prognostic tool and treatment target.
Keywords: N7-methylguanosine(m7G); colon carcinoma; long noncoding RNA(LncRNA); risk model; tumor immune microenvironment.
Copyright © 2022 Yang, Zhou, Chen, Sun, Zhang, Feng, Wang and Sun.
Conflict of interest statement
The authors declare that the research was conducted in the absence of any commercial or financial relationships that could be construed as a potential conflict of interest.
Figures


Similar articles
-
Construction and validation of a prognostic signature for mucinous colonic adenocarcinoma based on N7-methylguanosine-related long non-coding RNAs.J Gastrointest Oncol. 2024 Feb 29;15(1):203-219. doi: 10.21037/jgo-23-980. Epub 2024 Feb 28. J Gastrointest Oncol. 2024. PMID: 38482248 Free PMC article.
-
M7G-Related lncRNAs predict prognosis and regulate the immune microenvironment in lung squamous cell carcinoma.BMC Cancer. 2022 Nov 4;22(1):1132. doi: 10.1186/s12885-022-10232-z. BMC Cancer. 2022. PMID: 36333719 Free PMC article.
-
Construction of prognostic signature of breast cancer based on N7-Methylguanosine-Related LncRNAs and prediction of immune response.Front Genet. 2022 Oct 24;13:991162. doi: 10.3389/fgene.2022.991162. eCollection 2022. Front Genet. 2022. PMID: 36353118 Free PMC article.
-
M7G-related tumor immunity: novel insights of RNA modification and potential therapeutic targets.Int J Biol Sci. 2024 Jan 27;20(4):1238-1255. doi: 10.7150/ijbs.90382. eCollection 2024. Int J Biol Sci. 2024. PMID: 38385078 Free PMC article. Review.
-
Biological roles of RNA m7G modification and its implications in cancer.Biol Direct. 2023 Sep 14;18(1):58. doi: 10.1186/s13062-023-00414-5. Biol Direct. 2023. PMID: 37710294 Free PMC article. Review.
Cited by
-
Long non-coding RNA C1RL-AS1 aggravates influenza A virus pneumonia through miR-16-5p/LAMP3.Virus Genes. 2025 Apr;61(2):145-152. doi: 10.1007/s11262-024-02131-1. Epub 2025 Jan 2. Virus Genes. 2025. PMID: 39747803
-
Construction and validation of a prognostic signature for mucinous colonic adenocarcinoma based on N7-methylguanosine-related long non-coding RNAs.J Gastrointest Oncol. 2024 Feb 29;15(1):203-219. doi: 10.21037/jgo-23-980. Epub 2024 Feb 28. J Gastrointest Oncol. 2024. PMID: 38482248 Free PMC article.
-
The complex nature of lncRNA-mediated chromatin dynamics in multiple myeloma.Front Oncol. 2023 Dec 11;13:1303677. doi: 10.3389/fonc.2023.1303677. eCollection 2023. Front Oncol. 2023. PMID: 38148842 Free PMC article. Review.
-
A Novel m7G-Related Genes-Based Signature with Prognostic Value and Predictive Ability to Select Patients Responsive to Personalized Treatment Strategies in Bladder Cancer.Cancers (Basel). 2022 Oct 29;14(21):5346. doi: 10.3390/cancers14215346. Cancers (Basel). 2022. PMID: 36358764 Free PMC article.
-
Identification of m7G-Related LncRNA Signature for Predicting Prognosis and Evaluating Tumor Immune Infiltration in Pancreatic Adenocarcinoma.Diagnostics (Basel). 2023 May 11;13(10):1697. doi: 10.3390/diagnostics13101697. Diagnostics (Basel). 2023. PMID: 37238181 Free PMC article.
References
LinkOut - more resources
Full Text Sources
Miscellaneous