

Iron accumulation typifies renal cell carcinoma tumorigenesis but abates with pathological progression, sarcomatoid dedifferentiation, and metastasis
- PMID: 35992801
- PMCID: PMC9389085
- DOI: 10.3389/fonc.2022.923043
Iron accumulation typifies renal cell carcinoma tumorigenesis but abates with pathological progression, sarcomatoid dedifferentiation, and metastasis
Abstract
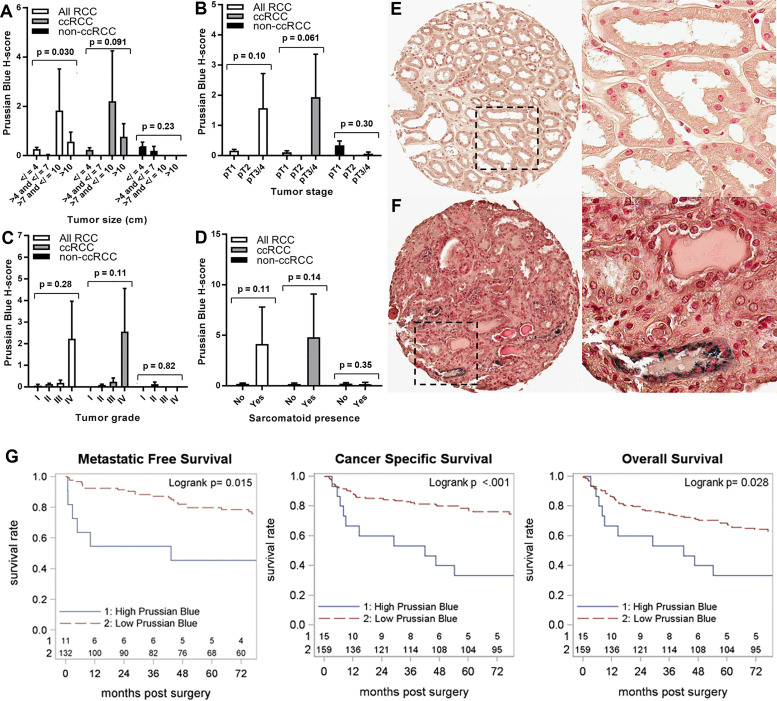
Iron is a potent catalyst of oxidative stress and cellular proliferation implicated in renal cell carcinoma (RCC) tumorigenesis, yet it also drives ferroptosis that suppresses cancer progression and represents a novel therapeutic target for advanced RCC. The von Hippel Lindau (VHL)/hypoxia-inducible factor-α (HIF-α) axis is a major regulator of cellular iron, and its inactivation underlying most clear cell (cc) RCC tumors introduces both iron dependency and ferroptosis susceptibility. Despite the central role for iron in VHL/HIF-α signaling and ferroptosis, RCC iron levels and their dynamics during RCC initiation/progression are poorly defined. Here, we conducted a large-scale investigation into the incidence and prognostic significance of total tissue iron in ccRCC and non-ccRCC patient primary tumor cancer cells, tumor microenvironment (TME), metastases and non-neoplastic kidneys. Prussian Blue staining was performed to detect non-heme iron accumulation in over 1600 needle-core sections across multiple tissue microarrays. We found that RCC had significantly higher iron staining scores compared with other solid cancers and, on average, >40 times higher than adjacent renal epithelium. RCC cell iron levels correlated positively with TME iron levels and inversely with RCC levels of the main iron uptake protein, transferrin receptor 1 (TfR1/TFRC/CD71). Intriguingly, RCC iron levels, including in the TME, decreased significantly with pathologic (size/stage/grade) progression, sarcomatoid dedifferentiation, and metastasis, particularly among patients with ccRCC, despite increasing TfR1 levels, consistent with an increasingly iron-deficient tumor state. Opposite to tumor iron changes, adjacent renal epithelial iron increased significantly with RCC/ccRCC progression, sarcomatoid dedifferentiation, and metastasis. Lower tumor iron and higher renal epithelial iron each predicted significantly shorter ccRCC patient metastasis-free survival. In conclusion, iron accumulation typifies RCC tumors but declines toward a relative iron-deficient tumor state during progression to metastasis, despite precisely opposite dynamics in adjacent renal epithelium. These findings raise questions regarding the historically presumed selective advantage for high iron during all phases of cancer evolution, suggesting instead distinct tissue-specific roles during RCC carcinogenesis and early tumorigenesis versus later progression. Future study is warranted to determine how the relative iron deficiency of advanced RCC contributes to ferroptosis resistance and/or introduces a heightened susceptibility to iron deprivation that might be therapeutically exploitable.
Keywords: Prussian Blue; clear cell; ferroptosis; iron; metastasis; renal cell carcinoma.
Copyright © 2022 Greene, Attwood, Sharma, Balderman, Deng, Muhitch, Smith, Gross, Xu and Kauffman.
Conflict of interest statement
The authors declare that the research was conducted in the absence of any commercial or financial relationships that could be construed as a potential conflict of interest.
Figures


Similar articles
-
Transferrin receptor 1 upregulation in primary tumor and downregulation in benign kidney is associated with progression and mortality in renal cell carcinoma patients.Oncotarget. 2017 Nov 6;8(63):107052-107075. doi: 10.18632/oncotarget.22323. eCollection 2017 Dec 5. Oncotarget. 2017. PMID: 29291011 Free PMC article.
-
Identification and validation of novel prognostic markers in Renal Cell Carcinoma.Dan Med J. 2017 Oct;64(10):B5339. Dan Med J. 2017. PMID: 28975890
-
Ferroptosis-associated genes and compounds in renal cell carcinoma.Front Immunol. 2024 Sep 27;15:1473203. doi: 10.3389/fimmu.2024.1473203. eCollection 2024. Front Immunol. 2024. PMID: 39399506 Free PMC article. Review.
-
Prolyl hydroxylase 2 dependent and Von-Hippel-Lindau independent degradation of Hypoxia-inducible factor 1 and 2 alpha by selenium in clear cell renal cell carcinoma leads to tumor growth inhibition.BMC Cancer. 2012 Jul 17;12:293. doi: 10.1186/1471-2407-12-293. BMC Cancer. 2012. PMID: 22804960 Free PMC article.
-
Significance of PI3K signalling pathway in clear cell renal cell carcinoma in relation to VHL and HIF status.J Clin Pathol. 2021 Apr;74(4):216-222. doi: 10.1136/jclinpath-2020-206693. Epub 2020 May 28. J Clin Pathol. 2021. PMID: 32467322 Review.
Cited by
-
Immunometabolism of ferroptosis in the tumor microenvironment.Front Oncol. 2024 Aug 12;14:1441338. doi: 10.3389/fonc.2024.1441338. eCollection 2024. Front Oncol. 2024. PMID: 39188677 Free PMC article. Review.
-
Micronutrients and risks of three main urologic cancers: A mendelian randomization study.Front Nutr. 2023 Feb 27;10:1016243. doi: 10.3389/fnut.2023.1016243. eCollection 2023. Front Nutr. 2023. PMID: 36923697 Free PMC article.
-
Comprehensive tumor-immune profiling reveals mediators of paradoxical immune sensitivity in sarcomatoid renal cell carcinoma.Cancer Cell. 2025 Jul 23:S1535-6108(25)00316-2. doi: 10.1016/j.ccell.2025.07.010. Online ahead of print. Cancer Cell. 2025. PMID: 40780212
-
Causality of genetically predicted solid cancers on risk of sepsis: insights from Mendelian randomization.Discov Oncol. 2025 Jun 9;16(1):1043. doi: 10.1007/s12672-025-02848-x. Discov Oncol. 2025. PMID: 40490626 Free PMC article.
-
Targeting ferroptosis in renal cell carcinoma: Potential mechanisms and novel therapeutics.Heliyon. 2023 Jul 21;9(8):e18504. doi: 10.1016/j.heliyon.2023.e18504. eCollection 2023 Aug. Heliyon. 2023. PMID: 37554789 Free PMC article. Review.
References
LinkOut - more resources
Full Text Sources
Miscellaneous