

Amyloid pathology induces dysfunction of systemic neurotransmission in aged APPswe/PS2 mice
- PMID: 35992913
- PMCID: PMC9389227
- DOI: 10.3389/fnins.2022.930613
Amyloid pathology induces dysfunction of systemic neurotransmission in aged APPswe/PS2 mice
Erratum in
-
Corrigendum: Amyloid pathology induces dysfunction of systemic neurotransmission in aged APPswe/PS2 mice.Front Neurosci. 2022 Oct 17;16:1014128. doi: 10.3389/fnins.2022.1014128. eCollection 2022. Front Neurosci. 2022. PMID: 36325483 Free PMC article.
Abstract
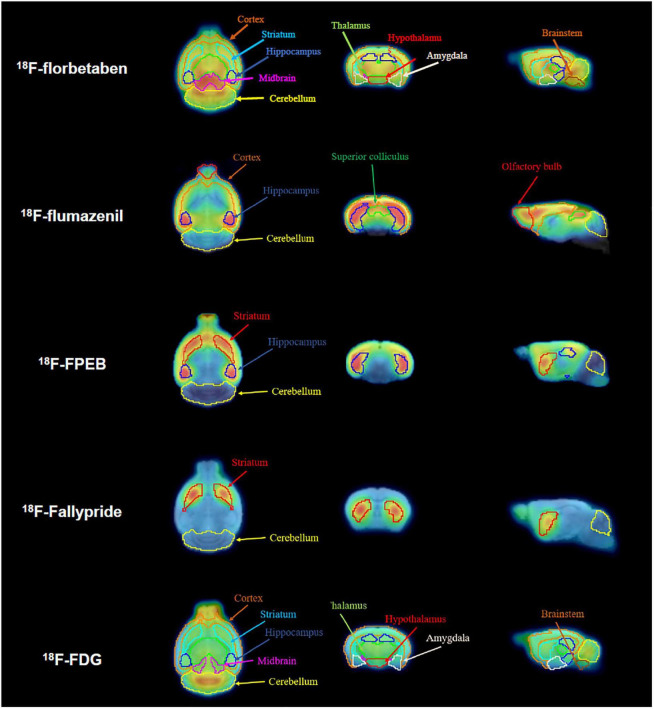
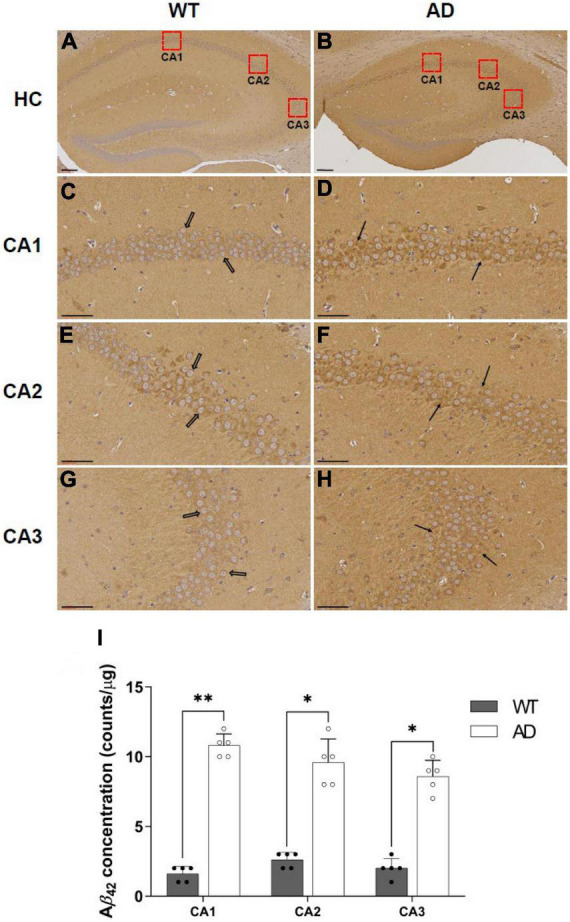
This study aimed to investigate how amyloid pathology affects the functional aspects of neurotransmitter systems in Alzheimer's disease. APPswe/PS2 mice (21 months of age) and wild-type (WT) mice underwent positron emission tomography (PET) and magnetic resonance spectroscopy (MRS). First, we obtained 18F-FDG and 18F-florbetaben PET scans to evaluate neuronal integrity and amyloid pathology. Second, 18F-FPEB and 18F-FMZ PET data were acquired to assess the excitatory-inhibitory neurotransmission. Third, to monitor the dopamine system, 18F-fallypride PET was performed. Amyloid PET imaging revealed that radioactivity was higher in the AD group than that in the WT group, which was validated by immunohistochemistry. In the cortical and limbic areas, the AD group showed a 25-27% decrease and 14-35% increase in the glutamatergic and GABAergic systems, respectively. The dopaminergic system in the AD group exhibited a 29% decrease in brain uptake compared with that in the WT group. A reduction in glutamate, N-acetylaspartate, and taurine levels was observed in the AD group using MRS. Our results suggest that dysfunction of the neurotransmitter system is associated with AD pathology. Among the systems, the GABAergic system was prominent, implying that the inhibitory neurotransmission system may be the most vulnerable to AD pathology.
Keywords: APPswe/PS2; Alzheimer’s disease; beta amyloid; neurotransmitter; positron emission tomography.
Copyright © 2022 Oh, Lee, Nam, Kang, Han, Lee, Lee and Choi.
Conflict of interest statement
The authors declare that the research was conducted in the absence of any commercial or financial relationships that could be construed as a potential conflict of interest.
Figures


Similar articles
-
Prodromal neuroinflammatory, cholinergic and metabolite dysfunction detected by PET and MRS in the TgF344-AD transgenic rat model of AD: a collaborative multi-modal study.Theranostics. 2021 May 3;11(14):6644-6667. doi: 10.7150/thno.56059. eCollection 2021. Theranostics. 2021. PMID: 34093845 Free PMC article.
-
[18F]-florbetaben PET/CT Imaging in the Alzheimer's Disease Mouse Model APPswe/PS1dE9.Curr Alzheimer Res. 2019;16(1):49-55. doi: 10.2174/1567205015666181022095904. Curr Alzheimer Res. 2019. PMID: 30345916
-
Cross-sectional comparison of small animal [18F]-florbetaben amyloid-PET between transgenic AD mouse models.PLoS One. 2015 Feb 23;10(2):e0116678. doi: 10.1371/journal.pone.0116678. eCollection 2015. PLoS One. 2015. PMID: 25706990 Free PMC article.
-
Positron emission tomography radiopharmaceuticals for imaging brain Beta-amyloid.Semin Nucl Med. 2011 Jul;41(4):283-99. doi: 10.1053/j.semnuclmed.2011.02.005. Semin Nucl Med. 2011. PMID: 21624562 Review.
-
AD molecular: Molecular imaging of Alzheimer's disease: PET imaging of neurotransmitter systems.Prog Mol Biol Transl Sci. 2019;165:139-165. doi: 10.1016/bs.pmbts.2019.04.003. Epub 2019 May 23. Prog Mol Biol Transl Sci. 2019. PMID: 31481161 Review.
Cited by
-
[18F]Flotaza for Aβ Plaque Diagnostic Imaging: Evaluation in Postmortem Human Alzheimer's Disease Brain Hippocampus and PET/CT Imaging in 5xFAD Transgenic Mice.Int J Mol Sci. 2024 Jul 18;25(14):7890. doi: 10.3390/ijms25147890. Int J Mol Sci. 2024. PMID: 39063132 Free PMC article.
-
Neonatal maternal separation causes depressive-like behavior and potentiates memory impairment induced by amyloid-β oligomers in adult mice.Behav Brain Funct. 2025 Mar 20;21(1):8. doi: 10.1186/s12993-025-00266-1. Behav Brain Funct. 2025. PMID: 40114204 Free PMC article.
References
-
- Barnard E. A., Skolnick P., Olsen R. W., Mohler H., Sieghart W., Biggio G., et al. (1998). International Union of Pharmacology. XV. Subtypes of γ-aminobutyric acidA receptors: Classification on the basis of subunit composition, pharmacology, and function. Pharmacol. Rev. 50 291–313. - PubMed
LinkOut - more resources
Full Text Sources