. 2022 Oct 27;190(1):23-40.
doi: 10.1093/toxsci/kfac086.

Gestational Benzo[a]pyrene Exposure Destroys F1 Ovarian Germ Cells Through Mitochondrial Apoptosis Pathway and Diminishes Surviving Oocyte Quality

Affiliations

Gestational Benzo[a]pyrene Exposure Destroys F1 Ovarian Germ Cells Through Mitochondrial Apoptosis Pathway and Diminishes Surviving Oocyte Quality

Kelli F Malott et al. Toxicol Sci. .

Abstract

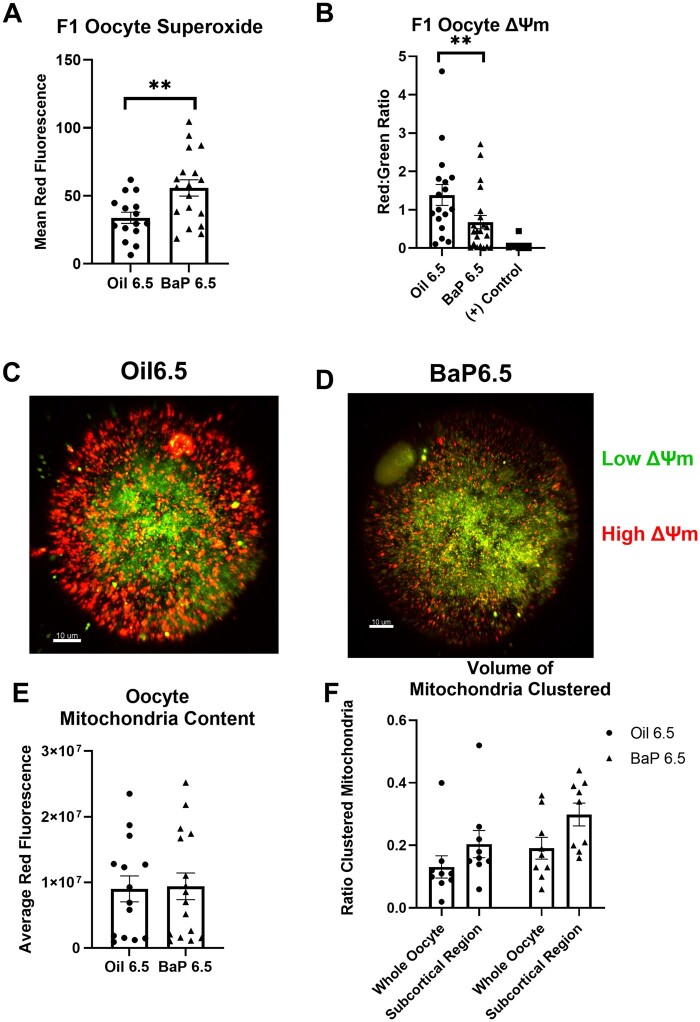
Polycyclic aromatic hydrocarbons, including benzo[a]pyrene (BaP), are products of incomplete combustion. In female mouse embryos primordial germ cells proliferate before and after arriving at the gonadal ridge around embryonic (E) 10 and begin entering meiosis at E13.5. Now oocytes, they arrest in the first meiotic prophase beginning at E17.5. We previously reported dose-dependent depletion of ovarian follicles in female mice exposed to 2 or 10 mg/kg-day BaP E6.5-15.5. We hypothesized that embryonic ovaries are more sensitive to gestational BaP exposure during the mitotic developmental window, and that this exposure results in persistent oxidative stress in ovaries and oocytes of exposed F1 female offspring. We orally dosed timed-pregnant female mice with 0 or 2 mg/kg-day BaP in oil from E6.5-11.5 (mitotic window) or E12.5-17.5 (meiotic window). Cultured E13.5 ovaries were utilized to investigate the mechanism of BaP-induced germ cell death. We observed statistically significant follicle depletion and increased ovarian lipid peroxidation in F1 pubertal ovaries following BaP exposure during either prenatal window. Culture of E13.5 ovaries with BaP induced germ cell DNA damage and release of cytochrome c from the mitochondria in oocytes, confirming that BaP exposure induced apoptosis via the mitochondrial pathway. Mitochondrial membrane potential, oocyte lipid droplet (LD) volume, and mitochondrial-LD colocalization were decreased and mitochondrial superoxide levels were increased in the MII oocytes of F1 females exposed gestationally to BaP. Results demonstrate similar sensitivity to germ cell depletion and persistent oxidative stress in F1 ovaries and oocytes following gestational BaP exposure during mitotic or meiotic windows.

Keywords: benzo[a]pyrene; lipid droplets; mitochondria; oocyte; oxidative stress; polycyclic aromatic hydrocarbons.


Figures

Figure 1.
Figure 1.
A, Experimental design for gestational BaP exposure and assessment of F1 ovarian effects during 2 critical windows of ovarian development. B, Experimental design for in vitro BaP exposure and assessment of induction of mitochondrial apoptosis pathway. C, Experimental design for F1 gestational BaP exposure and assessment of F1-derived MII oocyte oxidative stress and developmental competence. All details of each exposure and endpoint are described in the Materials and Methods. Figure was created with the help of Biorender.com.
Figure 2.
Figure 2.
In vitro BaP exposure concentration-dependently increases ɣH2AX in germ cells of embryonic ovaries A, Total percent ɣH2AX-positive germ cells per E13.5 ovary increased with BaP concentration following exposure for 6 h (N = 3, UC [uncultured]; N = 4, DMSO, 500 ng/ml; N = 5, 1000 ng/ml. p = .002, effect of experimental group by Kruskal-Wallis test. *p ≤ .03, compared to uncultured, #p = .014 and **p = .009, compared with DMSO) B, Percent ɣH2AX-positive oocytes by meiotic stage per E13.5 ovary increased with BaP dose only in interphase and leptotene oocytes following exposure for 6 h (N = 3, UC [uncultured]; N = 4, DMSO, 500 ng/ml: N = 5, 1000 ng/ml. p ≤ .009 by Kruskal-Wallis test, effect of experimental group. *p ≤ .05, compared with uncultured; #p ≤ .05 compared with DMSO) C, Representative images of ɣH2AX immunohistochemistry. Higher magnification images on right show portions of sections in images on left. Asterisk (*) indicates ɣH2AX-positive oocyte, small square (red in online version) indicates interphase oocyte, black arrow in UC indicates leptotene oocyte, red (online version) arrows in 500 and 1000 ng/mL indicate zygotene oocytes, circle indicates pachytene, and # indicates diplotene. (Scale bars, left panel = 200 µm; scale bars, right panel = 50 µm.) Filled triangles, squares, and circles in the graphs represent individual cultured ovaries.
Figure 3.
Figure 3.
In vitro BaP exposure for 6 h had no effect on PUMA protein expression but dose-dependently increased cytochrome c release in exposed ovaries. A, Reciprocal intensity per ovarian section area was estimated in E13.5 ovaries and showed a slight, but not statistically significant, increase in PUMA immunostaining in the whole ovary (N = 6, UC [uncultured]; N = 8, DMSO, 500 ng/ml, 1000 ng/ml). B, Representative images of PUMA immunohistochemistry show ubiquitous and similar expression regardless of exposure. C, Cytochrome C release from the mitochondria in germ cells following BaP exposure was measured using immunofluorescence. Methods for analysis of images to estimate the ratio of oocytes positive for cytochrome c release are detailed in the Materials and Methods. These results show a dose-dependent increase in the ratio of positive oocytes (N = 6, UC; N = 5, DMSO; N = 6, 500 ng/ml; N = 8, 1000 ng/ml. p = .001, effect of experimental group, Kruskal-Wallis test. **p ≤ .008, compared with DMSO or uncultured; #p = .045 compared with DMSO, Mann-Whitney test). D, Representative images of immunofluorescence. Top row shows germ cell-specific nuclear marker GCNA (magenta in online version) and cytochrome c (smaller dots surrounding oocyte nuclei; cyan blue in online version). Second row shows Imaris analysis with GCNA (oocyte nucleus, magenta in online version) and cytochrome c in oocyte cytosol (smaller fluorescent areas; yellow in online version), scale bars = 10 µm. Third row and 4th rows show same as top and second rows, respectively zoomed in, scale bars = 4 µm. Filled triangles, squares, and circles in the graphs represent individual cultured ovaries.
Figure 4.
Figure 4.
Gestational BaP exposure decreased primordial, primary, and secondary follicles in F1 pubertal ovary regardless of exposure window (E6.5–11.5 or E12.5–17.5). Total number of primordial (A), primary (B), and secondary (C) follicles in the F1 ovaries on 1st estrus were significantly decreased following BaP exposure during both developmental windows, but no difference in the total number of antral follicles (C) was observed. (N = 8 F0 dams, Oil 6.5; N = 5 Oil 12.5; N = 9, BaP6.5; N = 10, BaP12.5, ***p < .001, *p < .05, effect of BaP treatment by 2-way ANOVA.) Filled triangles, squares, and circles in the graphs represent data from individual mice.
Figure 5.
Figure 5.
Representative images of ɣH2AX IHC in F1 pubertal ovaries. ɣH2AX is the brown staining. Left panel images taken with a 10× objective. Right panel images of areas shown by rectangles in left images taken with a 40× objective. Black arrows point to positive primordial oocytes, arrowheads point to positive primary oocyte, oval encompasses a negative primordial follicle, # indicates positive secondary follicle and oocyte. (Scale bar, left panel = 500 µm; scale bar, right panel = 50 µm.)
Figure 6.
Figure 6.
Gestational BaP exposure results in persistent oxidative stress in F1 ovaries but has no effect on ovarian neutral lipid content. A, 4-HNE immunostaining intensity estimated per total ovarian section area using reciprocal intensity shows persistently increased lipid peroxidation following gestational exposure regardless of exposure window (N = 4–5 F0 dams, oil treatment; N = 6 F0 dams, BaP treatment, *p < .05, effect of BaP by 2-way ANOVA). B, Representative 4-HNE immunostaining (brown color in online version). C, Quantification of neutral lipid content in ovarian sections stained with BODIPY 493/503 showed no treatment or exposure window-related differences in neutral lipid content. D, Representative images of BODIPY 493/503 sections, counterstained with DAPI. Neutral lipids fluoresce green (online version). Filled circles, squares, and triangles represent data from individual mice.
Figure 7.
Figure 7.
Gestational BaP exposure results in persistent oxidative stress in F1-derived superovulated MII oocytes. A, Mean red fluorescence intensity of MitoSOX demonstrates increased mitochondrial superoxide anion in oocytes of females exposed to BaP during the proliferative developmental window from E6.5–11.5 (N = 9 F0 dams, Oil; N = 8 F0 dams, BaP; **p = .006, effect of BaP by GEE). B, Mitochondrial membrane potential (ΔΨm), measured using JC-1 shows that oocytes of females exposed to gestational BaP during the proliferative, developmental window have reduced ΔΨm compared with oocytes from oil control females. Positive control oocytes were exposed to 1 µM of CCCP (carbonyl cyanide 3-chlorophenylhydrazon), a known mitochondrial uncoupler, which breaks down the ΔΨm (N = 8 F0 dams, Oil; N = 9 F0 dams, BaP; N = 5; positive control; *p = .04, effect of BaP by GEE). (C, D) Representative images of ΔΨm from control (C) and BaP (D) exposed mice (red= high ΔΨm, green= low ΔΨm, colors in online version; scale bar= 10 µm). E, Mitochondrial content of MII oocytes estimated by red fluorescence of Mitotracker Deep Red was not affected by prenatal BaP treatment (p = .17, effect of BaP, ANOVA with oocyte as random effect. F, Ratio of clustered mitochondrial volume in whole oocyte and subcortical region was not affected by prenatal BaP treatment (N = 9 F0 dams/treatment, p > .50, effect of BaP, GEE). Individual data points for (A), (B), (E), and (F) represent measurements from individual oocytes.
Figure 8.
Figure 8.
Gestational BaP exposure significantly decreases oocyte LD content. A, Average volume of a single LD in the whole oocyte and in the subpopulation colocalized with mitochondria, estimated using Imaris imaging software to build 3D volumes from 3D rendered z-stack images, is significantly decreased in oocytes from females exposed to BaP during E6.5–11.5 (N = 9 F0 dams/group, ***p < .001, effect of BaP by GEE). B, Estimation of the percent of mitochondria colocalized with LDs estimated using Imaris to generate 3D volumes. Mitochondrial volumes within 0.5 µm of an LD volume were considered to be colocalized with LDs. Colocalization of mitochondria with LDs is decreased in gestationally exposed oocytes (N = 9 F0 dams/treatment #p = .075, effect of BaP by GEE). Individual data points for (A), (B) represent measurements from individual oocytes. C, Representative images of Mitotracker Deep Red (red in online version) and BODIPY 493/503 (green in online version) co-staining in oocytes (top panel). Representative images of Imaris volume renderings (bottom panel).

Similar articles

Cited by

References

    1. Adhikari D., Lee I., Yuen W. S., Carroll J. (2022). Oocyte mitochondria—Key regulators of oocyte function and potential therapeutic targets for improving fertility. Biol. Reprod. 106, 366–377. - PubMed
    1. Aizawa R., Ibayashi M., Tatsumi T., Yamamoto A., Kokubo T., Miyasaka N., Sato K., Ikeda S., Minami N., Tsukamoto S. (2019). Synthesis and maintenance of lipid droplets are essential for mouse preimplantation embryonic development. Development 146, 1–11. - PubMed
    1. Benador I. Y., Veliova M., Liesa M., Shirihai O. S. (2019). Mitochondria bound to lipid droplets: Where ditochondrial dynamics regulate lipid storage and utilization. Cell Metab. 29, 827–835. - PMC - PubMed
    1. Benador I. Y., Veliova M., Mahdaviani K., Petcherski A., Wikstrom J. D., Assali E. A., Acín-Pérez R., Shum M., Oliveira M. F., Cinti S., et al. (2018). Mitochondria bound to lipid droplets have unique bioenergetics, composition, and dynamics that support lipid droplet expansion. Cell Metab. 27, 869–885. - PMC - PubMed
    1. Bianchi S., Macchiarelli G., Micara G., Linari A., Boninsegna C., Aragona C., Rossi G., Cecconi S., Nottola S. A. (2015). Ultrastructural markers of quality are impaired in human metaphase II aged oocytes: A comparison between reproductive and in vitro aging. J. Assist. Reprod. Genet. 32, 1343–1358. - PMC - PubMed

Publication types