. 2022 Aug 22;18(8):e1010376.
doi: 10.1371/journal.pgen.1010376. eCollection 2022 Aug.

A toolbox for class I HDACs reveals isoform specific roles in gene regulation and protein acetylation

Affiliations

A toolbox for class I HDACs reveals isoform specific roles in gene regulation and protein acetylation

Lena Hess et al. PLoS Genet. .

Abstract

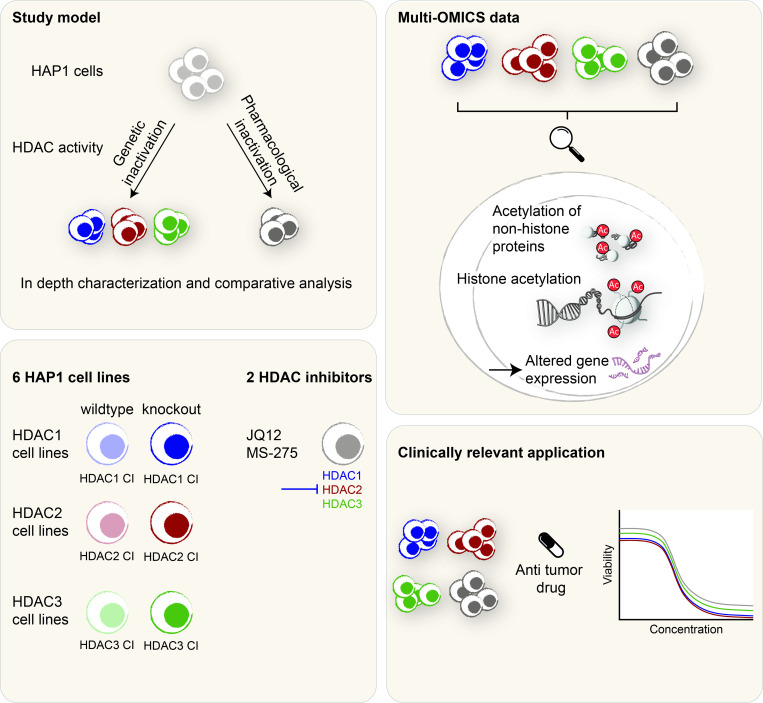
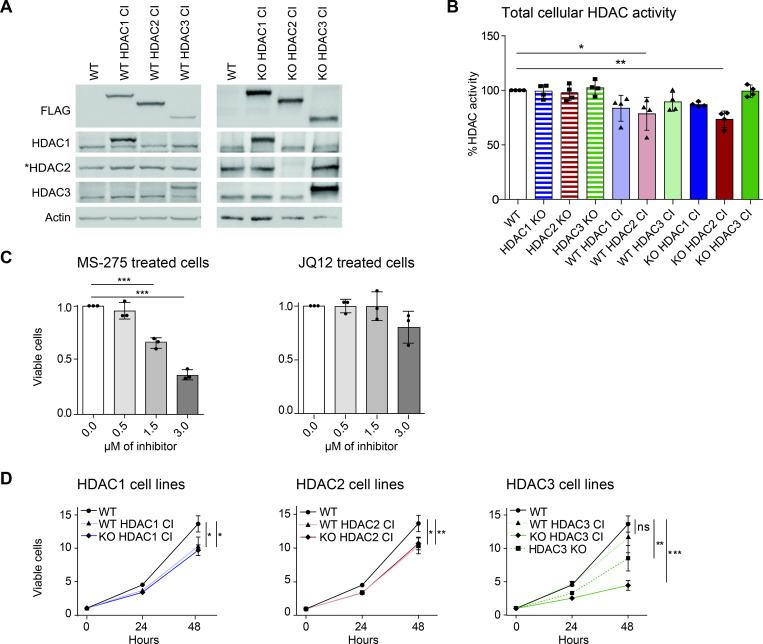
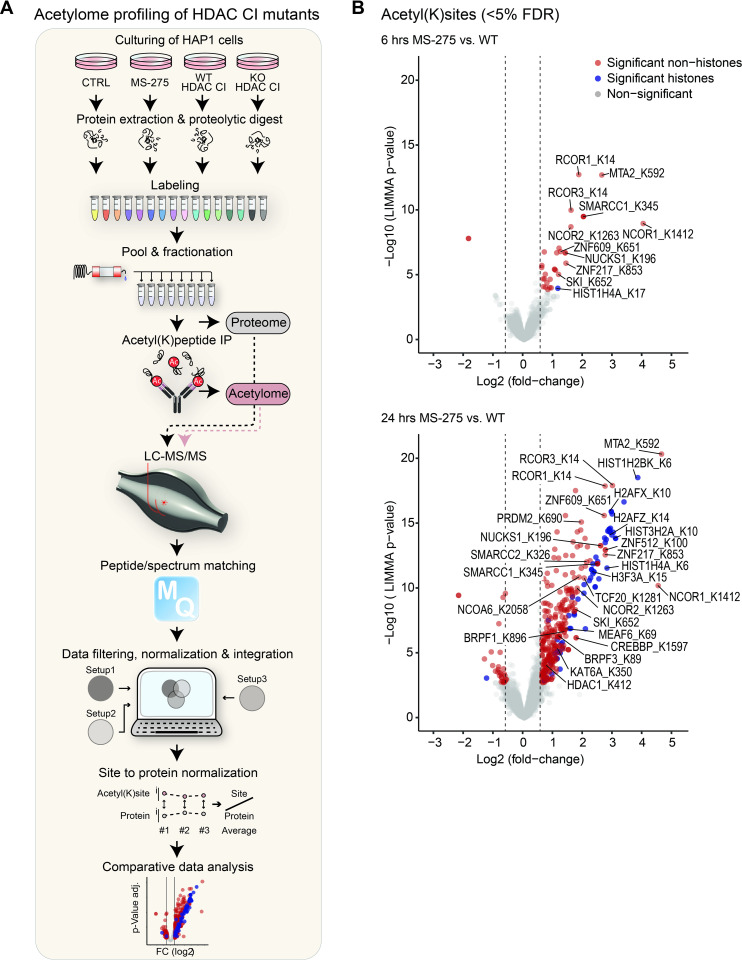
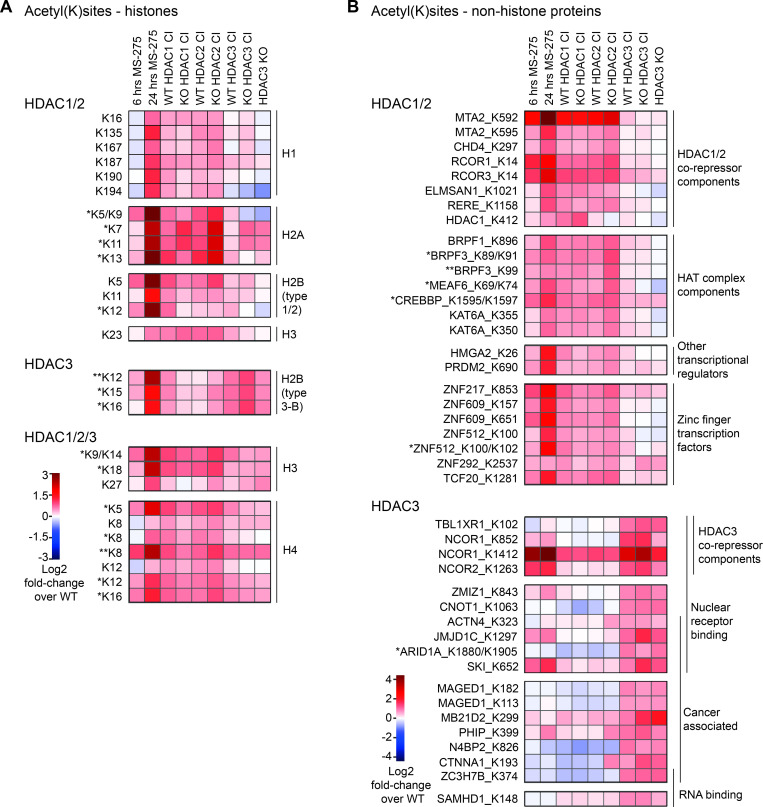
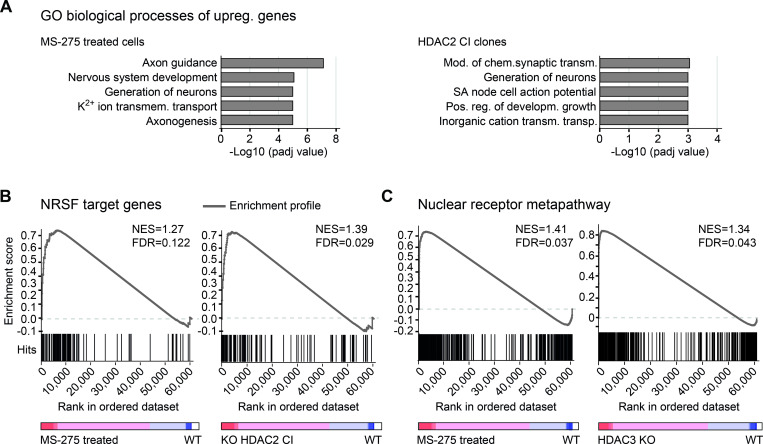
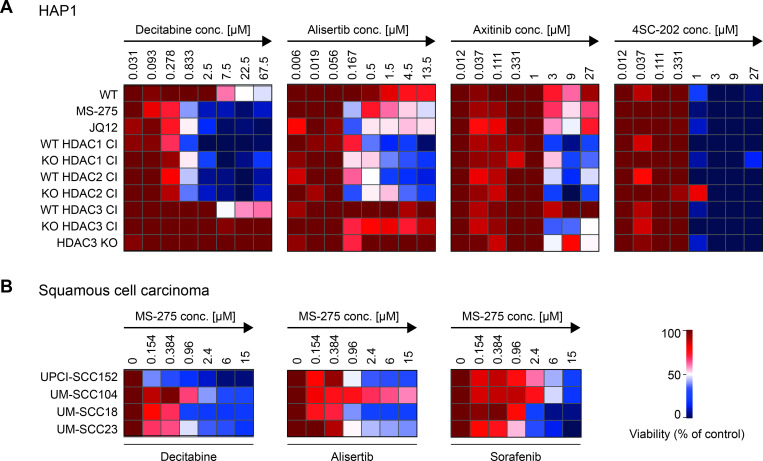
The class I histone deacetylases are essential regulators of cell fate decisions in health and disease. While pan- and class-specific HDAC inhibitors are available, these drugs do not allow a comprehensive understanding of individual HDAC function, or the therapeutic potential of isoform-specific targeting. To systematically compare the impact of individual catalytic functions of HDAC1, HDAC2 and HDAC3, we generated human HAP1 cell lines expressing catalytically inactive HDAC enzymes. Using this genetic toolbox we compare the effect of individual HDAC inhibition with the effects of class I specific inhibitors on cell viability, protein acetylation and gene expression. Individual inactivation of HDAC1 or HDAC2 has only mild effects on cell viability, while HDAC3 inactivation or loss results in DNA damage and apoptosis. Inactivation of HDAC1/HDAC2 led to increased acetylation of components of the COREST co-repressor complex, reduced deacetylase activity associated with this complex and derepression of neuronal genes. HDAC3 controls the acetylation of nuclear hormone receptor associated proteins and the expression of nuclear hormone receptor regulated genes. Acetylation of specific histone acetyltransferases and HDACs is sensitive to inactivation of HDAC1/HDAC2. Over a wide range of assays, we determined that in particular HDAC1 or HDAC2 catalytic inactivation mimics class I specific HDAC inhibitors. Importantly, we further demonstrate that catalytic inactivation of HDAC1 or HDAC2 sensitizes cells to specific cancer drugs. In summary, our systematic study revealed isoform-specific roles of HDAC1/2/3 catalytic functions. We suggest that targeted genetic inactivation of particular isoforms effectively mimics pharmacological HDAC inhibition allowing the identification of relevant HDACs as targets for therapeutic intervention.


Conflict of interest statement

The authors have declared that no competing interests exist.

Figures

Fig 1
Fig 1. Study design.
This study compared effects of genetic and pharmacological inactivation of HDAC1/2/3. Genetically modified cell lines expressing catalytically inactivate (CI) transgenic versions of HDAC1/2/3, in addition to cells treated with HDAC inhibitors, were used. The HDAC CI cell lines were investigated as potential novel tool to mimic partial or full HDAC inactivation. This was achieved by expressing transgenic HDAC1, HDAC2 or HDAC3 in the presence (wildtype background) or absence (knockout background) of the respective endogenous HDAC enzyme. We performed a comprehensive comparative approach using the HDAC1/2/3 CI cell lines and cells treated with the HDAC inhibitors JQ12 and MS-275. Based on global acetylome profiling and gene expression analysis, isoform-specific functions of HDAC1/2 and HDAC3 and similarities between genetic and pharmacological inactivation were investigated. A screening approach with anti-cancer drugs further addressed the question, if the HDAC1/2/3 CI model is suitable to study synergistic effects of isoform-specific HDAC inactivation.
Fig 2
Fig 2. Cellular effects caused by HDAC1/2/3 inactivation.
(A) Western blot analysis of HDAC1/2/3 CI transgene expression in the corresponding wildtype (WT) and knockout (KO) backgrounds. Antibodies specific for the FLAG epitope, HDAC1, HDAC2 and HDAC3 were used for detection. Beta-actin was used as loading control. *Note: FLAG-tagged HDAC2 is not recognized by the HDAC2 antibody. (B) Impact of HDAC deletion and inactivation on total cellular deacetylase activity towards histones. The data represent the mean values ± standard deviation (SD) of 4 biological replicates and significance was determined by one-way ANOVA. *p < 0.05, **p < 0.01. (C) Viability analysis of cells treated with increasing concentrations of MS-275 (left) and JQ12 (right) for 72 hours. (D) Proliferation of HDAC1/2/3 CI cells and HDAC3 KO cells measured over 48 hours. (C-D) Mean values ±SD of 3 biological replicates are shown. One-way ANOVA (C) or two-way ANOVA (D) was used to analyze significance. *p < 0.05, **p < 0.01, ***p < 0.001.
Fig 3
Fig 3. Acetylome analysis for cellular substrate identification of HDAC1/2/3.
(A) Quantitative MS workflow. Cells were lysed and proteins were digested with trypsin. Peptides were labelled using TMTpro 16plex reagents, pooled, and fractionated using high pH HPLC. Aliquots for proteome measurements were removed. Acetylated peptides were purified by acetyl-lysine immunoprecipitation. Proteomes and acetylomes were analyzed by LC-MS/MS. Following data processing, acetylation sites were normalized to protein abundance and the effects of HDAC inactivation were assessed in a comparative analysis. (B) Volcano plots displaying global changes in lysine acetylation, induced by 6 hours (upper panel) and 24 hours (lower panel) of MS-275 treatment. Significantly regulated acetyl(K)sites (≥ 1.5-fold change over wildtype cells (dashed lines), padj-value ≤ 0.05) are highlighted in red (non-histone proteins) and blue (histones). Selected sites and gene names of corresponding proteins are annotated.
Fig 4
Fig 4. Histone and non-histone protein acetylation affected by HDAC1/2/3.
(A-B) Heatmaps illustrating acetylation profiles (log2 fold change over wildtype) of a selected set of sites upon 6 or 24 hours of MS-275 treatment or inactivation/deletion of HDAC1/2/3. Acetyl(K)sites are classified as HDAC1/2, HDAC3 or HDAC1/2/3 preferential substrates. (A) Histone substrates. For simplicity, individual hits from histone sub-variants are summarized according to their main types (indicated on the right). Positions of acetyl-lysines in the histone protein are indicated on the left. N-terminal methionines are not considered, to fit the commonly used histone site code. (B) Non-histone substrates, grouped according to their biological function. Corresponding gene names and positions of acetyl-lysines are indicated on the left. *, **: The information for quantification of this site comes from a *dual or **triple acetylated peptide where only one site was confidentially allocated.
Fig 5
Fig 5. Transcriptional control by HDAC1/2/3 catalytic activity.
(A) Enriched gene ontology terms of significantly upregulated genes upon MS-275 treatment (left panel) or HDAC2 inactivation (right panel) (≥ 2-fold change over wildtype cells, padj-value ≤ 0.05), determined with the Enrichr tool. Only genes elevated in both HDAC2 CI clones (wildtype and knockout background) were considered for analysis. (B) Gene set enrichment analysis (GSEA) showing the correlation of NRSF target genes with transcription profiles of MS-275 treated cells (left) and KO HDAC2 CI cells (right). (C) GSEA of genes associated with the nuclear receptor metapathway of transcriptome data of MS-275 treated cells (left) and HDAC3 KO cells (right). (B-C) Running enrichment score (grey line), reflecting to which degree NRSF or nuclear receptor metapathway regulated genes from defined, publicly available lists are overrepresented at the extremes of ranked gene expression data from the indicated cell lines. The gene tags (“Hits”, black lines) indicate the location of the genes from the defined lists within the ranked datasets. The colored bar shows positive (red) and negative (blue) correlations with indicated cell lines. NES (normalized enrichment score) and FDR q-value are indicated for each analysis.
Fig 6
Fig 6. HDAC inactivation sensitizes cells to clinically approved anti-tumor drugs.
(A) The heatmaps illustrate the sensitivity of different HAP1 HDAC1/2/3 CI cell lines or HDACi treated cells to anti-tumor drugs. JQ12 or MS-275 treated cells, HDAC1/2/3 CI expressing cells (in wildtype and knockout background) and HDAC3 KO cells were incubated with increasing concentrations of following drugs: decitabine, alisertib, axitinib and 4SC-202 (negative control), indicated from left to right panel. The screen was performed in duplicate. Mean values, normalized to plate internal positive and negative controls, are shown as relative viability (in %) over the controls. (B) Combinatorial effects of MS-275 and anti-tumor drugs determined for squamous cell carcinoma cell lines. Following cell lines were included: UPCI-SCC152, UM-SCC104, UM-SCC18 and UM-SCC23. The IC50 for the respective tumor drug was determined for each cell line. The heatmaps show how relative IC50 values change upon simultaneous treatment with MS-275 (concentrations are indicated). The color bar represents the relative viability of duplicate screens (in %) over the control. The control was treated with the indicated tumor drug, but not with MS-275 (set as 100%).

Similar articles

Cited by

References

    1. Grunstein M. Histone acetylation in chromatin structure and transcription. Nature. 1997;389(6649):349–52. doi: 10.1038/38664 - DOI - PubMed
    1. Zupkovitz G, Tischler J, Posch M, Sadzak I, Ramsauer K, Egger G, et al.. Negative and positive regulation of gene expression by mouse histone deacetylase 1. Mol Cell Biol. 2006;26(21):7913–28. doi: 10.1128/MCB.01220-06 . - DOI - PMC - PubMed
    1. Wang Z, Zang C, Cui K, Schones DE, Barski A, Peng W, et al.. Genome-wide mapping of HATs and HDACs reveals distinct functions in active and inactive genes. Cell. 2009;138(5):1019–31. doi: 10.1016/j.cell.2009.06.049 . - DOI - PMC - PubMed
    1. Li Y, Seto E. HDACs and HDAC Inhibitors in Cancer Development and Therapy. Cold Spring Harb Perspect Med. 2016;6(10). Epub 2016/09/08. doi: 10.1101/cshperspect.a026831 ; PubMed Central PMCID: PMC5046688. - DOI - PMC - PubMed
    1. Choudhary C, Kumar C, Gnad F, Nielsen ML, Rehman M, Walther TC, et al.. Lysine acetylation targets protein complexes and co-regulates major cellular functions. Science. 2009;325(5942):834–40. Epub 2009/07/18. doi: 10.1126/science.1175371 . - DOI - PubMed

Publication types

MeSH terms