

Differential progression of unhealthy diet-induced hepatocellular carcinoma in obese and non-obese mice
- PMID: 35994501
- PMCID: PMC9394802
- DOI: 10.1371/journal.pone.0272623
Differential progression of unhealthy diet-induced hepatocellular carcinoma in obese and non-obese mice
Abstract
Background: Non-alcoholic fatty liver disease (NAFLD) ranks first among liver diseases in Western countries. NAFLD is typically associated with obesity and diabetes, however it also develops in lean individuals without metabolic syndrome. The prevalence of lean NAFLD is 7 percent in the U.S. and 25-30 percent in some Asian countries. NAFLD starts with excess liver fat accumulation (NAFL), progresses to nonalcoholic steatohepatitis (NASH), cirrhosis and hepatocellular carcinoma (HCC). The pathogenesis of lean NASH-HCC and how it differs from obese NASH-HCC is not well understood.
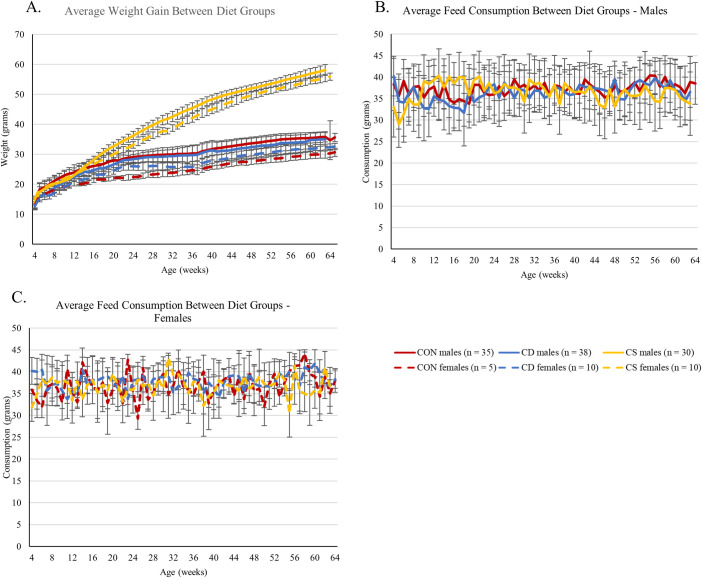
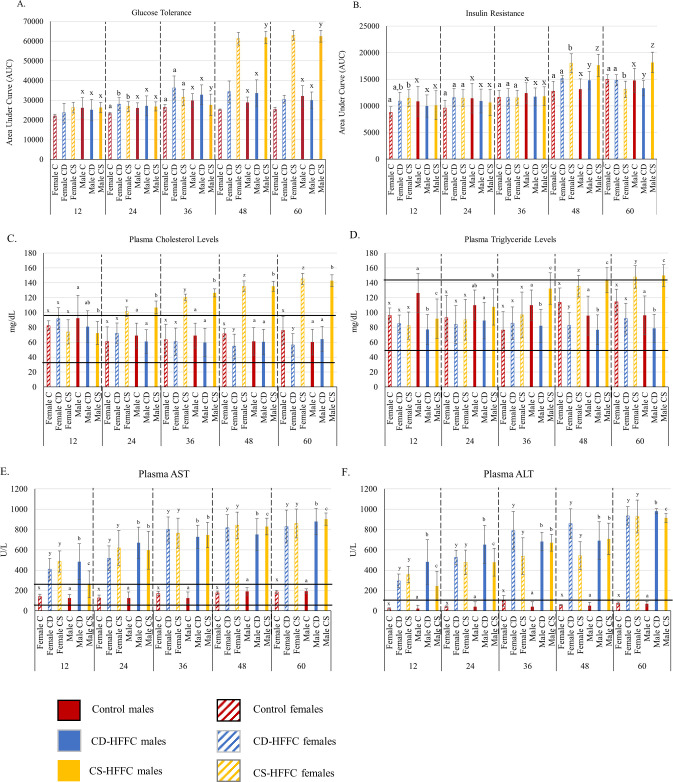
Methods: In this work, we generated a mouse model of lean and obese NASH-HCC using a choline deficient/high trans-fat/fructose/cholesterol diet and a choline supplemented/high trans-fat/fructose/cholesterol diet, respectively, to compare progression to NASH-HCC in lean versus obese mice. Comparisons were made at the organismal, histological, and molecular level by investigating fatty acid metabolism in the plasma of these mice.
Results: Obese mice showed more pronounced glucose intolerance and insulin resistance, higher levels of plasma cholesterol and triglycerides, and higher penetrance of NASH compared to lean mice. Despite the abnormal metabolic profile of obese mice, male obese and lean mice developed HCC with similar penetrance (53.3% and 53.8%, respectively), albeit lean mice showed faster tumor progression as evidenced by the larger tumor size and lower HCC-free survival. None of the female lean mice developed HCC, while 50% of female obese mice developed HCC. Both groups of mice showed a reduction in plasma polyunsaturated fatty acids (PUFAs), however, the levels were higher towards the endpoint in obese mice compared to lean mice.
Conclusions: Unhealthy diet composition appears to drive progression to NASH-HCC rather than the organismal effects of obesity. PUFA levels may increase due to systemic inflammation in obese mice and act as suppressors of tumor progression, thus delaying HCC progression in obese mice compared to lean mice. These models could be used to further dissect the molecular pathogenesis of lean and obese NASH-HCC and address the mechanisms whereby PUFAs may be implicated in hepatocarcinogenesis.
Conflict of interest statement
The authors have declared that no competing interests exist.
Figures


Similar articles
-
Differential methylation patterns in lean and obese non-alcoholic steatohepatitis-associated hepatocellular carcinoma.BMC Cancer. 2022 Dec 6;22(1):1276. doi: 10.1186/s12885-022-10389-7. BMC Cancer. 2022. PMID: 36474183 Free PMC article.
-
Reduction of Polyunsaturated Fatty Acids with Tumor Progression in a Lean Non-Alcoholic Steatohepatitis-Associated Hepatocellular Carcinoma Mouse Model.J Cancer. 2020 Jul 20;11(19):5536-5546. doi: 10.7150/jca.48495. eCollection 2020. J Cancer. 2020. PMID: 32913449 Free PMC article.
-
Differences in metabolic and liver pathobiology induced by two dietary mouse models of nonalcoholic fatty liver disease.Am J Physiol Endocrinol Metab. 2020 Nov 1;319(5):E863-E876. doi: 10.1152/ajpendo.00321.2020. Epub 2020 Sep 14. Am J Physiol Endocrinol Metab. 2020. PMID: 32924526
-
Contribution of organokines in the development of NAFLD/NASH associated hepatocellular carcinoma.J Cell Biochem. 2022 Oct;123(10):1553-1584. doi: 10.1002/jcb.30252. Epub 2022 Jul 12. J Cell Biochem. 2022. PMID: 35818831 Review.
-
Potential for dietary ω-3 fatty acids to prevent nonalcoholic fatty liver disease and reduce the risk of primary liver cancer.Adv Nutr. 2015 Nov 13;6(6):694-702. doi: 10.3945/an.115.009423. Print 2015 Nov. Adv Nutr. 2015. PMID: 26567194 Free PMC article. Review.
Cited by
-
Research advances in traditional Chinese medicine formulae and active components targeting lipid metabolism for hepatocellular carcinoma therapy.Front Pharmacol. 2025 Apr 25;16:1528671. doi: 10.3389/fphar.2025.1528671. eCollection 2025. Front Pharmacol. 2025. PMID: 40351413 Free PMC article. Review.
-
Metabolic Dysfunction-Associated Steatotic Liver Disease: A Silent Driver of Cardiovascular Risk and a New Target for Intervention.Int J Mol Sci. 2025 Aug 21;26(16):8081. doi: 10.3390/ijms26168081. Int J Mol Sci. 2025. PMID: 40869400 Free PMC article. Review.
-
Relationship of Metabolic Dysfunction-Associated Steatohepatitis-Related Hepatocellular Carcinoma with Oral and Intestinal Microbiota: A Cross-Sectional Pilot Study.Medicina (Kaunas). 2024 Jul 17;60(7):1150. doi: 10.3390/medicina60071150. Medicina (Kaunas). 2024. PMID: 39064580 Free PMC article.
-
Sex difference in liver diseases: How preclinical models help to dissect the sex-related mechanisms sustaining NAFLD and hepatocellular carcinoma.iScience. 2023 Oct 30;26(12):108363. doi: 10.1016/j.isci.2023.108363. eCollection 2023 Dec 15. iScience. 2023. PMID: 38034347 Free PMC article. Review.
-
Differential methylation patterns in lean and obese non-alcoholic steatohepatitis-associated hepatocellular carcinoma.BMC Cancer. 2022 Dec 6;22(1):1276. doi: 10.1186/s12885-022-10389-7. BMC Cancer. 2022. PMID: 36474183 Free PMC article.
References
Publication types
MeSH terms
Substances
Grants and funding
LinkOut - more resources
Full Text Sources
Medical
