. 2022 Aug 30;119(35):e2116655119.
doi: 10.1073/pnas.2116655119. Epub 2022 Aug 22.

A weakened AMOC may prolong greenhouse gas-induced Mediterranean drying even with significant and rapid climate change mitigation

Affiliations

A weakened AMOC may prolong greenhouse gas-induced Mediterranean drying even with significant and rapid climate change mitigation

Thomas L Delworth et al. Proc Natl Acad Sci U S A. .

Abstract

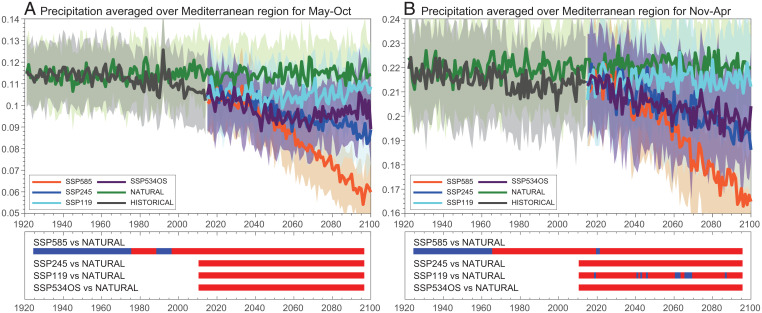
The Mediterranean region has been identified as a climate hot spot, with models projecting a robust warming and rainfall decline in response to increasing greenhouse gases. The projected rainfall decline would have impacts on agriculture and water resources. Can such changes be reversed with significant reductions in greenhouse gases? To explore this, we examine large ensembles of a high-resolution climate model with various future radiative forcing scenarios, including a scenario with substantial reductions in greenhouse gas concentrations beginning in the mid-21st century. In response to greenhouse gas reductions, the Mediterranean summer rainfall decline is reversed, but the winter rainfall decline continues. This continued winter rainfall decline results from a persistent atmospheric anticyclone over the western Mediterranean. Using additional numerical experiments, we show that the anticyclone and continued winter rainfall decline are attributable to greenhouse gas-induced weakening of the Atlantic Meridional Overturning Circulation (AMOC) that continues throughout the 21st century. The persistently weak AMOC, in concert with greenhouse gas reductions, leads to rapid cooling and sea ice growth in the subpolar North Atlantic. This cooling leads to a strong cyclonic atmospheric circulation anomaly over the North Atlantic subpolar gyre and, via atmospheric teleconnections, to the anticyclonic circulation anomaly over the Mediterranean. The failure to reverse the winter rainfall decline, despite substantial climate change mitigation, is an example of a "surprise" in the climate system. In this case, a persistent AMOC change unexpectedly impedes the reversibility of Mediterranean climate change. Such surprises could complicate pathways toward full climate recovery.

Keywords: AMOC; Mediterranean; climate; mitigation; rainfall.


Conflict of interest statement

The authors declare no competing interest.

Figures

Fig. 1.
Fig. 1.
(A) Time series of global mean, annual mean surface air temperature. For all time series in A, values plotted are differences with respect to ensemble mean, time mean values over the period 1931 to 1960. Legend in A also applies to B. The curves labeled “OBS GISS” and “OBS HadCRUT” are observational time series (Methods). (B) Time series of annual mean, global mean precipitation (units are cm day−1). The thick solid lines in each panel indicate the 30-member ensemble means, while the shaded regions indicate the range of the ensemble members. The dashed black line in each panel indicates the mean value over the period 2011 to 2020.
Fig. 2.
Fig. 2.
(A) (Top) The time series of precipitation (units are cm day−1) averaged over May to October over the Mediterranean (10°W to 38°E, 32°N to 44°N) for various ensembles. Thick solid lines indicate the 30-member ensemble means, while the shaded regions indicate +/- one standard deviation of the departures of the ensemble members from the ensemble mean. (B) Same as A but for November to April. (Bottom) Assessment of when various ensembles differ from the natural ensemble. A sliding 10-y window is used to test whether the distribution of values from either SSP119, SSP245, SSP585, or SSP534OS is significantly different from the corresponding distribution of values from the natural simulation. For example, at year 2026, the distribution formed from all precipitation value for years 2021 to 2031 in the 30 members of the SSP119 simulation (330 values total) is compared to corresponding precipitation values from years 2021 to 2031 from the natural simulation. A two-sided Kolmogorov–Smirnov test (MATLAB routine kstest2) is used to assess whether the distributions are significantly different at the 1% level. If the distributions are different, the appropriate bar is shaded red for year 2026; if not, the bar is shaded blue. Thus, for each pair of experiments (for example, SSP119 versus natural), there is a row with one shaded box per year, where the box is shaded red if the distributions over that 10-y window are significantly different and blue if they are not. Note that for the SSP585 versus natural comparison, years 1921 to 2014 from the historical simulation are combined with years 2015 to 2100 from the SSP585 simulation and then compared to the 1921 to 2100 natural simulation.
Fig. 3.
Fig. 3.
Time series of indices of the AMOC. Units are Sv. See Methods for further details of computing the indices. (A) AMOC index at 45°N. (B) AMOC index at 26°N. For all time series in A and B the thick solid lines indicate the 30-member ensemble means, while the shaded regions indicate the range of the ensemble members. The observations in B are from the RAPID array at 26°N in the North Atlantic for 2005 to 2019.
Fig. 4.
Fig. 4.
(A) Time series of Arctic sea ice extent in September. Units are 1012 m2. (B) Same as A but for March. For all time series in A and B the thick solid lines indicate the 30-member ensemble means, while the shaded regions indicate the range of the ensemble members. Observed sea ice extent from Fetterer et al. (51).
Fig. 5.
Fig. 5.
Differences for (A and B) surface air temperature and (C and D) 500 hPa geopotential height for experiment SSP534OS. The differences are calculated as the mean over 2081 to 2100 minus the mean over 2046 to 2065. Units for temperature are °C and meters for 500 hPa geopotential height. For geopotential height the zonal mean was removed prior to plotting in order to accentuate regional structures. (A) Difference in surface air temperature for November to April (NDJFMA). (B) Same as A but for May to October (MJJASO). (C) Difference in 500 hPa geopotential height (NDJFMA). (D) Same as C but for MJJASO.
Fig. 6.
Fig. 6.
Results from an ensemble of simulations called “SSP534OS_STRONG_AMOC” (described in main text and in Mechanisms of the Persistent Mediterranean Winter Rainfall Decline). This tests the linkage between AMOC strength and the response of Mediterranean winter precipitation to greenhouse gas changes. (A) Indices of the AMOC at 45°N for SSP534OS (black) and SSP534OS_STRONG_AMOC (red). (B) Difference in winter (NDJFMA) surface air temperature for 2081 to 2100 for SSP534OS_STRONG_AMOC minus SSP534OS. Units are °C. (C) Same as B but for 500 hPa geopotential height. Units are meters. (D) Winter (NDJFMA) precipitation averaged over the Mediterranean for SSP534OS (black) and SSP534OS_STRONG_AMOC (red). Units are cm day−1.

References

    1. Seneviratne S. I., Hauser M., Regional climate sensitivity of climate extremes in CMIP6 versus CMIP5 multimodel ensembles. Earths Futur. 8, EF001474 (2020). - PMC - PubMed
    1. Otto F. E. L., et al. , Anthropogenic influence on the drivers of the Western Cape drought 2015–2017. Environ. Res. Lett. 13, 124010 (2018).
    1. Diffenbaugh N. S., Swain D. L., Touma D., Anthropogenic warming has increased drought risk in California. Proc. Natl. Acad. Sci. U.S.A. 112, 3931–3936 (2015). - PMC - PubMed
    1. Swain D. L., Langenbrunner B., Neelin J. D., Hall A., Increasing precipitation volatility in twenty-first-century California. Nat. Clim. Chang. 8, 427–433 (2018).
    1. Betts R. A., et al. , Changes in climate extremes, fresh water availability and vulnerability to food insecurity projected at 1.5°C and 2°C global warming with a higher-resolution global climate model. Philos. Trans. R. Soc. Math. Phys. Eng. Sci. 376, 20160452 (2018). - PMC - PubMed

Publication types

Substances