. 2022 Aug 30;119(35):e2114064119.
doi: 10.1073/pnas.2114064119. Epub 2022 Aug 22.

Exploiting breakdown in nonhost effector-target interactions to boost host disease resistance

Affiliations

Exploiting breakdown in nonhost effector-target interactions to boost host disease resistance

Hazel McLellan et al. Proc Natl Acad Sci U S A. .

Abstract

Plants are resistant to most microbial species due to nonhost resistance (NHR), providing broad-spectrum and durable immunity. However, the molecular components contributing to NHR are poorly characterised. We address the question of whether failure of pathogen effectors to manipulate nonhost plants plays a critical role in NHR. RxLR (Arg-any amino acid-Leu-Arg) effectors from two oomycete pathogens, Phytophthora infestans and Hyaloperonospora arabidopsidis, enhanced pathogen infection when expressed in host plants (Nicotiana benthamiana and Arabidopsis, respectively) but the same effectors performed poorly in distantly related nonhost pathosystems. Putative target proteins in the host plant potato were identified for 64 P. infestans RxLR effectors using yeast 2-hybrid (Y2H) screens. Candidate orthologues of these target proteins in the distantly related non-host plant Arabidopsis were identified and screened using matrix Y2H for interaction with RxLR effectors from both P. infestans and H. arabidopsidis. Few P. infestans effector-target protein interactions were conserved from potato to candidate Arabidopsis target orthologues (cAtOrths). However, there was an enrichment of H. arabidopsidis RxLR effectors interacting with cAtOrths. We expressed the cAtOrth AtPUB33, which unlike its potato orthologue did not interact with P. infestans effector PiSFI3, in potato and Nicotiana benthamiana. Expression of AtPUB33 significantly reduced P. infestans colonization in both host plants. Our results provide evidence that failure of pathogen effectors to interact with and/or correctly manipulate target proteins in distantly related non-host plants contributes to NHR. Moreover, exploiting this breakdown in effector-nonhost target interaction, transferring effector target orthologues from non-host to host plants is a strategy to reduce disease.

Keywords: effector-triggered susceptibility; host range; oomycete; plant immunity; plant–microbe interactions.


Conflict of interest statement

The authors declare no competing interest.

Figures

Fig. 1.
Fig. 1.
Effectors function poorly as virulence factors in a nonhost pathosystem. Agrobacterium-mediated transient expression of (A) P. infestans and (B) H. arabidopsidis (Ha) RxLR effectors in N. benthamiana followed by challenge with P. infestans and lesion diameter measurement at 7 days post-infection (dpi). Data for each effector are expressed as a fold change to the internal GFP or HA-GFP constructs, which were set to one. Sporangiophore counts per seedling at 4 dpi with Hpa of transgenic Arabidopsis expressing (C) HaRxL and (D) PiRxLR effectors under control of the Cauliflower mosaic virus (CaMV 35S) promoter. Data for two or three independent transgenic lines (indicated as a, b, and c) are shown for each effector. Sporangiophore counts are normalized to the counts of Columbia-4 (Col-4) wild type (WT) plants conducted at the same time with Col-4 set to one. Col-4 lines expressing GFP and Columbia-0 (Col-0) expressing ß-glucuronidase (GUS) were used as additional negative controls. A line expressing HaRxL14a was used in D as a susceptible control. Graphs show combined data from at least three independent replications of each experiment. Error bars are SE. Asterisks indicate significant differences as tested pairwise by the Student’s t test or the Mann–Whitney rank sum test. *P ≤ 0.05; **P ≤ 0.01; ***P ≤ 0.001.
Fig. 2.
Fig. 2.
PiRXLR cY2H interaction network in potato. (A) Network diagram representation of the cY2H interaction network of 64 PiRxLR effectors (yellow circles) with 169 potato candidate target proteins (green circles). Straight edges indicate 215 protein–protein interactions. (B) Histogram showing the distribution of counts of PiRxLR effectors interacting with a given number of candidate target proteins (equivalent to the degree for each PiRxLR node in A). (C) Histogram showing the distribution of counts of candidate potato target proteins interacting with a given number of PiRXLR effectors (equivalent to the degree for each candidate target protein in A).
Fig. 3.
Fig. 3.
Using a library based on interacting nonhost orthologs enriches for pathogen effector protein–protein interactions (PPIs). (A) Network diagram representation of the candidate AtOrths (green circles) of potato cY2H targets, which were identified and cloned. Yellow circles show the PiRxLRs anticipated to interact with cAtOrths based on interactions with potato counterparts (Fig. 2). Straight edges indicate PPIs, and gray circles and edges indicate noncloned orthologs and untestable interactions, respectively. (B) Network diagram representing the newly identified MoY2H PPIs detected between cAtOrths (green circles) and HaRxLs (blue circles) or PiRxLRs (yellow circles). AtOrths not cloned or not interacting (gray circles) and untestable or no interactions detected (gray edges) are also shown. (C) Schematic representation of the four different categories of PPIs identified alongside an explanation and the numbers involved. Colors and shapes are as described in B, Arabidopsis thaliana (At), Hyaloperonospora arabidopsidis (Ha), Solanum tuberosum (St). (D) Histogram showing the count of AtOrths that interact with a given number of HaRxL effectors. (E) The graph shows a significant (P < 1e−05) increase in HaRxL interactions observed (red arrow) compared with the level expected by random sampling modeling analysis.
Fig. 4.
Fig. 4.
Screening of selected cAtOrths for altered resistance. The graph shows P. infestans lesion diameters following Agrobacterium-mediated transient expression of cMYC-cAtOrths in N. benthamiana. Measurements were taken at 7 days post-infection (dpi), and data for each ortholog are expressed as a fold change to the internal cMYC empty vector (EV) control, which was normalized to a value of one. Error bars are SE. The graph shows combined data from greater than or equal to three independent replications of each experiment (n ≥ 108). Numbers in parentheses represent the interaction category (Dataset S3). Asterisks indicate significant differences as tested pairwise by the Student’s t test or the Mann–Whitney rank sum test. *P ≤ 0.05; **P ≤ 0.01.
Fig. 5.
Fig. 5.
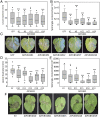
Transgenic plants overexpressing AtPub33 show increased resistance to P.infestans. (A) The box plot shows P. infestans lesion diameters in five independent transgene generation 2 (T2) N. benthamiana lines expressing cMYC-AtPUB33 compared with a T2 cMYC-GFP control. (B) The box plot shows P. infestans sporangia recovered per milliliter in five independent T2 N. benthamiana lines expressing cMYC-AtPUB33 compared with a T2 cMYC-GFP control. (C) Representative leaf images showing P. infestans lesions on five independent T2 N. benthamiana lines expressing cMYC-AtPUB33 compared with a T2 cMYC-GFP control. (D) The box plot shows P. infestans lesion diameters in five independent potato transgenic lines expressing untagged AtPUB33 compared with an empty vector (EV) control. (E) The box plot shows P. infestans sporangia recovered per milliliter in five independent potato transgenic lines expressing untagged AtPUB33 compared with an EV control. (F) Representative leaf images showing P. infestans lesions on five independent potato transgenic lines expressing untagged AtPUB33 compared with an EV control. Graphs and box plots show combined data from greater than or equal to three independent replications of the experiments. Circles on box plots indicate 5th and 95th percentile outliers. Asterisks indicate significant differences as tested by one-way ANOVA or Kruskal–Wallis one-way ANOVA on ranks with multiple comparisons vs. the control group using the Holm–Sidak method. *P ≤ 0.05; **P ≤ 0.01; ***P ≤ 0.001.

References

    1. Jones J. D. G., Dangl J. L., The plant immune system. Nature 444, 323–329 (2006). - PubMed
    1. Win J., et al. , Effector biology of plant-associated organisms: Concepts and perspectives. Cold Spring Harb. Symp. Quant. Biol. 77, 235–247 (2012). - PubMed
    1. Panstruga R., Moscou M. J., What is the molecular basis of nonhost resistance? Mol. Plant Microbe Interact. 33, 1253–1264 (2020). - PubMed
    1. Uma B., Rani T. S., Podile A. R., Warriors at the gate that never sleep: Non-host resistance in plants. J. Plant Physiol. 168, 2141–2152 (2011). - PubMed
    1. Schulze-Lefert P., Panstruga R., A molecular evolutionary concept connecting nonhost resistance, pathogen host range, and pathogen speciation. Trends Plant Sci. 16, 117–125 (2011). - PubMed

Publication types

MeSH terms

LinkOut - more resources